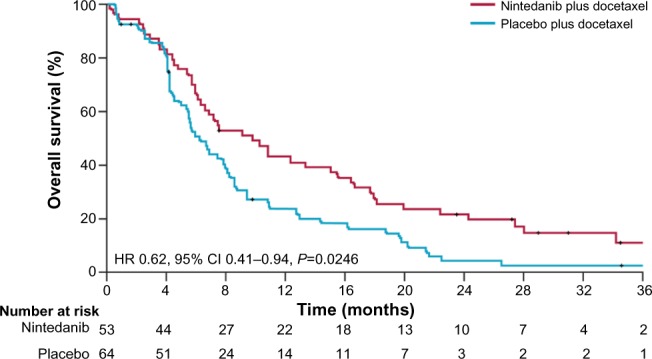
Figure 3.

Kaplan–Meier curves for patients treated with nintedanib plus docetaxel or placebo plus docetaxel. Exploratory analysis in patients with adenocarcinoma histology and progressive disease as best response to first-line therapy.
Abbreviations: CI, confidence interval; HR, hazard ratio.
