

Abstract
Objectives
To prospectively compare in healthy rats the effect of multiple injections of macrocyclic (gadoterate meglumine) and linear (gadodiamide) gadolinium-based contrast agents (GBCAs) on T1-weighted signal intensity in the deep cerebellar nuclei (DCN), including the dentate nucleus.
Materials and Methods
Healthy rats (n = 7/group) received 20 intravenous injections of 0.6 mmol of gadolinium (Gd) per kilogram (4 injections per week during 5 weeks) of gadodiamide, gadoterate meglumine, or hyperosmolar saline (control group). Brain T1-weighted magnetic resonance imaging was performed before and once a week during the 5 weeks of injections and during 5 additional weeks (treatment-free period). Gadolinium concentrations were measured with inductively coupled plasma mass spectrometry in plasma and brain. Blinded qualitative and quantitative evaluations of the T1 signal intensity in DCN were performed, as well as a statistical analysis on quantitative data.
Results
A significant and persistent T1 signal hyperintensity in DCN was observed only in gadodiamide-treated rats. The DCN-to-cerebellar cortex signal ratio was significantly increased from the 12th injection of gadodiamide (1.070 ± 0.024) compared to the gadoterate meglumine group (1.000 ± 0.033; P < 0.001) and control group (1.019 ± 0.022; P < 0.001) and did not significantly decrease during the treatment-free period. Total Gd concentrations in the gadodiamide group were significantly higher in the cerebellum (3.66 ± 0.91 nmol/g) compared with the gadoterate meglumine (0.26 ± 0.12 nmol/g; P < 0.05) and control (0.06 ± 0.10 nmol/g; P < 0.05) groups.
Conclusions
Repeated administrations of the linear GBCA gadodiamide to healthy rats are associated with progressive and persistent T1 signal hyperintensity in the DCN, with Gd deposition in the cerebellum in contrast with the macrocyclic GBCA gadoterate meglumine for which no effect was observed.
Key Words: signal intensity, dentate nucleus, deep cerebellar nuclei, magnetic resonance, cumulative doses, gadolinium, contrast agent, gadoterate meglumine, gadodiamide
Gadolinium (Gd)-based contrast agents (GBCA) are widely used in magnetic resonance (MR) examinations for detection of a large variety of brain pathologic processes, including inflammation, infection, and malignancy.1 The efficacy of the GBCAs approved for central nervous system imaging has been amply demonstrated since the end of the 80s, and these agents are generally associated with an excellent safety profile.
However, in the past decade, two major clinical studies questioned this safety profile. First, in 2006, Grobner2 linked the occurrence of nephrogenic systemic fibrosis and the administration of GBCAs in patients with severe renal impairment. After nearly 10 years of extensive research, this link is now accepted and associated with the relatively lower in vivo stability of some linear GBCA leading to the risk of Gd release. Second, in 2014, Kanda et al reported a significant relationship between T1-weighted (T1w) signal hyperintensity observed in specific brain regions (globus pallidus and dentate nucleus) in patients with normal renal function and the number of prior contrast-enhanced MR imaging (MRI) scans.3 To date, 5 other studies confirmed this correlation for patients exposed to more than 6 contrast-enhanced MRI examinations.4–7 Notably, Kanda et al6 and, more recently, Radbruch et al8 reported that the T1w signal hyperintensity was observed after repeated administrations of linear GBCA (gadodiamide and meglumine gadopentetate, respectively) but not with macrocyclic GBCA (gadoteridol and gadoterate meglumine, respectively).
These results strongly suggest long-term Gd deposit in cerebellar regions (especially in the dentate nucleus) but failed to provide any evidence of Gd retention in brain owing to the absence of Gd assays. Very recently, the presence of elemental Gd was demonstrated in various sites of the autopsied brains of patients exposed to at least 4 gadodiamide-enhanced MR examinations.9 This effect was significantly correlated with the cumulative Gd dose received. The gadodiamide-treated patients demonstrated a significant dose-T1 signal intensity positive correlation. No such effect was observed in the control group.
The purpose of the present study was to determine the brain T1 signal in the deep cerebellar nuclei (DCN), including the dentate nucleus, in an animal model before, during, and after repeated administrations of GBCA according to the following: (1) molecular structure of the GBCA (ie, linear vs macrocyclic), (2) cumulative dose, and (3) time elapsed since the last injection (to detect a possible washout effect). For this purpose, we compared the dose- and time-dependent signal enhancement of DCN after repeated administrations of gadodiamide or gadoterate meglumine in healthy rats with normal renal function and no brain disease.
MATERIALS AND METHODS
All animal experiments were conducted in accordance with French regulations and in compliance with the European Union Directives 2010/63/EU. The studies were performed in the Guerbet research laboratories by Guerbet employees except for the qualitative MR images analysis, which was performed by 2 independent board-certified neuroradiologists (S.L. and S.G.) with no conflict of interest. All experiments (injections, MRI, image analysis, and dosage) were conducted blindly. Group allocation of animals was randomized.
Animal Model and Injection of Contrast Agents
All injections were performed under general anesthesia (3%–3.5% isoflurane; IsoFlo, Axience, Pantin, France). Healthy female Sprague-Dawley rats (SPF/OFA female rats, Charles River, L'Arbresle, France) weighing 210 ± 29 g at the beginning of the study, received 20 intravenous injections of 0.6 mmol of Gd per kilogram (1.2 mL/kg) over a period of 5 weeks (4 daily and consecutive injections per week). The daily dose of 0.6 mmol Gd per kilogram is equivalent to the usual human dose of GBCAs (0.1 mmol of Gd per kilogram or 0.2 mL/kg), after adjustment for body surface area as recommended by the Food and Drug Administration.10 Three groups (7 rats per group) were compared: gadodiamide (linear and nonionic GBCA, Omniscan, 500 mmol/L, GE Healthcare, Chalfont St Giles, UK, batch 12361724), gadoterate meglumine (macrocyclic and ionic GBCA, Dotarem 500 mmol/L, Guerbet, Villepinte, France, batch 2Gd073B) and a control group (1350 mOsm/kg H2O hyperosmolar saline, similar to that of the gadoterate meglumine solution). A behavioral examination was performed daily.
MRI Protocol
T1-weighted MRI was performed under general anesthesia (3%–3.5% isoflurane) before the first GBCA administration and once a week during the treatment period (ie, after the fourth, eighth, 12th, 16th, and 20th injections) and for an additional 5-week treatment-free period (Fig. 1). During the administration period, MRI examination was performed 3 days after the last administration. Magnetic resonance imaging was performed with a dedicated quadrature brain coil (RAPID Biomedical GmbH, Rimpar, Germany) on a 2.35 T preclinical magnet (BioSpec 24/40, Bruker, Ettlingen, Germany) using a T1w-RARE sequence: repetition time/echo time, 525 milliseconds (ms)/10 ms, 36 averages; in plane resolution, 156 × 156 μm2; slice thickness, 800 μm; acquisition time, 15 minutes 8 seconds. The scan range of the MRI sequence covered the cerebellum only (10 slices). After the last MRI examination, all animals were sacrificed by exsanguination under anesthesia, and the brains were harvested for total Gd determination.
FIGURE 1.
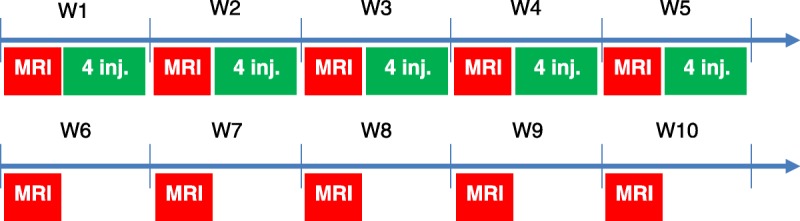
Injection and MRI scheme. Four injections of 0.6 mmol of Gd per kilogram per week were performed for 5 weeks.
Image Analysis
All image analyses were performed under blinded and randomized conditions. Qualitative and quantitative evaluations of DCN T1 signal intensity were performed.
Qualitative Analysis
Randomized qualitative evaluation of DCN enhancement was performed by 2 independent and board-certified neuroradiologists (S.L. and S.G.). Readers were blinded for the group and the time points. Variable window and level settings were used when reviewing MR images. A 3-point scoring scale of DCN relative to adjacent cerebellar cortex high signal intensity was applied: score 0 for no detectable signal enhancement; score 1 for doubtful enhancement; and score 2 for definite enhancement. Mean score per group was plotted for each reader.
Quantitative Analysis
Randomized quantitative evaluation of the signal was performed by positioning a region of interest (ROI) over the most visible of the 2 DCN zones (Fig. 2A) and over a reference zone in the adjacent cerebellar cortex. Region of interest positioning was performed blindly for the groups and time points. Signal intensity ratio was calculated as the ratio of the DCN signal to the cerebellar cortex signal: DCN/cerebellar cortex ratio (ROI-1 and ROI-2 on Fig. 2B).
FIGURE 2.
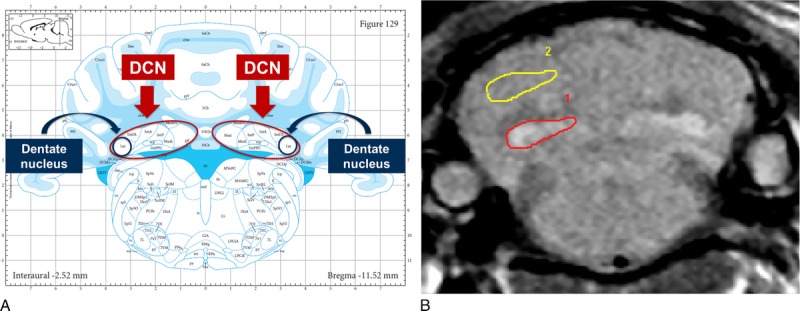
A, Anatomy of rat brain: localization of the deep cerebellar nuclei (DCN) and dentate nucleus. Extracted from Paxinos and Watson11 with permission. B, Regions of interest (ROI) positioning for quantitative analysis. Signal intensity ratio was calculated as the ratio of DCN signal to adjacent cerebellum signal (ROI-1/ROI-2).
Determination of Brain and Plasma Gd Concentrations
Rats were euthanized under isoflurane anesthesia by exsanguination at the end of the treatment-free period. Two rats were excluded from dosing after a random selection in each of the contrast agent groups for future microanalysis studies. One rat (control group) died during the anesthesia of the 14th injection. The brains of 6 rats per group were removed and dissected to sample cerebellum, cerebral cortex, and subcortical brain. Total Gd concentrations were measured in biological samples with inductively coupled plasma mass spectrometry (7700×, Agilent Technologies, Santa Clara, CA) after mineralization in 65% nitric acid at 80°C for 8 hours followed by dilution in water. A standard curve of inorganic Gd (0.05–100 μg/L) in 6.5% HNO3 was used by monitoring the response of the 158Gd isotope. The limit of quantification was 0.32 nmol of Gd per liter, and the limit of detection was 0.10 nmol of Gd per liter. The acceptance limits (total error) were set at ± 14%. Results are expressed in nanomole (nmol) of Gd per gram of wet tissue weight (tissue samples) or micromole of Gd per liter of plasma.
Statistical Analysis
For qualitative analysis, a reader effect between the 2 blinded neuroradiologists was evaluated by means of multinomial regression model with one factor. For quantitative analyses of the signal ratio, differences between the 3 groups were tested at each time point with a two way analysis of variance (ANOVA). The time-course of the DCN/cerebellar cortex ratio was evaluated by analyzing the potential progressive increase or decrease of the signal ratio during the injection phase and treatment-free periods by means of a regression test and a lack-of-fit test. Lastly, differences in tissue Gd content were tested with ANOVA or Kruskal-Wallis test after checking the normal distribution. All analyses are performed with SAS version 9.2 (SAS, Cary, NC, USA). P < 0.05 was considered to indicate significant difference.
RESULTS
Twenty rats completed the protocol. One rat (control group) died during the anesthesia of the 14th injection at week 4.
Qualitative Imaging
Figures 3 (gadodiamide), 4 (gadoterate meglumine), and 5 (control) show typical examples of brain MRI during both the injection and the treatment-free periods. Figure 6 displays DCN T1w MR images of all animals on completion of the 10-week study period. Qualitatively, after a randomized reading of the 200 images (20 rats × 10 weeks follow-up) by the 2 blinded neuroradiologists, increase in signal intensity was detected only in the gadodiamide group by both readers (Fig. 7). A good agreement was observed between the 2 readers. No reader effect was demonstrated by the 2 blinded neuroradiologists (P = 0.1). Compared to the preinjection DCN/cerebellar cortex ratio, a marked difference was progressively observed between gadodiamide and gadoterate meglumine or hyperosmolar saline during the injection period. The T1 signal hyperintensity in the DCN remained stable during the treatment-free period and was qualitatively equivalent between the end of the treatment period (ie, at 5 weeks) and at completion of the treatment-free period (ie, at 10 weeks) in the gadodiamide group. No difference was detected between gadoterate meglumine and control at any time point. No statistical results are presented owing to the poor convergence of the multinomial model (insufficient number of degrees of freedom due to the repeated data).
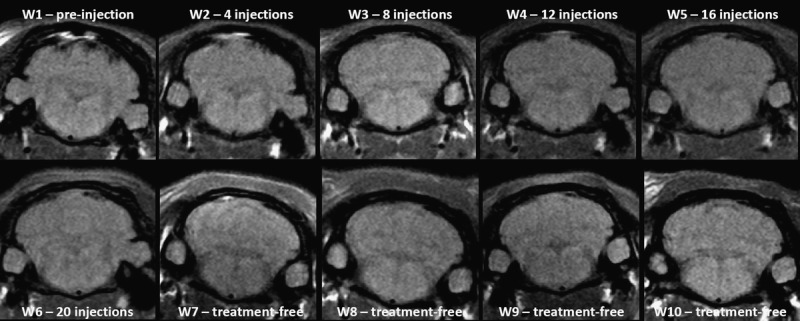
FIGURE 3.
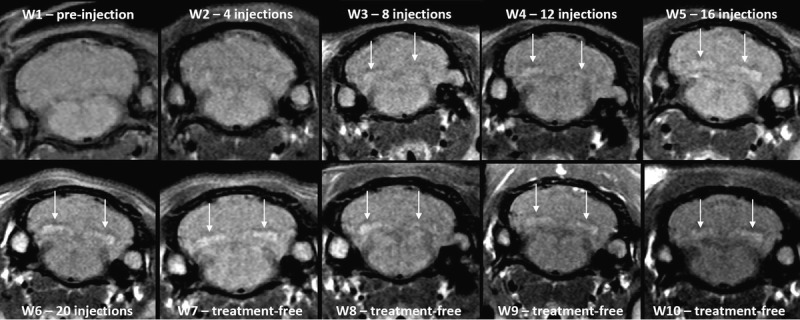
Representative T1w MRI follow-up in the gadodiamide group revealed a significant T1 signal hyperintensity in DCN from the eighth administration.
FIGURE 4.
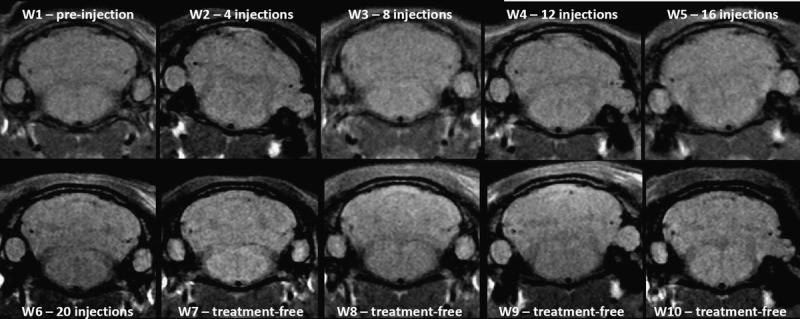
Representative T1w MRI follow-up in the gadoterate meglumine group did not reveal any T1 signal in DCN.
FIGURE 5.
Representative T1w MRI follow-up in the control group revealed no T1 signal hyperintensity in the DCN.
FIGURE 6.
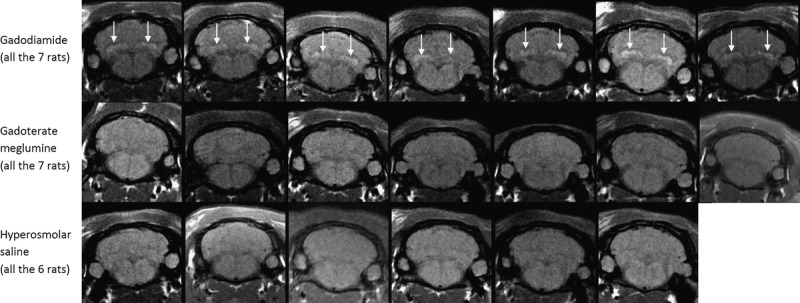
T1w MRI at week 10 (completion of the treatment-free period; all rats).
FIGURE 7.
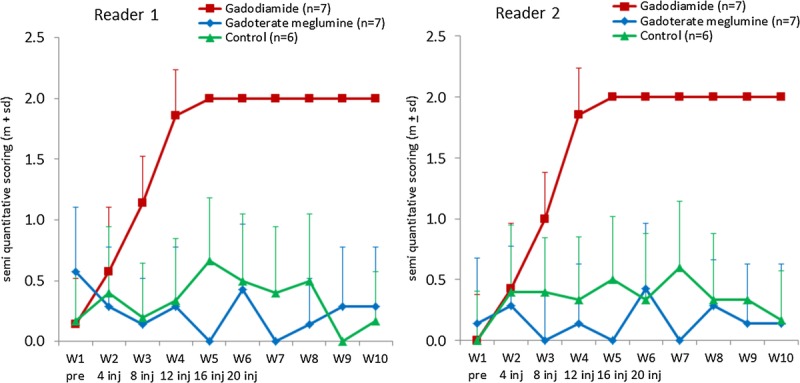
Temporal changes in qualitative blinded evaluation of the T1w signal hyperintensity between DCN area and cerebellar cortex (mean ± SD).
Quantitative Imaging
Quantitatively, no differences were observed between the 3 groups before any injection (P = 0.5). However, a significant increase in the DCN/cerebellar cortex ratio was observed only in the gadodiamide-treated group from the 12th injection compared to both gadoterate meglumine and control groups: 1.070 ± 0.024 vs 1.000 ± 0.033 (P < 0.001) and 1.019 ± 0.022 (P < 0.001), respectively (Fig. 8). This increase was dose dependent throughout the injection period (positive linearity test, P < 0.0001). All rats that received gadodiamide had an increase in the DCN/cerebellar cortex ratio. The maximum value was reached for each rat from the 12th to the 20th injection of gadodiamide. This DCN/cerebellar cortex ratio persisted at completion of the treatment-free period and did not significantly decrease during the 5-week period after the last injection (P = 0.1). No difference was observed between gadoterate meglumine and control groups at any time point. However, a slight but significant linear decrease was observed for the gadoterate meglumine group and the control group from week 1 to week 10 (positive linearity test, P < 0.0001).
FIGURE 8.
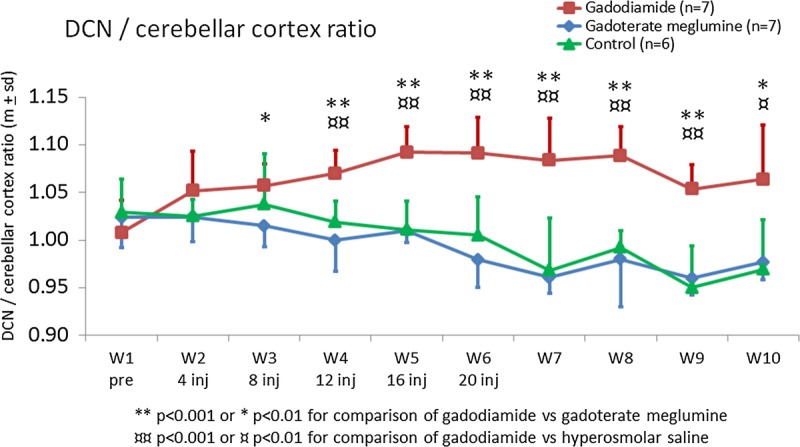
Temporal changes in DCN/cerebellar cortex T1w signal ratio (mean ± SD).
Total Gd Concentrations in Brain Structures
Normality test was positive for cerebral cortex and subcortical brain Gd concentration, enabling a parametric ANOVA test. The Gd concentration in the cerebellum was analyzed with nonparametric Kruskal-Wallis test because of the negative normality test. The total Gd concentration was 8- to 52-fold higher in the brain after gadodiamide compared to gadoterate meglumine or control: total Gd concentrations were higher in the cerebellum (3.66 ± 0.91 nmol/g), cerebral cortex (2.32 ± 0.46 nmol/g), and subcortical brain (2.47 ± 0.62 nmol/g) in the gadodiamide group versus the control group (0.07 ± 0.10 nmol/g, P < 0.05; 0.17 ± 0.20 nmol/g, P < 0.001; 0.08 ± 0.06 nmol/g, P < 0.001) and the gadoterate meglumine group (0.26 ± 0.12 nmol/g, P < 0.05; 0.30 ± 0.08 nmol/g, P < 0.001; 0.30 ± 0.10 nmol/g, P < 0.001) (Fig. 9). Gadolinium concentration in subcortical brain was significantly higher in the gadoterate meglumine group than in the control group (0.30 ± 0.10 vs 0.08 ± 0.06 nmol/g, respectively; P < 0.01). Plasma total Gd concentrations could not be determined in any of the test groups (values below the lower limit of quantification).
FIGURE 9.
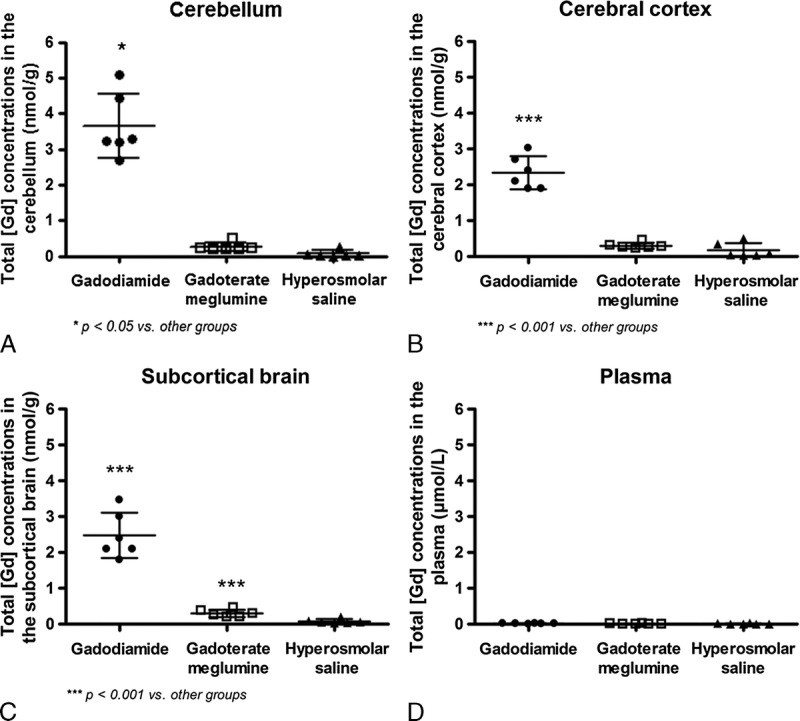
Total Gd concentrations in the cerebellum (A), cerebral cortex (B), subcortical brain (C), and plasma (D) at completion of the treatment-free period (week 10). Individual values, mean, and SD are given.
DISCUSSION
The present study in healthy rats demonstrates, for the first time, a progressive and persistent brain T1w signal hyperintensity in the DCN, including dentate nucleus, after repeated administrations of the linear GBCA gadodiamide. Interestingly, this effect was qualitatively observed in this animal model from the eighth injection of gadodiamide, which is close to the threshold of 6 injections reported in humans to observe signal hyperintensity in the dentate nucleus.3–7 Quantitatively, compared to gadoterate meglumine, this signal hyperintensity in DCN was significantly increased from the 12th injection of gadodiamide. In this rat study, signal hyperintensity in DCN did not resolve during the 5-week treatment-free period, suggesting no washout effect and the persistence of this phenomenon for a long time after the last administration of gadodiamide. No signal hyperintensity was observed in the DCN with the macrocyclic gadoterate meglumine, which is consistent with a recent clinical study.8 The T1w signal hyperintensity was associated with a significantly higher Gd concentration in the brain of gadodiamide-treated rats, suggesting the relationship between DCN T1w signal hyperintensity and Gd local accumulation. The mean Gd concentrations in the different regions of the brain were much higher than those measured after gadoterate meglumine administration, demonstrating a strong difference in Gd deposition according to the GBCA administered. This is consistent with previous studies, which have shown the presence of very low brain concentrations of Gd in rats treated with macrocyclic GBCAs, at a much lower level than linear GBCAs.12,13 In the control group, traces of total Gd concentrations were also measured, indicating a small cross contamination, a phenomenon commonly found.
Our results suggest that delayed T1w signal hyperintensity in rat DCN depends on the molecular structure of GBCA (macrocyclic vs linear), since this effect was observed only in animals treated with the linear GBCA gadodiamide. Additional studies including other GBCAs are warranted.
Administration of gadodiamide to patients has been recently associated with both dose-dependent deposits in neuronal tissues and T1w signal hyperintensity changes in the globus pallidus, thalamus, dentate nucleus, and pons.9 This effect was not associated with renal function, age, or time interval between gadodiamide exposure and death. Other recent clinical studies have demonstrated T1 signal hyperintensity of the dentate nucleus in patients with normal function after several administrations of the linear GBCA gadodiamide.3,7 The present rat study fully corroborates the clinical results. However, contrary to McDonald's study and because of model-based reasons, the total Gd concentrations were measured in total cerebellum and not in the DCN, where T1w signal hyperintensity was observed. The quantification of T1 (T1 mapping) may be a valuable approach to evaluating the local concentration of Gd in each brain area.
Another potential limitation of the present study is the selection of the reference region to calculate the signal intensity ratio. In clinical studies, the dentate nucleus-to-central pons ratio has mostly been used.3,5,7–9 In our conditions, the scan range of the MRI sequence can cover only the cerebellum. Therefore, it was not possible to use the pons as a comparator. The DCN signal intensity was compared with that of the cerebellar cortex. It is worth noting that the cerebellum has already been used as reference area in a clinical study.8 The results in the dentate nucleus-to-cerebellum ratio were comparable, even if the differences were greater for the dentate nucleus-to-pons ratio.8 Furthermore, several clinical studies have shown a progressive increase in the T1 signal intensity after multiple injections of linear GBCAs.3,5,7,9 A significant increase in the DCN-to-cerebellar cortex signal ratio (positive linear regression) was also observed in rats receiving multiple gadodiamide administrations. However, a curve plateau seemed to appear from the 16th administration. This trend may be related to a saturation phenomenon associated with the experimental model selected here. Another possibility for this plateau may be related to the selected reference region of interest (ie, the cerebellar cortex), which may not be fully appropriate in rats. Future studies with selection of other brain areas as comparator may allow solving this question. Moreover, whole-brain MRI (3D sequences) may be an interesting tool to investigate the appearance of T1w signal hyperintensity in other brain areas.
Magnetic resonance imaging was performed using a 2.35 T magnet. In most clinical studies, a 1.5 T imaging unit was used.3,5,7 However, MRI was performed on a 3 T imaging unit in other studies.6,8,9 The nuclear magnetic relaxation dispersion profile of the GBCA gadodiamide indicates a relaxivity (in water, 37°C) of 4.0 (mmol·L−1)·s−1 at 1.5 T and 3.7 (mmol·L−1)·s−1 at 2.35 T and 3 T (unpublished data). We can therefore assume that the relaxivity of this GBCA is equivalent at the 3 magnetic fields. However, studies performed at various magnetic fields may allow investigating the possibility of a potential magnetic field–related effect.
In the present study, 4 injections per week (at intervals of 24 hours) with a total of 20 administrations during 5 weeks were performed in animals. The excretion half-life of GBCAs in healthy rats (approximately 20 minutes14) is markedly shorter than in human (1.2–2 hours15), thus reducing tissue exposure and supporting the shorter administration time interval compared with clinical human studies.
One explanation for the presence of Gd deposits may be a gradual dissociation of accumulated GBCA in discrete brain areas such as the DCN. The propensity of GBCAs depends on their intrinsic thermodynamic/kinetic stabilities. It is well established that the kinetic stabilities of all the marketed macrocyclic GBCAs, including gadoterate meglumine, are higher than those of the linear chelates, including gadodiamide.16,17 Brain deposits of Gd have already been reported in a patient who developed nephrogenic systemic fibrosis after several administrations of gadodiamide.18 The analytical technique used to measure total Gd concentrations in the brain (inductively coupled plasma mass spectrometry) cannot distinguish between chelated and dissociated Gd owing to acidic conditions during mineralization. Demonstration of T1w signal hyperintensity indicates that soluble Gd is present in the DCN because precipitated Gd has little or no influence on the longitudinal relaxation times of protons.19 Relaxometry studies have demonstrated a gradual dissociation of gadodiamide in renally impaired rats, with release of soluble Gd.20 Dissociated soluble Gd may bind to proteins or other macromolecules, for example, after transmetallation with brain metals. Tissue Gd deposits have often been associated with the presence of calcium, phosphorus, and sometimes iron or zinc.21–23 Soluble Gd bound to macromolecules enhances relaxivity and therefore accentuates the T1 shortening. Protein-bound and insoluble Gd may both be present in areas with T1w signal hyperintensity. Future studies are needed to investigate in detail the behavior of GBCA molecules taken up in brain areas associated with T1 hypersignal.
Gadolinium-based contrast agent solutions are hyperosmolar. Their osmotic load is low24 and the physiological consequences are negligible at a clinical dose (unless the GBCAs are extravasated on injection). A hyperosmolar control (isoosmolar to gadoterate meglumine, the GBCA with the highest osmolality) was tested to evaluate whether hyperosmolality per se had any effect on MR signal. A slight but significant decrease in the DCN-to-cerebellum signal ratio was observed during the 10-week study period for gadoterate meglumine and hyperosmolar saline. As this effect was also observed in the control group, it cannot be ascribed to Gd deposition. Repeated administrations of a hyperosmolar solution may induce a small relative modification of cerebellum or DCN tissues, resulting in slight changes in MR signal. This effect may also be related to normal aging. This slight decrease of the DCN-to-cerebellum ratio may also have been present in the gadodiamide group, but masked by the paramagnetic effect of Gd accumulation. Further studies are needed to better understand this slight progressive decrease in T1w signal intensity. A future study may be conducted in rats receiving isoosmolar saline or in untreated rats.
No abnormal behavioral change suggestive of a putative neurological toxicity was observed during the study, regardless of the test compound. No histologic lesions were found in brain tissues of patients with T1w signal hyperintensity as well.9 In-depth studies are needed to investigate the putative clinical consequences of long-term Gd deposits in the cerebellum. T1w signal hyperintensity in the dentate nucleus has been previously described in patients with multiple sclerosis and has been correlated with the patient Expanded Disability Status Scale score.25 However, the authors of this study did not link the high signal intensity observed in 19.3% of the patients with the number of prior GBCA injections. As gadodiamide and gadoterate meglumine were used in this study, a retrospective analysis of such data would be of interest to investigate a potential link between the patient's clinical status and the number of gadodiamide injections. Errante et al reported T1 signal hyperintensity of the dentate nucleus in patients with multiple sclerosis and receiving at least 6 gadodiamide administrations.5 These changes may not be ascribed to the secondary progressive subtype of multiple sclerosis because this criterion was used to exclude patients from the analysis. Therefore, this study answers, at least partially, to the question of the link between the clinical status of patients with multiple sclerosis and the number of gadodiamide injections.
In summary, this study describes for the first time an animal model reproducing closely the recent clinical observations of cerebellum T1 signal hypersignal. It also introduces an animal model to investigate the mechanism of the brain retention observed after repeated administrations of some GBCA, opening new perspectives. Repeated administrations of linear gadodiamide to healthy rats were associated with progressive and persistent T1w signal hyperintensity in the DCN and with Gd deposit in cerebellum in contrast to the macrocyclic gadoterate meglumine for which no effect was observed. Brain total Gd concentrations measured 5 weeks after the last injection were higher in the gadodiamide-treated group than in the animals receiving gadoterate meglumine. Further studies are needed to determine whether the T1w brain signal enhancement is related to local dissociation of Gd metal from the chelate and to investigate the neurotoxicologic consequences of the presence of Gd in these brain structures.
ACKNOWLEDGMENTS
The authors are grateful to Robin Santus and Miguel Soares for their contribution in animal experiments. The authors also thank Gaëlle Jestin-Mayer and Cécile Factor for the gadolinium dosing in brain. The authors thank the Soladis team for their work in all statistical modeling of this study and to the Axtrid team for coding the postprocessing Software.
Footnotes
Part of these data have been accepted for oral presentation during the next American Society of NeuroRadiology meeting: ASNR 53rd Annual Meeting and The Foundation of the ASNR Symposium 2015, Chicago, April 25–30, 2015
REFERENCES
- 1. Kanal E, Maravilla K, Rowley HA. Gadolinium contrast agents for CNS imaging: current concepts and clinical evidence. AJNR Am J Neuroradiol. 2014; 35: 2215– 2226. [DOI] [PMC free article] [PubMed] [Google Scholar]
- 2. Grobner T. Gadolinium—a specific trigger for the development of nephrogenic fibrosing dermopathy and nephrogenic systemic fibrosis? Nephrol Dial Transplant. 2006; 21: 1104– 1108. [DOI] [PubMed] [Google Scholar]
- 3. Kanda T, Ishii K, Kawaguchi H, et al. High signal intensity in the dentate nucleus and globus pallidus on unenhanced T1-weighted MR images: relationship with increasing cumulative dose of a gadolinium-based contrast material. Radiology. 2014; 270: 834– 841. [DOI] [PubMed] [Google Scholar]
- 4. Adin ME, Yousem DM, Kleinberg L. Hyperintense dentate nuclei on T1 weighted MRI. Presented at the XXth Symposium Neuroradiologicum, Istanbul, Turkey, 2014. O152.
- 5. Errante Y, Cirimele V, Mallio CA, et al. Progressive increase of T1 signal intensity of the dentate nucleus on unenhanced magnetic resonance images is associated with cumulative doses of intravenously administered gadodiamide in patients with normal renal function, suggesting dechelation. Invest Radiol. 2014; 49: 685– 690. [DOI] [PubMed] [Google Scholar]
- 6. Kanda T, Osawa M, Oba H, et al. High signal intensity in dentate nucleus on unenhanced T1-weighted MR images: association with linear versus macrocyclic gadolinium chelate administration. Radiology. 2015; 275: 800– 809. [DOI] [PubMed] [Google Scholar]
- 7. Quattrocchi CC, Mallio CA, Errante Y, et al. Gadodiamide and dentate nucleus T1 hyperintensity in patients with meningioma evaluated by multiple follow-up contrast-enhanced magnetic resonance examinations with no systemic interval therapy. Invest Radiol. 2015; 50: 470– 472. [DOI] [PubMed] [Google Scholar]
- 8. Radbruch A, Weberling LD, Kieslich PJ, et al. Gadolinium retention in the dentate nucleus and globus pallidus is dependent on the class of contrast agent. Radiology. 2015; 275: 783– 791. [DOI] [PubMed] [Google Scholar]
- 9. McDonald RJ, McDonald JS, Kallmes DF, et al. Intracranial gadolinium deposition after contrast-enhanced MR imaging. Radiology. 2015; 275: 772– 782. [DOI] [PubMed] [Google Scholar]
- 10.CfDEaR UFaDA. Guidance for industry. Estimating the maximum safe starting dose in initial clinical trials for therapeutics in adult healthy volunteers. In: FDA, ed. 2005; http://www.fda.gov/downloads/Drugs/GuidanceComplianceRegulatoryInformation/Guidances/ucm078932.pdf Accessed April 27, 2015.
- 11. Paxinos G, Watson C. The Rat Brain in Stereotaxic Coordinates. Academic Press; 2006. [DOI] [PubMed] [Google Scholar]
- 12. Bussi S, Fouillet X, Morisetti A. Toxicological assessment of gadolinium release from contrast media. Exp Toxicol Pathol. 2007; 58: 323– 330. [DOI] [PubMed] [Google Scholar]
- 13. Wedeking P, Tweedle M. Comparison of the biodistribution of 153Gd-labeled (DTPA)2−, Gd(DOTA)−, and Gd(acetate)n in mice. Int J Radiat Appl Instrum B. 1988; 15: 395– 402. [DOI] [PubMed] [Google Scholar]
- 14. Oksendal AN, Hals PA. Biodistribution and toxicity of MR imaging contrast media. J Magn Reson Imaging. 1993; 3: 157– 165. [DOI] [PubMed] [Google Scholar]
- 15. Idée JM, Port M, Raynal I, et al. Clinical and biological consequences of transmetallation induced by contrast agents for magnetic resonance imaging: a review. Fundam Clin Pharmacol. 2006; 20: 563– 576. [DOI] [PubMed] [Google Scholar]
- 16. Frenzel T, Lengsfeld P, Schirmer H, et al. Stability of gadolinium-based magnetic resonance imaging contrast agents in human serum at 37 degrees C. Invest Radiol. 2008; 43: 817– 828. [DOI] [PubMed] [Google Scholar]
- 17. Idée JM, Port M, Dencausse A, et al. Involvement of gadolinium chelates in the mechanism of nephrogenic systemic fibrosis: an update. Radiol Clin North Am. 2009; 47: 855– 869. [DOI] [PubMed] [Google Scholar]
- 18. Sanyal S, Marckmann P, Scherer S, et al. Multiorgan gadolinium (Gd) deposition and fibrosis in a patient with nephrogenic systemic fibrosis—an autopsy-based review. Nephrol Dial Transplant. 2011; 26: 3616– 3626. [DOI] [PubMed] [Google Scholar]
- 19. Fretellier N, Idée JM, Dencausse A, et al. Comparative in vivo dissociation of gadolinium chelates in renally impaired rats: a relaxometry study. Invest Radiol. 2011; 46: 292– 300. [DOI] [PubMed] [Google Scholar]
- 20. Fretellier N, Bouzian N, Parmentier N, et al. Nephrogenic systemic fibrosis-like effects of magnetic resonance imaging contrast agents in rats with adenine-induced renal failure. Toxicol Sci. 2013; 131: 259– 270. [DOI] [PubMed] [Google Scholar]
- 21. Abraham JL, Thakral C, Skov L, et al. Dermal inorganic gadolinium concentrations: evidence for in vivo transmetallation and long-term persistence in nephrogenic systemic fibrosis. Br J Dermatol. 2008; 158: 273– 280. [DOI] [PubMed] [Google Scholar]
- 22. Schroeder JA, Weingart C, Coras B, et al. Ultrastructural evidence of dermal gadolinium deposits in a patient with nephrogenic systemic fibrosis and end-stage renal disease. Clin J Am Soc Nephrol. 2008; 3: 968– 975. [DOI] [PMC free article] [PubMed] [Google Scholar]
- 23. Thakral C, Abraham JL. Gadolinium-induced nephrogenic systemic fibrosis is associated with insoluble Gd deposits in tissues: in vivo transmetallation confirmed by microanalysis. J Cutan Pathol. 2009; 36: 1244– 1254. [DOI] [PubMed] [Google Scholar]
- 24. Port M, Idée JM, Medina C, et al. Efficiency, thermodynamic and kinetic stability of marketed gadolinium chelates and their possible clinical consequences: a critical review. Biometals. 2008; 21: 469– 490. [DOI] [PubMed] [Google Scholar]
- 25. Roccatagliata L, Vuolo L, Bonzano L, et al. Multiple sclerosis: hyperintense dentate nucleus on unenhanced T1-weighted MR images is associated with the secondary progressive subtype. Radiology. 2009; 251: 503– 510. [DOI] [PubMed] [Google Scholar]