Abstract
Purpose
The application of a biomechanical deformable image registration algorithm has been demonstrated to overcome the potential limitations in the use of intensity-based algorithms on low-contrast images that lack prominent features. Because validation of deformable registration is particularly challenging on such images, the dose distribution predicted via a biomechanical algorithm was evaluated using the measured dose from a deformable dosimeter.
Methods and materials
A biomechanical model–based image registration algorithm registered computed tomographic (CT) images of an elastic radiochromic dosimeter between its undeformed and deformed positions. The algorithm aligns the external boundaries of the dosimeter, created from CT contours, and the internal displacements are solved by modeling the physical material properties of the dosimeter. The dosimeter was planned and irradiated in its deformed position, and subsequently, the delivered dose was measured with optical CT in the undeformed position. The predicted dose distribution, created by applying the deformable registration displacement map to the planned distribution, was then compared with the measured optical CT distribution.
Results
Compared with the optical CT distribution, biomechanical image registration predicted the position and size of the deformed dose fields with mean errors of ≤ 1 mm (maximum, 3 mm). The accuracy did not differ between cross sections with a greater or lesser deformation magnitude despite the homogenous CT intensities throughout the dosimeter. The overall 3-dimensional voxel passing rate of the predicted distribution was γ3%/3mm = 91% compared with optical CT.
Conclusions
Biomechanical registration accurately predicted the deformed dose distribution measured in a deformable dosimeter, whereas previously, evaluations of a commercial intensity-based algorithm demonstrated substantial errors. The addition of biomechanical algorithms to the collection of adaptive radiation therapy tools would be valuable for dose accumulation, particularly in feature-poor images such as cone beam CT and organs such as the liver.
Introduction
Deformable image registration (DIR) algorithms have been used recently in clinical trials of adaptive radiation therapy to facilitate replanning.1 In applications for which the initial planning contours are propagated onto repeat imaging, qualitative DIR evaluation can be based on the need for manual contour adjustments. Retrospective studies using DIR-based dose accumulation, a more complex application, have demonstrated significant dose differences between planning and delivery.2 For adaptive radiation therapy to use accumulated doses during replanning, rigorous volumetric and dosimetric validation is required to understand the scale and complexity of DIR uncertainties that may be introduced into the treatment process.
Particular difficulty occurs with low-contrast images, for which point-based and geometric volume–overlap measures only provide limited information for DIR evaluation. To study DIR inconsistencies with various contrast levels, Kirby et al3 developed a 2-dimensional patient-derived virtual computed tomography (CT) pelvic phantom with an equivalent physical phantom. The registration errors from a commercial intensity-based DIR notably increased with deformation magnitude in low-contrast areas.4 It is unclear whether DIR accuracy evaluated on high-contrast, diagnostic-quality imaging is valid for other modalities, such as cone beam CT.
For dose accumulation, DIR evaluations should ideally relate to physical dose measurements. Deformable dosimeters have been investigated to track deformed dose distributions in 3 dimensions (3D) for this application. Using a radiochromic gel dosimeter, Yeo et al5 reported that 11 intensity-based DIR algorithms had widely varying accuracies, with a trend toward poorer performance for larger deformations. Juang et al6 demonstrated that a commercial intensity-based algorithm, previously validated on high-contrast images, performed poorly with the low-contrast images of an elastic polyurethane dosimeter.
All DIR algorithms attempt to account for physiological patient motion that occurs between images; however, most are not physical models of deformation. Biomechanical-based DIR has been investigated to model the forces acting on deforming tissues independent of the contrast in the images.7,8 Niu et al9 irradiated a deformable gel dosimeter under respiratory-like motion conditions. Biomechanical DIR of the 4-dimensional (4D) CT images modeled the contact and forces between the surfaces of the piston device and the gel, which enabled an accurate 4D dose distribution to be predicted compared with dose measured with magnetic resonance imaging (MRI). Further evaluations with wider and more complex dose distributions would provide a better understanding of the spatial distribution of biomechanical DIR errors. The requirement to directly model the forces that induce the deformations also requires further study, because this would not be routinely feasible on clinical imaging.
The primary purpose of this study was to evaluate the accuracy of biomechanical DIR using acquired imaging data from a novel 3D deformable dosimetry system from Duke University.6 Although previous evaluations of intensity-based DIR have resulted in lower accuracy than desired (γ3%/3mm = 60%),6 it was hypothesized that biomechanical DIR could accurately register CT images of this homogenous dosimeter. A secondary aim was to investigate the DIR parameter sensitivity to changes in the material properties and complexity of how the deformation is modeled.
Methods
Dosimeter data
A novel 3D deformable dosimeter developed by Juang et al6 is summarized here. It consists of an elastic 60 × 47.5 mm cylinder with a transparent polyurethane matrix doped with a light-absorbing radiochromic dye. The mechanical properties are similar to biological tissue with a Young's modulus (E) of 13.5 to 887 kPa and a Poisson ratio (v) of 0.475, which represent stiffness and compressibility, respectively. The dosimeter is water equivalent and exhibits a linear change in optical density with absorbed dose. After irradiation, the 3D dose distribution is reconstructed with a 1-mm isotropic resolution with use of an optical CT system.10
CT images of the dosimeter were acquired in its original cylindrical state, after a 16-mm (27%) lateral compression between 2 plates. A checkerboard radiation pattern composed of 29 5 × 5 mm2 fields was planned on the CT image in the compressed geometry (Eclipse, Varian Medical Systems, Palo Alto, California). The dose grid resolution was 1 × 1 × 1.25 mm3, and the maximum dose was 33.8 Gy. The dosimeter was then irradiated while remaining compressed. After the plates were removed, the dosimeter returned to its uncompressed geometry, and the actual delivered dose distribution, now deformed, was reconstructed with optical CT.9 The experimental setup and data for the current investigation are shown in Fig 1. The CT and optical CT images were acquired for a previous investigation6 and were used again for the present study.
Figure 1.
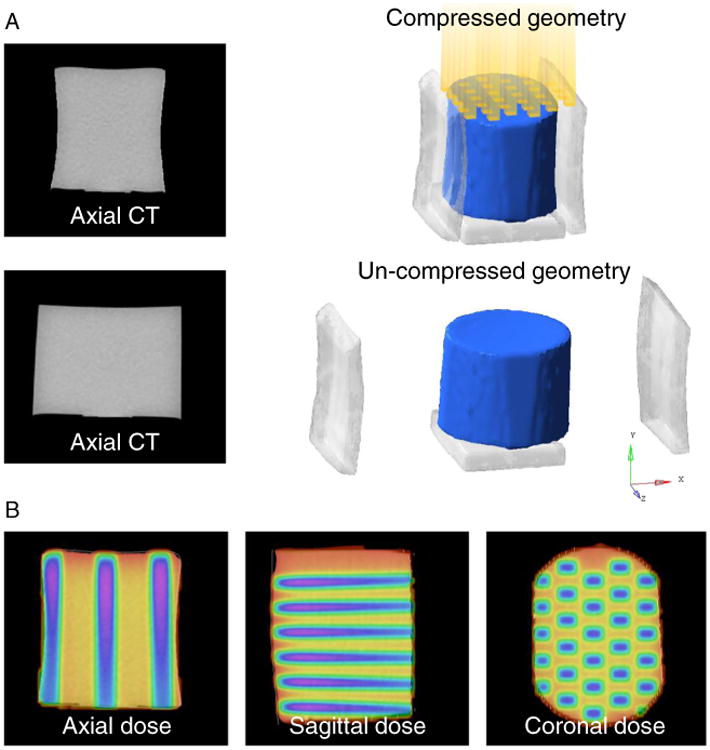
(A) Three-dimensional dosimeter models were generated with and without compression from corresponding computed tomography (CT) images (the plates were digitally removed). The yellow columns show the incident radiation beams. (B) The dose distribution was planned in the dosimeter's compressed geometry. (Color version available online at www.practicalradonc.org).
Biomechanical DIR
For the present investigation, the CT of the uncompressed dosimeter was deformed into the CT of the compressed dosimeter using Morfeus. This biomechanical model–based DIR algorithm has an accuracy of ∼2 mm.7 A volumetric model, consisting of 7.8 × 10⁴ tetrahedral elements, was generated from the contoured uncompressed dosimeter. Each element was composed of 4 connected nodes and had an average volume of 2 mm3. Correspondence between images was established with automated guided-surface projections between surfaces of contoured structures (eg, organs). This described displacements of the surface nodes and served as boundary conditions (ie, constraints) for the DIR. Finite element analysis used the boundary conditions and the linear elastic material properties assigned to the elements that constitute the dosimeter to solve the displacements at the nodes of the internal elements. Because this DIR does not directly rely on the intensity of the voxels, its accuracy is independent of the image contrast and presence of anatomic features. Potential inaccuracies in the use of biomechanical DIR clinically are the uncertainties in the material properties modeled and the use of guided-surface projections for the boundary conditions. The later approximation is performed between clinical images to avoid the difficulty in modeling the forces that are acting directly on the organ, although they may not accurately reflect the true tissue biomechanics at the surfaces. Using the DIR model described above, hereafter called DIR-SurfProj, surface projections were applied between the uncompressed and compressed dosimeter contours. This technique has been used to describe deformation in the head and neck, lung, liver, female pelvic anatomy, prostate, and rectum.7,8,11-13 Registration was also repeated with various material properties, and the internal node-by-node dosimeter displacements between registrations were compared.
Because of the relatively simple experimental setup (Fig 1B), it was also possible to directly model the physical interactions of the plate with the dosimeter for the boundary conditions, instead of the guided-surface projections. A modified DIR model, hereafter called DIRPlates, was constructed that consisted of the uncompressed dosimeter atop a baseplate between 2 rigid side plates. The side plates were then moved inward into their final position on the compressed CT, which deformed the dosimeter according to the modeled forces exerted by the plates and the assigned material properties. Contact surfaces at the dosimeter-plate interfaces allowed small sliding.8
To investigate whether the results from using the simpler guided-surface projections were affected by the magnitude of deformation, DIRSurfProj was compared to 3 known deformations generated by DIRPlates. These included modeling the original dosimeter compressed by the full amount with the plates (equal to the actual physical compression used in the experiment), then by two-thirds of the full compression, and finally by one-third of the full compression. DIRSurfProj was then performed using the original surface of the uncompressed dosimeter and each deformed surface generated by DIRPlates (full, two-thirds, or one-third compression). The node-by-node displacements throughout the entire dosimeter between DIRSurfProj and DIRPlates were compared directly for each compression level. These comparisons only indicated a relative difference between the 2 variations in DIR. Only the full compression can be validated quantitatively.
Geometric and dosimetric evaluation
The deformed CT images were first compared to the actual CT, both in the compressed geometry. The DIR-predicted and actual dosimeter contours were compared by use of distance-to-agreement (DTA), and the volume of overlap was quantified with the Dice similarity coefficient (DSC):
| (1) |
DIR-predicted deformed dose distributions in the uncompressed geometry of the dosimeter were created by applying the deformation map to the dose grid calculated on the CT in the compressed geometry. The DIR-predicted distributions were rigidly registered to the measured distribution of optical density changes (a surrogate for dose) on optical CT, and all volumes were cropped to exclude a 4-mm outer ring to avoid the edge artifacts inherent with optical CT.14,15 The optical CT data were converted to dose as reported previously and normalized to the global mean dose of each DIR-predicted distribution before comparison.6
Relative dose differences were evaluated by autosegmenting each field at cross sections that corresponded to depths of 12, 23 (depth at maximum compression), and 34 mm relative to the incident radiation beams (Fig 2). The centroid positions, length, and width of the deformed fields were compared between the DIR-predicted and optical CT distributions. Absolute dose differences were evaluated by use of voxel-by-voxel dose differences and the gamma (γ) index. The γ3%/3mm compares each voxel between the DIR-predicted and optical CT distributions, and the overall 3D passing rate was determined by use of the common 3% dose difference and 3-mm DTA criteria (Computational Environment for Radiotherapy Research, Washington University, St Louis, Missouri).16 Without DIR, the original planning dose grid (compressed geometry) was rigidly registered to the optical CT distribution (uncompressed geometry), which resulted in a γ3%/3mm = 58%. The accuracy of the 3D dosimetry system was established previously with a nondeformed control dosimeter as γ3%/3mm = 96%.6
Figure 2.
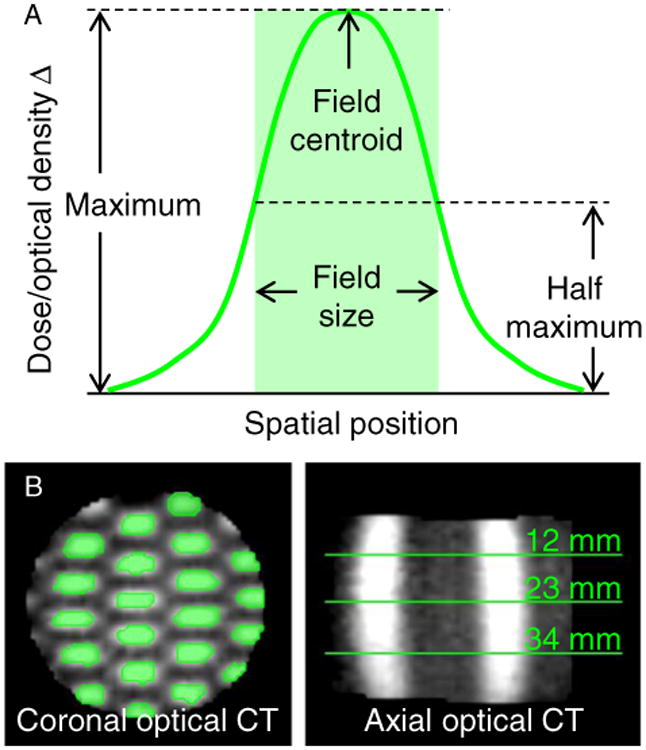
(A) Each deformed field was autosegmented at half of its maximum intensity value, and the field's length and width were measured. (B) The segmented fields (green regions in the coronal view) were analyzed at 3 cross-section depths from the incident beams (green lines in the axial view). CT, computed tomography. (Color version available online at www.practicalradonc.org).
Results
DIR parameter sensitivity
For either DIR model, varying the E assigned had no effect on the displacements of the nodes because the dosimeter was modeled as a homogenous material. Varying the v from 0.17 to 0.499 changed the average absolute 3D displacements of the nodes by 0.6 mm for DIRSurfProj, which indicates the model was insensitive to the exact v applied, and by 1.4 mm for DIRPlates. Hereafter, the results for DIRSurfProj are reported with E = 0.95 kPa and v = 0.480. For DIRPlates, v = 0.499 was used to maximize the agreement of the external contour of the dosimeter in the uncompressed geometry between the DIR prediction and CT.
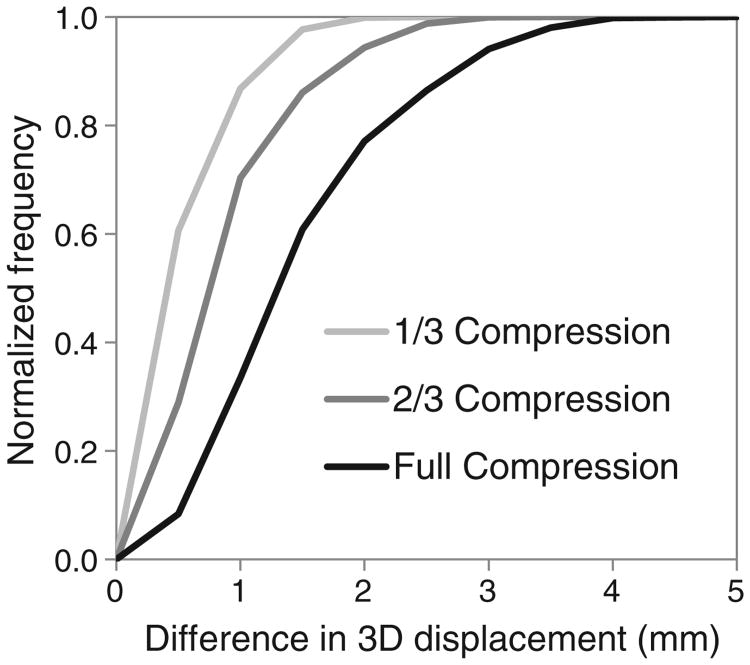
The displacements generated by DIRPlates and DIRSurfProj were compared at various magnitudes of dosimeter deformation (Fig 3). The node-by-node differences were 1.5 ± 0.8 mm (mean ± standard deviation) for the full 16 mm of compression used in the physical experiment, and <1 mm for simulated compressions of 11 or 5 mm in magnitude. There were no trends in displacement differences in the central versus outer nodes.
Figure 3.
Cumulative frequency distribution of the node-by-node displacement differences between 2 deformable image registration models, DIRSurfProj and DIRPlates. 3D, 3-dimensional.
Geometric accuracy
The external contour of the dosimeter between the DIR-predicted and the actual CT image were compared. The DSC was 0.994 for DIRSurfProj and 0.988 for DIRPlates (DSC = 1.0 indicates perfect overlap). The mean (maximum) residual surface DTA after DIR was 0.3 (1.9) mm for DIRSurfProj and 0.8 (2.7) mm for DIRPlates. High DSC and low DTA values indicate excellent registrations of the external boundary of the dosimeter. This was expected for DIRSurfProj because a surface alignment is prescribed by the technique. For DIRPlates, this indicates that modeling the forces exerted by the plates successfully generated an accurate deformed dosimeter position.
Dosimetric accuracy
Figure 4 demonstrates good visual agreement between the DIR-predicted dose distributions each compared with the distribution measured with optical CT. The overall errors in the deformed checkerboard field's centroid location, length, and width were ≤ 1 mm for each DIR model (Table 1). It was not possible to measure these errors for 8 of the 29 fields because of their partial beam incidence and the necessary optical CT cropping, which left 63 points (21 per cross section) for evaluation. Errors of similar magnitude were observed between the cross section that corresponded to the plane of maximum deformation/compression and the remaining cross sections. For DIRSurfProj, the maximum field centroid error was 2.4 mm, and errors ≥ 2 mm occurred in 4 of 63 of the measurements (6%; 1 of these 4 errors occurred in the same location as the largest error for DIRPlates). For DIRPlates, the maximum field centroid error was 1.7 mm, which occurred in 4 of 63 of the measurements (6%). The field size errors for DIRSurfProj ranged from 3 mm smaller to 3 mm larger, and for DIRPlates, they ranged from 2 mm smaller to 2 mm larger.
Figure 4.
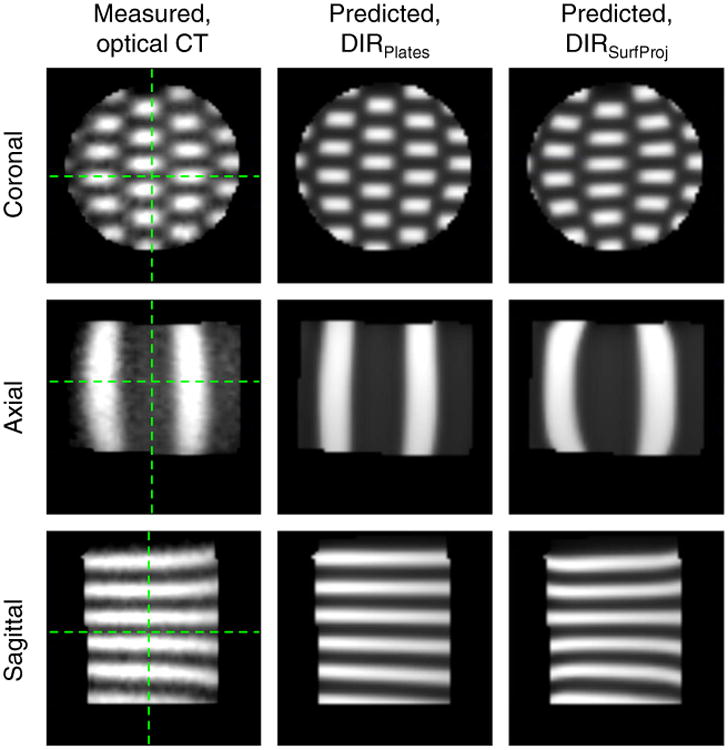
The deformed dose distributions in the dosimeter's uncompressed geometry measured with optical computed tomography (CT) or predicted by use of either deformable image registration model (DIRSurfProj or DIRPlates). Green lines indicate the orientations for corresponding planes. (See Methods for complete description of DIR models). (Color version available online at www.practicalradonc.org).
Table 1. Geometric errors in the deformed fields between DIR-predicted and optical CT distributions (predicted minus measured).
| Model | Δ Field centroid | Δ Field size | |
|---|---|---|---|
|
| |||
| Length | Width | ||
| DIRSurfProj | 1.0 ± 0.5 (0.0-2.4) | 0.2 ±1.3 (−3 to 3) | −0.3 ± 0.7 (−2 to 1) |
| DIRPlates | 0.9 ± 0.5 (0.0-1.7) | 0.0 ± 0.7 (−2 to 2) | −0.4 ± 0.7 (−2 to 1) |
Values are mean ± standard deviation (range), in millimeters, combined over all cross sections.
DIR, deformable image registration; DIRSurfProj and DIRPlates, (see Methods for complete description of models).
Figure 5 demonstrates good overall agreement in the dose profiles among the 3 distributions. The largest voxel-by-voxel dose differences between the DIR-predicted and optical CT distributions occurred throughout the whole dosimeter along the field edges where the dose gradients were steepest. The voxel-by-voxel dose differences (predicted minus measured) were a mean ± SD of 0.1 ± 4.2 Gy (0 ± 12%) for DIRSurfProj and 0.2 ± 4.7 Gy (0 ± 14%) for DIRPlates (where the percentage is a function of the maximum planned dose of 33.8 Gy). The γ3%/3mm passing rate over the entire volume was 91% for DIRSurfProj and 90% for DIRPlates.
Figure 5.
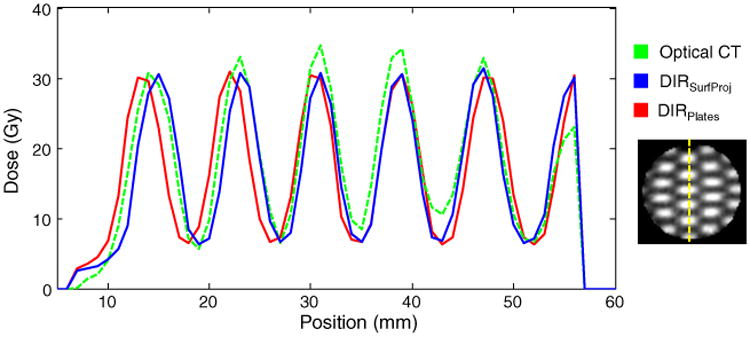
Dose profiles are shown in the cross section of maximum deformation/compression (depth = 23 mm) along the vertical line in the distribution shown on the right. CT, computed tomography; DIRSurfProj and DIRPlates, (see Methods for complete description of models). (Color version available online at www.practicalradonc.org).
Discussion
Progress on validation of biomechanical DIR was achieved by use of data from a deformable dosimeter and high-resolution optical CT system, complementing a previous study that used MRI-based deformable gel dosimeters.9 DIR validation with clinical data has been challenging because of reliance on the identification of anatomic or other imaging features that are often sparse or nonexistent on images of homogenous structures. By measuring the deformed 3D dose distribution, direct dosimetric evaluation was possible over all voxels in the current study. Compared with the measured dose distribution, biomechanical DIR predicted the deformed dose fields with a mean error of ≤1 mm, and more than 90% of all the voxels passed standard acceptance criteria. Compared with previous evaluations of this phantom with commercial intensity-based DIR, high dosimetric accuracy was achieved throughout the homogenous dosimeter, which makes biomechanical DIR a promising tool for dose accumulation and adaptive radiation therapy.
Two biomechanical DIR models were evaluated with either simple or more complex boundary conditions. Both had mean errors compared with the ground truth optical CT data of ≤1 mm when the dosimeter was physically compressed by 16 mm (27%). For registration of organs such as the liver, which rarely deform as extremely,17 DIRSurfProj therefore appears suitable for clinical application, in which it is often impractical to directly model the forces acting on an organ's surface. The simpler DIR-SurfProj model was also insensitive to variations within a range of plausible material properties; however, sliding interfaces (eg, as in DIRPlates) have demonstrated utility in the thorax for accurate registration of both the lung parenchyma and adjacent chest wall.8
Both techniques predicted the measured dose distribution well overall. The shifts in both DIR-predicted dose profiles of 1 to 2 mm shown in Fig 5 (corresponding to voxels 10–30) are likely a result of DIR errors. Another mismatch occurred at the dosimeter edge (corresponding to voxel 56 in Fig 5), where the optical CT peak dose was 27% lower than predicted by DIR. This likely resulted from optical CT edge artifacts or a field that was only partially incident on the dosimeter (ie, indicating a small translational setup error during irradiation). Overall, both DIR models predicted the measured 3D dose distribution with a γ3%/3mm of at least 90%, which indicates good agreement for this challenging scenario. The physical experiment was an end-to-end test. Additional geometric uncertainties of 1 to 2 mm can be expected from the linear accelerator and repositioning the dosimeter without image localization. Multileaf collimator positioning errors of 1 mm can result in field size differences of 30% to 40% for small fields.18 Dosimetric errors from the treatment planning system can be up to 12% for the small field sizes of 5 × 5 mm2 used.19,20
A previous report demonstrated mean dose differences of 3 ± 14% between a biomechanical DIR-predicted distribution and the 4D dose accumulated with a gel dosimeter.16 The mean dose differences of 0.1 ± 4.2 Gy (0 ± 12%) in the current study may result from the complicated checkerboard field pattern, in which any potential registration errors would be amplified by the steep dose gradients at the field edges. The 3D voxel passing rate (γ3%/3mm = 91%) is comparable to the study by Niu et al (γ4.7%/3mm = 97%), which used more relaxed acceptance criteria to reflect the higher level of uncertainty in measurement accuracy of the gel-MRI dosimetry system.9 These 2 studies demonstrate that biomechanical DIR is potentially well suited for interfraction dose accumulation when low-contrast images or organs require registration. For example, liver tumors are often indistinguishable from normal liver tissue when intravenous contrast is not used routinely (eg, during the cone beam CT guidance used in stereotactic radiation therapy).
Juang et al6 evaluated a commercially available intensity-based DIR algorithm based on a B-spline model and mutual information using the same imaging data as the present study. The external dosimeter (ie, the high-contrast region) was registered with submillimeter accuracy. Compared with the optical CT dose distribution, however, the mean (maximum) error of the centroid of the internal deformed dose fields was 4.2 (9.0) mm, the field size errors ranged from −6 to 14 mm, and the γ3%/3mm was only 60%.6 In the current evaluation, even simple rigid registration resulted in a γ3%/3mm of 58%; however, both results were substantially worse than either biomechanical DIR model. The same intensity-based algorithm was reported to have a geometric accuracy of 1 to 3 mm with patient-derived CT quite unlike the CT of the deformable dosimeter.3,21 Interpreted together, these results should serve as a strong caution when one extrapolates the accuracy of intensity-based DIRs validated on feature-rich imaging to images or regions that lack prominent features. Unlike intensity-based DIR, the accuracy of biomechanical DIR is largely independent of the image intensities.
Currently, there is no consensus on the DIR accuracy required for clinical implementation of dose accumulation or the method of evaluation. Deformable dosimeters have demonstrated their potential to precisely track 3D distributions, including accumulation over multiple time points.6,9,22 Anthropomorphic phantoms should allow for evaluation in more clinically plausible scenarios, although further research is required to model organs for which density and mass are not conserved (eg, lungs and stomach).
Conclusions
Biomechanical-based DIR was used to reconstruct the delivered dose distribution via registration between CT images of a homogenous, deformable dosimeter. Compared with the measured dose distribution, the mean errors in the predicted dose field locations and sizes were ≤ 1 mm, and this did not differ between 2 DIR models that used different boundary conditions. This validation supports the addition of biomechanical-based DIR algorithms to the collection of tools being used clinically for deformable dose accumulation and adaptive radiation therapy, particularly in feature-poor images or anatomic sites.
Acknowledgments
Sources of support: This research was supported by a Canadian Institutes for Health Research Fellowship and the US National Institutes of Health (5RO1CA124714-02).
Footnotes
Presented at the 56th Annual Meeting of the American Society for Radiation Oncology, San Francisco, California, September 14-17, 2014.
Conflicts of interest: K.K. Brock and J.L. Moseley have a financial interest in the technology reported in this manuscript through a licensing agreement with RaySearch Laboratories. All other authors have reported that they have no relationships relevant to the contents of this paper to disclose.
References
- 1.Schwartz DL, Garden AS, Thomas J, et al. Adaptive radiotherapy for head-and-neck cancer: Initial clinical outcomes from a prospective trial. Int J Radiat Oncol Biol Phys. 2012;83:986–993. doi: 10.1016/j.ijrobp.2011.08.017. [DOI] [PMC free article] [PubMed] [Google Scholar]
- 2.Velec M, Moseley JL, Craig T, Dawson LA, Brock KK. Accumulated dose in liver stereotactic body radiotherapy: Positioning, breathing, and deformation effects. Int J Radiat Oncol Biol Phys. 2012;83:1132–1140. doi: 10.1016/j.ijrobp.2011.09.045. [DOI] [PMC free article] [PubMed] [Google Scholar]
- 3.Kirby N, Chuang C, Ueda U, Pouliot J. The need for application-based adaptation of deformable image registration. Med Phys. 2013;40:011702. doi: 10.1118/1.4769114. [DOI] [PubMed] [Google Scholar]
- 4.Nie K, Chuang C, Kirby N, Braunstein S, Pouliot J. Site-specific deformable imaging registration algorithm selection using patient-based simulated deformations. Med Phys. 2013;40:041911. doi: 10.1118/1.4793723. [DOI] [PubMed] [Google Scholar]
- 5.Yeo UJ, Taylor ML, Supple JR, et al. Is it sensible to “deform” dose? 3D experimental validation of dose-warping. Med Phys. 2012;39:5065–5072. doi: 10.1118/1.4736534. [DOI] [PubMed] [Google Scholar]
- 6.Juang T, Das S, Adamovics J, Benning R, Oldham M. On the need for comprehensive validation of deformable image registration, investigated with a novel 3-dimensional deformable dosimeter. Int J Radiat Oncol Biol Phys. 2013;87:414–421. doi: 10.1016/j.ijrobp.2013.05.045. [DOI] [PMC free article] [PubMed] [Google Scholar]
- 7.Brock KK, Sharpe MB, Dawson LA, Kim SM, Jaffray DA. Accuracy of finite element model-based multi-organ deformable image registration. Med Phys. 2005;32:1647–1659. doi: 10.1118/1.1915012. [DOI] [PubMed] [Google Scholar]
- 8.Al-Mayah A, Moseley J, Brock KK. Contact surface and material nonlinearity modeling of human lungs. Phys Med Biol. 2008;53:305–317. doi: 10.1088/0031-9155/53/1/022. [DOI] [PubMed] [Google Scholar]
- 9.Niu CJ, Foltz WD, Velec M, Moseley JL, Al-Mayah A, Brock KK. A novel technique to enable experimental validation of deformable dose accumulation. Med Phys. 2012;39:765–776. doi: 10.1118/1.3676185. [DOI] [PMC free article] [PubMed] [Google Scholar]
- 10.Thomas A, Newton J, Adamovics J, Oldham M. Commissioning and benchmarking a 3D dosimetry system for clinical use. Med Phys. 2011;38:4846–4857. doi: 10.1118/1.3611042. [DOI] [PMC free article] [PubMed] [Google Scholar]
- 11.Al-Mayah A, Moseley J, Hunter S, et al. Biomechanical-based image registration for head and neck radiation treatment. Phys Med Biol. 2010;55:6491–6500. doi: 10.1088/0031-9155/55/21/010. [DOI] [PubMed] [Google Scholar]
- 12.Brock KK, Nichol AM, Menard C, et al. Accuracy and sensitivity of finite element model-based deformable registration of the prostate. Med Phys. 2008;35:4019–4025. doi: 10.1118/1.2965263. [DOI] [PubMed] [Google Scholar]
- 13.Lim K, Kelly V, Stewart J, et al. Pelvic radiotherapy for cancer of the cervix: Is what you plan actually what you deliver? Int J Radiat Oncol Biol Phys. 2009;74:304–312. doi: 10.1016/j.ijrobp.2008.12.043. [DOI] [PubMed] [Google Scholar]
- 14.Sakhalkar HS, Adamovics J, Ibbott G, Oldham M. A comprehensive evaluation of the PRESAGE/optical-CT 3D dosimetry system. Med Phys. 2009;36:71–82. doi: 10.1118/1.3005609. [DOI] [PMC free article] [PubMed] [Google Scholar]
- 15.Oldham M, Thomas A, O'Daniel J, et al. A quality assurance method that utilizes 3D dosimetry and facilitates clinical interpretation. Int J Radiat Oncol Biol Phys. 2012;84:540–546. doi: 10.1016/j.ijrobp.2011.12.015. [DOI] [PMC free article] [PubMed] [Google Scholar]
- 16.Low DA, Dempsey JF. Evaluation of the gamma dose distribution comparison method. Med Phys. 2003;30:2455–2464. doi: 10.1118/1.1598711. [DOI] [PubMed] [Google Scholar]
- 17.Eccles CL, Dawson LA, Moseley JL, Brock KK. Interfraction liver shape variability and impact on GTV position during liver stereotactic radiotherapy using abdominal compression. Int J Radiat Oncol Biol Phys. 2011;80:938–946. doi: 10.1016/j.ijrobp.2010.08.003. [DOI] [PMC free article] [PubMed] [Google Scholar]
- 18.Fogliata A, Nicolini G, Clivio A, Vanetti E, Cozzi L. Accuracy of AcurosXB and AAA dose calculation for small fields with reference to RapidArc(®) stereotactic treatments. Med Phys. 2011;38:6228–6237. doi: 10.1118/1.3654739. [DOI] [PubMed] [Google Scholar]
- 19.Das IJ, Ding GX, Ahnesjo A. Small fields: Nonequilibrium radiation dosimetry. Med Phys. 2008;35:206–215. doi: 10.1118/1.2815356. [DOI] [PubMed] [Google Scholar]
- 20.Gagne IM, Ansbacher W, Zavgorodni S, Popescu C, Beckham WA. A Monte Carlo evaluation of RapidArc dose calculations for oropharynx radiotherapy. Phys Med Biol. 2008;53:7167–7185. doi: 10.1088/0031-9155/53/24/011. [DOI] [PubMed] [Google Scholar]
- 21.Stanley N, Glide-Hurst C, Kim J, et al. Using patient-specific phantoms to evaluate deformable image registration algorithms for adaptive radiation therapy. J Appl Clin Med Phys. 2013;14:4363. doi: 10.1120/jacmp.v14i6.4363. [DOI] [PMC free article] [PubMed] [Google Scholar]
- 22.Yeo UJ, Taylor ML, Dunn L, Kron T, Smith RL, Franich RD. A novel methodology for 3D deformable dosimetry. Med Phys. 2012;39:2203–2213. doi: 10.1118/1.3694107. [DOI] [PubMed] [Google Scholar]


