

Abstract
During our recent studies on mechanism of the regulation of human DNA polymerase δ in preparation for DNA replication or repair, multiparameter imaging cytometry as exemplified by laser scanning cytometry (LSC) has been used to assess changes in expression of the following nuclear proteins associated with initiation of DNA replication: cyclin A, PCNA, Ki-67, p21WAF1, DNA replication factor Cdt1 and the smallest subunit of DNA polymerase δ, p12. In the present review, rather than focusing on Pol δ, we emphasize the application of LSC in these studies and outline possibilities offered by the concurrent differential analysis of DNA replication in conjunction with expression of the nuclear proteins. A more extensive analysis of the data on a correlation between rates of EdU incorporation, likely reporting DNA replication, and expression of these proteins, is presently provided. New data, specifically on the expression of cyclin D1 and cyclin E with respect to EdU incorporation as well as on a relationship between expression of cyclin A vs. p21WAF1 and Ki-67 vs. Cdt1, are also reported. Of particular interest is the observation that this approach makes it possible to assess the temporal sequence of degradation of cyclin D1, p21WAF1, Cdt1 and p12, each with respect to initiation of DNA replication and with respect to each other. Also the sequence or reappearance of these proteins in G2 after termination of DNA replication is assessed. The reviewed data provide a more comprehensive presentation of potential markers, whose presence or absence marks the DNA replicating cells. Discussed is also usefulness of these markers as indicators of proliferative activity in cancer tissues that may bear information on tumor progression and have a prognostic value.
Keywords: cell cycle, S-phase, cell proliferation, laser scanning cytometry, DNA replication, EdU labeling, polymerase δ
INTRODUCTION
Multiparameter cytometry combined with gating analysis offers the means to correlate expression of different cellular entities and events with each other in individual cells. Numerous attempts have been made to use this methodology to assess a relationship between DNA replication and expression of particular nuclear proteins in order to explore their role in this critical event of the cell cycle. During the past four decades the most widely used cytometric methodology to detect DNA replication was based on immunocytochemical detection of 5-bromo-2-deoxyuridine (BrdU) [1]. However, because this methodology requires denaturation of DNA either by heat or strong acid to make the incorporated BrdU accessible to BrdU-Ab, it was incompatible with a concurrent immunocytochemical detection of nuclear proteins whose epitopes were damaged under these harsh conditions. The subsequent approaches to detect DNA replication that were compatible with simultaneous detection of protein, such as partial digestion of DNA with restriction nucleases or endonuclease [2], or DNA strand break induction by photolysis (SBIP) [3] had other limitations that prevented their widespread use. The recently introduced methodology of labeling DNA with 5-ethynyl-2′-deoxyuridine (EdU) which is detected with fluorochrome-tagged azides by a copper (I) catalyzed [3+2] cycloaddition reaction, defined as “click chemistry”, has no such limitations. EdU therefore has become now the preferred DNA precursor applicable in flow and imaging cytometry [4-7]. It should be noted however, that the application of EdU in experiments that require long-term incubation following the labeling has constrains because the incorporated EdU causes perturbation of the cell cycle progression, DNA damage and cytotoxicity [8-10].
In our prior studies we correlated DNA replication as detected by EdU incorporation with the expression of γH2AX and ATM in response to DNA damage induced by oxidative stress [11, 12], DNA topoisomerase I inhibitors camptothecin or topotecan, topoisomerase II inhibitors mitoxantrone or etoposide [13] as well as UV irradiation [14]. Of particular interest were our findings that genotoxic agents camptothecin, topotecan and UV irradiation induced DNA damage selectively in DNA replicating cells, and upon examination by confocal microscopy, at the sites of DNA replication foci. In contrast, in the cells subjected to oxidative stress or treated with DNA topoisomerase II inhibitors, the DNA damage response was induced in the cells regardless of their DNA replication status, and in the case of DNA replicating cells also outside of DNA replication foci [11-14]. We have also reported that assessment of the frequency of cells initiating and terminating DNA replication during the pulse exposure to EdU offers information on the kinetics of initiation and termination of DNA replication at the onset and end of the S phase, respectively [15]. Recent studies by Furia et al., [16-19] utilizing a novel imaging computational platform named Automated Microscopy for Image Cytometry (AMICO) provided an excellent example of analysis of a correlation of DNA replication as revealed by EdU incorporation and expression of proteins such as cyclin A, cyclin E, Ki-67, p53, and 53BP, the latter detected either integrated over the nucleus or located within the 53BP nuclear foci. Using mammary epithelial cells these authors were able to critically evaluate the correlation between different stages of DNA replication (early-S, mid-S, late-S) and expression of these proteins [16-19].
In recent studies we applied similar approaches to assess the expression of several nuclear proteins associated with initiation and termination of DNA replication that made it possible to reveal the changeable kinetics of their expression at the early and late sections of the S phase [20]. The report was focused on mechanisms associated with a role of the detected proteins with DNA replication, particularly in relation to a function of DNA polymerase δ (Pol δ). The multiparameter imaging - laser scanning cytometry (LSC) [21] served in these experiments as a tool to explore these mechanisms. In the present review rather than focus on control of Pol δ by p12 degradation we emphasize the application of imaging cytometry and outline possibilities offered by the concurrent differential analysis of DNA replication in conjunction with expression of the nuclear proteins. Also a more extensive analysis of the data reporting a correlation (or lack thereof) between the rate of DNA replication (EdU incorporation) and expression of these proteins, is presently provided. Our findings can be compared with the mentioned data of Furia at al., [15-19] who, as mentioned, used a somewhat different methodological approach to assess the association between DNA replication and expression of some of these proteins.
Using the prior described methodology [11-15, 20] we also report new data, specifically these related to expression of cyclin D1 and cyclin E with respect to EdU incorporation. Moreover, we demonstrate the differential staining of the DNA replication-associated proteins (cyclin A, Ki-67) concurrently with the proteins that are degraded prior to initiation of DNA replication (p21, Cdt1), in the same individual cells. The reviewed data further underscore the analytical capability of multiparameter cytometry in exploring factors associated with initiation or termination of DNA replication and provide a more comprehensive presentation of potential markers, whose presence or absence marks the DNA replicating cells. Discussed is also usefulness of these markers as indicators of proliferative activity in cancer tissues that may bear information on tumor progression and have a prognostic value in pathology.
NEGATIVE MARKERS OF DNA REPLICATION: CYCLIN D1, THE CDK INHIBITOR P21WAF1, THE DNA REPLICATION LICENSING FACTOR Cdt1 AND p12, THE SMALLEST SUBUNIT OF DNA POLYMERASE Δ
Cyclin D1
Cyclins are the key constituents of the cell cycle progression machinery. Combined with their respective cyclin-dependent serine/threonine protein kinases (CDKs) they form the holoenzymes that phosphorylate different sets of target proteins thereby driving the cell through consecutive phases of the cycle. Their kinase activity is additionally modulated by Cdk inhibitors (CKIs), and close cooperation between cyclins, CDKs and CKIs is necessary for ensuring the ordered progression through the cell cycle [reviewed in 22-27]. It should be noted, however, that in addition to their well-characterized function in cell cycle control, mammalian cyclins, CDKs and CKIs are also involved in processes such as transcription, epigenetic regulation, metabolism, stem cell self-renewal, neuronal functions and spermatogenesis [22].
The cellular abundance of cyclin D1, as of other cyclins, is regulated by their synthesis and degradation. The synthesis of cyclin D1 is induced by growth factors that stimulate the MAPK/ERK (Ras-Raf-MEK-ERK) pathways [23]. The MAPK member of these pathways activates a transcription factor Myc which then activates the critical positive cell cycle regulators that include Cdks, cyclins and E2F transcription factors [24, 25]. Degradation of cyclins takes place through an anaphase-promoting complex/cyclosome (APC/C) dependent pathway [26, 27]. The APC/C is an E3 ubiquitin ligase that targets specific substrates for degradation by the 26S proteasome [27]. Cyclin D1 interacts with Cdk2, Cdk4 and Cdk6. The cyclin D-Cdk4/6 complex partially phosphorylates retinoblastoma tumor suppressor protein (pRb) which is the key event facilitating cell progression through G1, up to the entrance to S phase. Specifically, partial phosphorylation of pRb by the cyclin D-Cdk4/6 kinase releases E2F factors that activate transcription of several genes, including that of cyclin E, that being subsequent to cyclin D1, promotes the entrance to S [28, 29].
Figure 1 (A) illustrates the relationship between EdU incorporation and expression of cyclin D1. The cell cycle specific expression of cyclin D1, as shown in this figure (mid-panel) is consistent with that as initially defined by flow cytometry [30, 31]. The data show that a majority of cells (identified by their DNA content as in the S-phase and incorporating EdU) essentially were cyclin D1 negative. Among the cyclin D1 negative cells with DNA content equivalent of G1 75% cells did not initiate DNA replication during exposure to the precursor. Thus, the remaining 25% of the cyclin D1 negative/EdU positive cells with a G1 DNA content, were entering S phase during this time (eS). However, they still are identifiable, based on intensity of DAPI fluorescence (DNA content), as in G1 because their DNA content during that period increased so minimally that they cannot be distinguished from the genuine G1 cells. The presence of a predominant proportion of cyclin D1 negative cells not yet incorporating EdU indicates that near complete degradation of this protein had to occur quite ahead to initiation of EdU incorporation during the transition from G1 to S.
Figure 1. Expression of cyclin D1 (A), the CDK inhibitor p21 (B), the chromatin licensing and DNA replication factor Cdt1 (C), and the smallest subunit of DNA polymerase δ p12 (D), in relation to EdU incorporation.
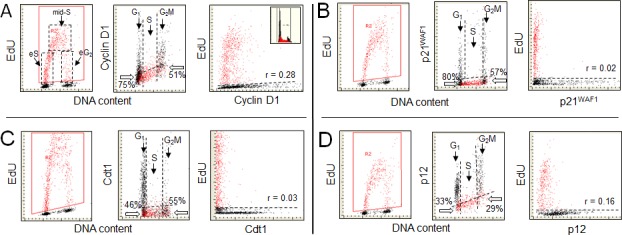
A549 cells were exposed to EdU for 60 min, the EdU incorporation was detected by the Click-ItTM protocol, cellular expression of cyclin D1, p21, Cdt1 and p12 was detected immunocytochemically, DNA was counterstained with DAPI and cellular fluorescence was measured by LSC, as described [11-15,20]. During the “paint-a-gate” analysis the cells incorporating EdU were colored red. The dashed contours in A (left panel) outline the cells that during duration of the 60 min exposure to EdU were entering S (eS), were constantly present during pulse duration (mid-S), or were entering G2 (eG2) [15]. The EdU incorporation is correlated on the bivariate scatterplots with expression of these proteins presented as integrated values of immunofluorescence intensity over cell nucleus (mid-panels). The dashed skewed lines in mid-panels show the upper level of fluorescence intensity of the cells stained with the secondary fluorochrome-tagged Ab only, namely +3SD of the mean fluorescence intensity of such negative control [20]. The cells below this line are thus considered negative with respect to expression of these proteins. Below the thick arrows in mid-panels presented is the percentage of cells at the G1 to S transition (with DNA content equivalent of G1) and at the S to G2 transition (G2M DNA content) that are negative with respect to expression of the measured proteins and did not incorporate EdU. A direct relationship between expression of these proteins and EdU incorporation is presented in the right panels in which the dashed line separates the EdU labeled from unlabeled cells. The regression analysis reveals the degree of correlation (Pearson; r = x) between incorporation of EdU and expression of each of these proteins in all EdU positive cells, assessed as described before [20].
At the S to G2 transition the cohort of cells exposed to the precursor during duration of the EdU pulse entered G2 and were identified as the EdU-positive G2M cells. Because there were 51% cyclin D1 negative-EdU unlabeled cells, the synthesis and accumulation of cyclin D1 has to take place at a certain time following termination of DNA replication. However, the bivariate cyclin D1 vs EdU scatterplot (right panel) shows a relatively weak correlation (Pearson; r = 0.28) between incorporation of EdU and expression of cyclin D1. This correlation apparently stems from the fact that the EdU labeled cells entering G2 during the duration of the pulse initiate the synthesis of cyclin D1. Thus, it is likely that the re-expression of cyclin D1 in G2, although it starts after termination of EdU incorporation, has an onset of synthesis in less than 60 min (duration of the EdU pulse) following the end of EdU incorporation (S to G2 transition). As described further in the review, the immunocytochemical detection of proteins suffers certain shortcomings that should be taken into an account when analyzing this type of data.
We have recently utilized the EdU-labeling method to analyze the degradation of three proteins, p21WAF1, Cdt1 and the p12 subunit of DNA polymerase δ (Pol δ) [20]. Here, we review these findings, as they relate to the correspondence of their degradation at the onset of DNA synthesis and their reappearance during G2/M. Also of note, we wish to illustrate the insights that can be gained by multi-parametric analysis offered by LSC in combination with the identification of replicating cells by EdU pulse-labeling. Moreover, the p21WAF1, Cdt1 and p12 are linked by a common mechanism for their degradation by CRL4Cdt2, which regulates the G1/S transition and the licensing of replication origins by the loading of the MCM proteins [32, 33].
p21WAF1
The protein p21WAF1 is a cyclin-dependent kinase inhibitor (CKI) which binds and inhibits the activity of cyclin-CDK2, -CDK1, and -CDK4/6 complexes, and thus functions as a checkpoint regulator of cell cycle progression at G1 and S phase [34-37]. The expression of this gene is induced by the tumor suppressor p53 in response to a variety of stimuli, particularly from DNA damage [36]. In addition to cell arrest in G1, the expression of this protein can mediate cellular senescence [38, 39]. However, p21WAF1 levels are also regulated by posttranslational means, via its degradation by E3 ubiquitin ligases, and has multiple cellular functions during the normal cell cycle, largely mediated by its high affinity for PCNA [32, 33]. Its degradation during G1/S, in concert with those of Cdt1 and the histone methylase Set8, play key roles in the prevention of re-replication [40, 41].
Figure 1B illustrates the relationship between EdU incorporation and p21 levels. Similar as in the case of cyclin D1, the absence of p21 characterizes the EdU incorporating cells, revealing that degradation of p21 occurs prior to initiation of DNA replication. The frequency of cells with a G1 DNA content that are both p21- and EdU- negative (80%) is similar to that of cyclin D1- and EdU- negative cells (A, 75%). The closeness of these numbers indicates that prior to initiation of DNA replication degradation of cyclin D1 as well as of p21 occurs at approximately the same time. Likewise, the percent of cells with a G2M DNA content that are both p21 and EdU- negative (57%) is similar to that of cyclin D1- and- EdU negative (A; 51%). Thus, following termination of DNA replication, the accumulation of p21 as well as of cyclin D1, occurs at approximately the same time. Among the EdU positive cells no correlation between expression of p21 and EdU incorporation is apparent (r = 0.02). Seen from another perspective, the cellular regulation of p21 is such that its levels are reduced prior to the onset of DNA replication.
DNA replication factor Cdt1
The Cdc10-dependent transcript 1 (Cdt1) is essential for formation of the pre-replicative complexes (preRC) and is a key licensing factor that binds to the origin recognition complex, and together with Cdc6 loads the MCM2-7 (minichromosome maintenance subunits 2-7), and licenses the complex for replication [32, 33, 42-44]. Its low level/absence during S phase is a consequence of its targeted destruction during the G1/S transition that is required to prevent re-replication. The master regulator of Cdt1 is CRL4Cdt2, which orchestrates the degradation of Cdt1, p21, Set8 (histonemethylase Set8) [32, 33] as well as p12 [45, 46], via their possession of a common peptide motif, the PIP-degron. The PIP-degrons as a group have higher affinities for PCNA than PIP-boxes [41], and thus Cdt1, in addition to its functions as a licensing factor, may also have inhibitory effects on PCNA binding processes, as reported recently for the translesion polymerases Pol η and Pol κ [48]. This property is similar to that attributed to p21WAF1 [32, 33].
The relationship between the expression of Cdt1 and DNA replication is shown in Figure 1C. As in the case of cyclin D1 (Figure 1A) and p21 (Figure 1B) the cells incorporating EdU appear to be devoid of Cdt1. Here, the analysis of the cells in the G1/S transition region shows that among the Cdt1-negative cells 46% of them were not incorporating EdU. Thus, the time-lapse between degradation of Cdt1 and initiation of EdU incorporation appears to be somewhat shorter compared to p21 or cyclin D1. As mentioned the licensing factor Cdt1 binds to the origin recognition complex, together with Cdc6 loads the MCM2-7, and licenses the DNA within the complex for replication. Its presence at the end of G1, just prior to initiation of DNA replication is required. The data shown in Figure 1C are consistent with the notion that initiation of DNA replication is concurrent with degradation of this protein to the level that cannot be immunocytochemically detected. Relatively fewer Cdt1-positive cells are present in G2M compared with the cyclin D1, p21-, or p12- positive cells (Figure 1D). This indicates that unlike in the case of cyclin D1-, p21 or p12 the accumulation of Cdt1, while is detected in some cells during G2M, in most cells takes place after the cell division, in G1 phase of the cell cycle.
p12, the smallest subunit of DNA polymerase δ
DNA polymerase δ (Pol δ) together with Pol ε are the primary polymerases responsible for DNA replication in eukaryotes. Human Pol δ consists of four subunits: p125, p68, p50 and p12 [49-51]. In response to DNA damage p12 undergoes degradation which results in conversion of Pol δ4 to Pol δ3, the trimer lacking p12 [45, 53, 54]. Thus far, two E3 ligases RNF8 and CRL4Cdt2 have been identified to participate in targeting p12 for degradation after DNA damage [46, 55]. While initially Pol δ3 was shown to be implicated in DNA repair, subsequent studies indicated that it is the main form of Pol δ that is involved in DNA replication as well [20, 45, 56, 57]. Consistent with this are the observations on cells synchronized in the cell cycle that Pol δ3 is being formed in S-phase cells [45]. We have recently reported that with no synchronization, under conditions of unperturbed growth, during progression through the cell cycle DNA replication occurs in the cells in which p12 levels have fallen to near-baseline levels, at least as judged within the sensitivity of the antibody used for its immunocytochemical detection [20, 45]. The functions of p12 are complex and some appear to be related to maintenance of genome integrity as demonstrated by the findings that depletion of p12 leads to genomic instability [58, 59].
Figure 1D illustrates the actual relationship between the expression of p12 and DNA replication. The bivariate distributions presenting the cells expressing p12 vis-à-vis EdU incorporation resemble those of cyclin D1 (Figure 1A) p21WAF1 (Figure 1B) and Cdt1 (Figure 1C). Specifically, they show absence of the respective proteins in the cells incorporating EdU. There are distinctly fewer cells with a G1 DNA content that are p12 negative and not incorporating EdU (33%) than of the cyclin D1- (75%) or p21- (80%) negative cells, respectively. This indicates that the initiation of DNA replication occurs earlier after the loss of p12 compared with the loss of p21 or cyclin D. In other words, the “time window” between the degradation of p12 and onset of DNA replication is shorter compared to that of the degradation of cyclin D or p21 and thus degradation of these proteins precedes that of p12 degradation. Also, fewer p12 negative cells with a G2M DNA content did not incorporate EdU (29%) than did the cyclin D1 (51%)- or p21 (57%)- negative cells. These data in turn indicate that following termination of DNA replication the accumulation of p12 is detected prior to the accumulation of cyclin D1 or p21. Similar to p21 no evidence is apparent on a correlation among the EdU positive cells between expression of p12 and EdU incorporation (r = 0.16).
KINETIC INFORMATION ON A SEQUENCE OF DEGRADATION OF CYCLIN D, P21WAF1, CDT1 AND P12 WITH RESPECT TO INITIATION OF DNA REPLICATION
Most information on a sequence of alterations of the levels of a particular protein with respect to DNA replication is generally obtained by Western blotting combined with cell synchronization. Such approaches, however suffer significant disadvantages. First, the analysis of cells in bulk lacks the information on the intercellular variability or the presence of distinct cell subpopulations. Furthermore, cell synchronization causes growth imbalance [60] and leads to altered (“unscheduled”) expression of cyclins [61]. It also triggers intense DNA damage signaling, the indicator of a replication stress [62]. The results obtained by this approach therefore, unlike the presently reviewed methods, have a certain degree of bias and may not precisely reflect the status of the cells otherwise progressing unperturbed through the cycle.
Reviewed are the proteins cyclin D1, p21, Cdt1 and p12 that are being degraded prior to initiation of DNA replication (Figure 1). The pattern of their expression in G1 vis-à-vis initiation of DNA replication provides clues on the “time window” between these events and thus on the sequence of their degradation with respect to each. As is evident, there were 75%, 80%, 46%, and 33%, of the D1-, p21-, Cdt1-, or p12- negative cells in G1 that did not initiate DNA replication, respectively. These data thus indicate that degradation of cyclin D1 and p21 preceded that of Cdt1, and that p12 was degraded last. Such sequence of the events was reproduced in the repeated experiments [20]. This succession of protein degradation suggests that the sequential removal of cyclin D1, p21 and Cdt1 are the preparatory steps to the formation of Pol δ and the loss of p12 appears to directly precede DNA replication, consistent with prior findings [20, 41-46]. With regard to the temporal regulation of the degradation of the CRL4Cdt2 substrates, this can be regarded at the biochemical level as dictated by the affinities of their respective degrons for PCNA, the platform on which they are recognized and degraded, as well as their relative abundances in the cell [20]. However, such approaches do not provide information on the actual kinetics in the cellular mileau. The use of EdU labeling and LSC approaches do reveal the temporal sequence with which these substrates are degraded, at least in relation to the initiation of DNA synthesis. This analysis encompasses the earliest stages of DNA synthesis and captures also those cells just beginning to initiate DNA synthesis that formally by their DNA content are still identified as in G1. Thus, these approaches may be of some utility as a means of studying temporal events in the complex process of the initiation of DNA replication.
Interesting also is comparison of the correlation between termination of DNA replication and reappearance of these proteins in G2 phase of the cell cycle. This can be estimated from the frequency of the cells with a G2M DNA content that are still replicating DNA (entering G2M during duration of the EdU pulse) while showing absence of the respective protein. These cells provide the estimate of a length of time between the completion of EdU incorporation and accumulation of the protein. As is seen in Figure 1, the lowest percentage of cells with a G2M DNA content that are EdU positive and negative with respect to the respective protein is in the case of p12 (29%), which is distinctly lower than for cyclin D1 (51%), p21 (57) or Cdt1 (55%). Termination of DNA replication, thus, is being initially followed by reappearance of p12 and later by Cdt1, Cyclin D1 and p21.
It can be argued that the rate of EdU incorporation in individual cells may be influenced by its rate of penetration through plasma membrane as well as by equilibration and competition with the endogenous pool of dT and this may bias the estimate of the time of initiation and the early rate of DNA replication. We have recently observed, however, that EdU penetration through plasma membrane and incorporation into DNA is very rapid, viz. as short as 30 sec duration of A549 cells exposure to EdU results in the detectable level of its incorporation [15]. Given the above, the assessments of initiation and the rate of DNA replication are unlikely to be affected by limitations of the accessibility and conversion of EdU to its triphosphate precursor.
POSITIVE MARKERS OF DNA REPLICATION: CYCLIN E, CYCLIN A, PCNA AND KI-67
Cyclin E
As mentioned while discussing cyclin D1, phosphorylation of pRb by the cyclin D-Cdk4/6 releases E2F factors that trigger transcription of several genes, including that of cyclin E [63, 64]. Cyclin E forms a complex with CDK2 and this kinase plays a critical role in cell progression through G1 and in the G1 to S phase transition. Cyclin E/CDK2 phosphorylates retinoblastoma protein (Rb) to promote G1 progression [28, 29, 65]. Hyper-phosphorylated Rb can no longer bind to E2F transcriptional factor, releasing it to promote expression of genes essential to drive cells through G1 phase to S. During G1 and S cyclin E/CDK2 also phosphorylates p27 and p21 [65]. A key mediator of the TGF-β pathway that inhibits cell cycle progression Smad3 can also be phosphorylated by cyclin E/CDK2 and its phosphorylation which inhibits its transcriptional capability ultimately facilitates cell cycle progression [66]. Likewise, cyclin E/CDK2 phosphorylation of CBP/p300 and E2F-5 induces other transcriptional events that promote cell cycle progression [64]. To facilitate histone genes transcription during cell cycle cyclin E/CDK2 phosphorylates p220(NPAT) [65]. Still another substrate of E/CDK2 is nucleophosmin (NPM) whose phosphorylation leads to its release from binding to an unduplicated centrosome thereby triggering centrosome duplication [66]. Additionally, cyclin E/CDK2 phosphorylates CP110 which promotes centriole duplication and centrosome separation [67].
The relationship between expression of cyclin E and incorporation of EdU is shown in Figure 2A. The gating analysis clearly demonstrates that most of the cyclin E negative cells did not initiate DNA replication. This is evident in the middle panel which shows that the cells incorporating EdU, including essentially the cells which were initiating incorporation during the pulse of EdU, were cyclin E positive. The initiation of EdU incorporation thus starts with accumulation of cyclin E to the level that can be immunocytochemically detected. However, a notable number of cells with a G1 DNA content and high expression of cyclin E that did not initiated EdU incorporation is evident (Figure 2A, mid-panel). These cells, thus, despite an increase in cyclin E content, are still being held in G1 apparently by other factors than by the deficit in amount of this cyclin. The level of cyclin E expression drops during progression of cells through S and even more at the transition to G2. Since the cells with G2M DNA content are essentially cyclin E negative the stepwise degradation of cyclin E during progression through S appears to be nearly completed at the time of S to G2 transition or early in G2.
Figure 2. Expression of cyclin E, cyclin A, PCNA and Ki-67 in relation to incorporation of EdU.
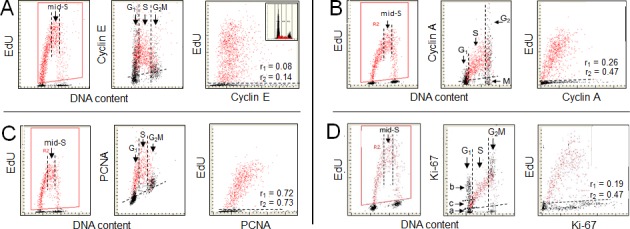
Similar as described in the legend to Fig. 1 A549 cells were exposed to EdU for 60 min and incorporation of EdU was correlated with expression cyclin E, cyclin A, PCNA or Ki-67 and also related to cellular DNA content [11-15, 20]. The cells incorporating EdU were gated (left panels; red dots) and on the bivariate scatterplots correlated with expression of the respective protein, detected immunocytochemically (mid- and right- panels). Additional gating was done to select the mid-S phase cells as shown on the left panels by the parallel vertical lines. The DNA content frequency histogram representing cells from the studied culture is shown in the A right panel. As described in legend to Fig. 1 the dashed skewed lines in mid-panels show the upper level of fluorescence intensity of the cells not incubated with the primary Ab (mid-panels). The correlation coefficients between DNA replication of the mid-S gated cell population (r1 = x), or of the all EdU-positive cells (r2 = x) and expression of the respective proteins are shown in the right panels. {Figs. 1 and 2 are adapted from ref. [20] with permission of authors and publisher}.
There is a distinct intercellular variability in the amount of incorporated EdU among the cells in the mid-S phase, i.e., the cells that were exposed to the precursor for the full duration (60 min) of the labeling as seen on the scatterplot representing EdU vs cyclin E (Figure 2A; left panel). This is also evident in the case of EdU vs cyclin A (B) or EdU vs PCNA (C). It is likely that this variability is due to different rates of DNA replication in individual cells. Since each of these proteins is associated with the machinery of cell cycle progression it can be expected that its abundance during S phase may be correlated with DNA replication rate as revealed by EdU incorporation. To explore such a possibility the mid-S phase cells were selected by the secondary gating as shown in Figure 2A, 2B, 2C and 2D, left panels. A correlation between incorporation of EdU and the level of expression of these proteins, measured in individual mid-S phase cells, was then analyzed. In the case of cyclin E the regression analysis of this cell subpopulation revealed no correlation between these two variables (r1 = 0.08). However, the correlation between EdU and cyclin E level among all EdU-positive cells, which includes in addition to the mid-S phase also the cells undergoing G1 to S and S to G2 transition during duration of the pulse, was a bit stronger (Figure 2A; r2 = 0. 14). Thus, incorporation of EdU appears not to be correlated in any significant way with the abundance of this protein, neither during mid-S nor throughout whole S phase length. This apparent lack of a correlation between cellular content of cyclin E and initiation of DNA replication can be explained that in addition to Rb a multitude of targets that are not directly driving the cell through G1S are being phosphorylated by the cyclin E/CDK2 [29, 63-67].
Cyclin A
Cyclin A regulates progression through the cell cycle at two distinct phases. Its association with CDK2 is required for passage through S phase whereas association with CDK1 drives the cell into mitosis [68-70]. Cyclin A starts to accumulate during S and is abruptly destroyed just prior to metaphase. During the duration of S phase, cyclin A resides in the nucleus where it is involved in the initiation and completion of DNA replication [71, 72]. During initiation, cyclin A/CDK2 phosphorylates several constituents of the DNA replication machinery including CDC6, whose function is of importance for initiation of DNA replication as well as for restriction of the initiation only once per cell cycle. During mitosis cyclin A regulates kinetochore microtubules to promote faithful chromosome segregation [72]. Interestingly, whereas vertebrate cells can enter mitosis in the absence of cyclin A and chromosome segregation is essentially preserved, the incidence of miss-segregation in cells lacking cyclin A is increased [73]. This would indicate a role of cyclin A/CDK1 activity in preservation of faithfulness of chromosome segregation during mitosis [72, 73].
The relationship between expression of cyclin A and incorporation of EdU is presented in Figure 2B. In contrast to expression of cyclin D1 (Figure 1A), it is the presence of cyclin A rather than its absence that is associated with DNA replication. As shown by us previously based on incorporation of BrdU [74, 75] and seen presently, the expression of this protein is confined to cells in late G1, S and G2. Accordingly, all EdU incorporating are cyclin A positive. Its content progressively increases with cell advancement through the S phase, peaks late in S and in G2, and is followed by degradation at the entrance to mitosis, concurrently with phosphorylation of Ser10 of histone H3 in the mitotic cells [76]. The latter, thus can be identified as having a G2M DNA content and being cyclin A negative (Figure 2B; mid panel) and phosphorylated H3 positive [76].
As discussed above in reference to cyclin E, the observed intercellular variability in the mid-S phase may be due to differences in rates of DNA replication in individual cells. Because cyclin A is associated with the machinery of the cell progression through S even more so than cyclin E, it is interesting to assess the correlation between cyclin A and EdU incorporation. The regression analysis of the mid-S cell subpopulation revealed relatively weak positive correlation between EdU incorporation and cyclin A expression (r1 = 0.26), although somewhat stronger than in the case of cyclin E. However, the correlation between EdU and cyclin A level among all EdU-positive cells, which includes in addition to the S phase also the cells undergoing G1 to S and S to G2 transition during the duration of the pulse, is distinctly stronger (r2 = 0.47). Thus, whereas the presence of cyclin A is closely associated with incorporation of EdU, from its onset at the G1 to S transition to the termination at the entrance to G2, the abundance of this cyclin appears to be moderately correlated with rate of EdU incorporation.
As mentioned, the correlation between DNA replication and expression of the cyclins D1, E and A is consistent with cytometric analysis of these cyclin proteins based on analysis of BrdU incorporation and SBIP methodology presented in the prior reports [74-76]. The presented data conform also to the assessments of the cell cycle kinetics based on multiparameter analysis of cyclins expression with respect to other proteins of the cell cycle machinery as reported by Jacobberger and his colleagues [77-79]. Their studies however were based on static analysis of presentation of these proteins vis-a-vis cellular DNA content (cell cycle phase) and did not include the kinetic information pertaining initiation and completion of DNA replication, or the rate of DNA replication that can be inferred from the degree of EdU incorporation during the pulse labeling. The presently reviewed data on cyclins are also in accordance with the findings of Furia et al., [16, 17] and complement these earlier cytometric studies by offering a more complete view on a relationship between the intracellular content of the investigated cyclins and DNA replication.
Proliferating cell nuclear antigen (PCNA)
PCNA was originally recognized as an antigen characteristic of proliferating cells that is expressed in cells nuclei during S phase of the cell cycle [80]. PCNA is a widely recognized cell proliferation marker serving also as a prognostic indicator for variety of tumors [81, 82]. This protein is the DNA sliding clamp that serves as the processivity factor for Pol δ and also as a docking platform where other proteins dock to carry out different processes related to DNA replication and repair [83-87]. The proteins interact with PCNA through the two interacting motifs: PCNA-interacting peptide (PIP) box [88, 91] and AlkB homologue 2 PCNA interacting motif (APIM) [89]. The proteins binding through the PIP-box are primarily associated with DNA replication while these binding through APIM are more important in DNA repair [90].
The relationship between expression of PCNA and DNA replication is presented in Figure 2C. There is a striking similarity between the patterns of EdU incorporation (left panels) vs. that of PCNA expression (mid-panel) in relation to DNA content. The gating analysis reveals that all cells that incorporate EdU do also express PCNA and the cells initiating DNA replication have minimal content of this protein. The expression of PCNA as well as incorporation of EdU both peak in mid-S phase. In analogy to expression of cyclin E (Figure 2A) and cyclin A (Figure 2B) the mid-S phase cells incorporating EdU were selected to assess a correlation between expression of this protein and EdU incorporation. The correlation between these variables is significantly stronger for PCNA (r1 = 0.72) compared to that assessed for cyclin A or cyclin E. Essentially the same degree of correlation between EdU incorporation and expression of PCNA is seen in the case of all cells replicating DNA i.e. including cells entering- and exiting- S phase during duration of the pulse (r2 = 0.73) as for the cells in the mid-S phase.
Ki-67 protein
The protein Ki-67 is perhaps the most widely used indicator of cycling cells [91]. Although this marker has been known for over three decades [91, 92] its molecular structure and role in cell cycle progression has only recently begun to be elucidated. The reported data indicate that the Ki-67 protein is the key factor in RNA polymerase I dependent nucleolar rRNA synthesis [93-95]. Its expression thus is associated with the production and accumulation of ribosomal RNA. The actuality that Ki-67 is such a dependable marker of proliferation is consistent with results of our early studies showing that the content of cellular rRNA strongly correlates with cell proliferation and its abundance can be used to distinguish the cycling from non-cycling cells [96, 97]. Many subsequent studies have confirmed value of cellular RNA content as a determinant of cells progressing through the cycle [98, 99], also as being correlated with the rate of traverse through the cycle [100, 101], as well as being associated with tumor prognosis [102].
The relationship between DNA replication and expression of Ki-67 protein is shown in Figure 2D. The pattern of Ki-67 expression vis-a-vis DNA replication reveals a striking heterogeneity of the G1 cell subpopulation inasmuch as it shows the presence of three subgroups along the Ki-67 coordinate, one the Ki-67 negative (a), the second strongly positive but not initiating DNA replication (b), and the third one, intermediate in expression of Ki-67, from which the cells initiate to incorporate EdU (c). This subdivision of cells in G1 phase resembles their classification onto G1Q, G1A and G1B compartments based on content of cellular RNA (rRNA) and defined as quiescent (G1Q, with minimal RNA content), temporarily noncycling, in the growth phase, accumulating rRNA and protein, prior to the “restriction point” R, (G1A, with mid-RNA content), and cells that passed the restriction point, undergoing transition to S (G1B, with maximal RNA content) [98, 99]. In analogy to the RNA content as a marker, most likely that: the “a” cells, Ki-67 negative, represent the cells temporarily withdrawn from the cycle (G1Q-like cells); the “b”, Ki-67 positive/EdU negative cells, are in the growth phase (equivalent of G1A cells while “c”, the cells entering S phase are analogous to the G1B cells, which after accumulation of the threshold amount of rRNA or growth to the threshold size (protein content) initiate DNA replication [96-99]. Interestingly, the localization of Ki-67 as assessed by LSC is predominantly in nucleoli [20], consistent with the already mentioned function as a ribosome factory. The subdivision of G1 to the above compartments also resembles that based on binding of Mcm6 and PCNA, which also are delineating the presence of the restriction point R [103].
There is an evident relationship between the degree of expression of Ki-67 and advancement of cells through S phase, with much more than doubling in content of this protein at the S/G2 interphase compared to cells at G1/S transition (Figure 2D). This supports the prior observation that the ratio of Ki-67 to DNA content increased three-fold during S and that this protein was partially degraded in G2 prior to mitosis [104]. Similar as in the case of other proteins (Figure 2A, 2B, 2C) we have tested whether the intercellular variability in EdU incorporation of the cells in mid-S phase is correlated with Ki-67 expression. The regression analysis of the mid-S cell subpopulation shows rater weak positive correlation between these variables (r1 = 0.19). However, as in the case of cyclin A (Figure 2B), the correlation is significantly stronger when assessed for all cells incorporating EdU, i.e. including the cells entering- and exiting- S phase during the EdU pulse (r2 = 0.47).
EXPRESSION OF THE DNA REPLICATION-ASSOCIATED PROTEINS IN RELATION TO EACH OTHER
The possibility to concurrently measure different proteins, each tagged with fluorochrome of different color, makes possible to reveal the differential expression of these proteins in individual cells with respect to each other. Figure 3 illustrates the relationship in relative abundance of the positive markers of DNA replication cyclin A, and Ki-67 with respect to p21 and Cdt1, the proteins that are degraded prior to the initiation of DNA replication and synthesized after completion of the replication. In the case of cyclin A (Figure 3A) the data show that essentially all cells expressing p21 (colored red) are cyclin A negative. Of particular interest, however, is analysis of the mitotic cells. As shown by us before [31, 105] mitotic cells are cyclin A negative and therefore, having a G2M DNA content, can be identified by cytometry as marked “M” in the mid-panel of Figure 3A. On a close look it is evident they are p21 positive. Thus, the transition from G2 to M, while is associated with the loss of cyclin A, is concurrent with the appearance of p21. Because overall rate of protein synthesis is markedly reduced during mitosis [106, 107] it is likely that p21 is synthesized prior to mitosis, in late G2. The post-mitotic cells therefore inherit this protein in a significant degree following cytokinesis. The level of p21 is then gradually being reduced during progression through G1 so that the cells entering S are p21 negative. These data clearly indicate that there is exclusivity in expression of cyclin A vs. p21 in individual cells: when one of these proteins is present the other is absent. This is also exemplified in the right panel of Figure 3A as the total separation of p21 positive- from the cyclin A- positive cells on the bivariate distribution scatterplot.
Figure 3. Expression of cyclin A, and Ki-67 in relation the expression of p21WAF1 and Cdt1, measured in the same individual cells.
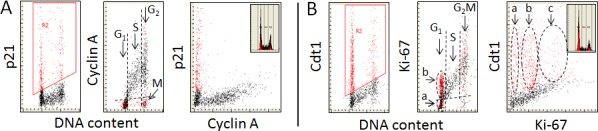
The individual proteins were detected in A549 cells immunocytochemically using the primary Abs of either mice or goat and the secondary Ab anti-mouse or anti-goat, respectively, labeled with fluorochromes of different emission wavelength; cellular fluorescence was measured by LSC [12-15,20,21]. The gating analysis was based on the selection of cells that were positive in the expression of p21 A. or Cdt1 B. (left panels; colored red) and the expression of these proteins was juxtaposed with the expression of cyclin A A. or Ki-67 B.. The insets in the right panels show DNA content frequency histograms from the respective cultures. As described in legend to Fig. 1 the dashed skewed lines in mid-panels show the upper level of fluorescence intensity of the negative control. See the text for further details.
The bivariate distribution of Ki-67 vs. Cdt1 (Figure 3B) resembles to some extent that of Ki-67 vs. EdU (Figure 2D). Two subpopulations of Cdt1 positive cells can be identified in G1 when displayed with respect to expression of Ki-67 vs. DNA content – one having minimal or no expression of Ki-67 (“y”) and the second with elevated expression of this protein (“x”) (Figure 3B, mid-panel). The G1 Ki-67 positive cells in all probability correspond to the cells marked “b” plus “c” in Figure 2D, and the S phase cells are, of course, are both EdU and Ki-67 positive. There are numerous Cdt1 negative cells in G1 in continuity with the S-phase cells in agreement with the evidence that nearly all Cdt1 negative cells are EdU positive (Figure 1C). Three cell subpopulations can be distinguished on the Ki-67 vs. Cdt1 bivariate distribution (Figure 3B; right panel). While the “y” and “x” cells correspond to the same marked on the DNA content vs. Ki-67 (mi-panel), the “z” cells represent both the Ki-67 and Cdt1 positive cells in the G2 phase of the cell cycle (Figure 2D).
Of interest is to note striking heterogeneity of cells in G2M in terms of expression of Ki-67, with some cells being Ki-67 negative while other having the exceptionally high expression of this protein. Also evident is the presence of the Cdt1 positive cells in the G2M. Their distribution is likewise very wide (Figure 3B, mid panel) extending from the lowest to the highest level of expression of Ki-67. It is somewhat puzzling to see the presence of Cdt1 positive cells in G2M since it has been reported that this protein is being degraded in G2 to prevent the re-replication [108, 109]. However, it has been also reported that during rapid cell proliferation Cdt1 can be synthesized shortly after DNA replication, essentially by-passing the G2 interval with no induction of re-replication [110]. Furthermore, the presence of Cdt1 alone was reported to be inept to overcome the inhibitory controls that prevent DNA replication in G2 as it requires a concurrent presence of Cdc18 to abolish these controls to enable the re-replication [111, 112].
DNA REPLICATION ASSOCIATED PROTEINS AS MARKERS OF CELL PROLIFERATION IN CYTOPATHOLOGY
PCNA and Ki-67 are well recognized indicators of cell proliferation, frequently assessed in cytopathology as diagnostic and prognostic markers in a variety of diseases, primarily in cancer [113-115]. Expression of cyclin A has also been recently noticed as a proliferation marker and used in clinical pathology [116-119]. Likewise, cyclin E become also recognized in this category of the markers [120-122]. The data presently reviewed reveal a direct relationship between these markers and DNA replication, correlating their expression vis-a-vis incorporation of EdU and also relating to the cell cycle phase as estimated by DNA content. Whereas nearly all cells incorporating EdU are PCNA-, cyclin A-, and cyclin E- positive, of each of these proteins the expression of PCNA (Figure 1) most closely represents the population of cells actually replicating DNA. In the case of cyclin E, its highest levels of expression are in the cells just initiating DNA replication, while PCNA and cyclin A are expressed maximally in the mid-S phase cells. These data thus indicate that immunocytochemical identification of the PCNA-, cyclin A-, and cyclin E- positive cells in pathological specimens provides direct information on DNA replicating cells, equivalent to that otherwise obtained by analysis of incorporation of the DNA precursor. It should be noted however, that the expression of cyclin E (also of cyclin D1) in some tumors, as well as in certain cell lines, was found to be unscheduled [123-125] and thus not exactly as related to DNA replication as presently shown. However because the presence of cyclin A and of PCNA appears to be most strongly associated with DNA replication machinery [30,126-128] and there is no publishable evidence of their unscheduled expression, these proteins appear to be the most faithful indicators of this cellular event.
The relationship between expression of protein detected by Ki-67 Ab and DNA replication is more complex (Figure 2D). This protein, in addition to be present in all DNA replicating cells is also detected in G1 and G2/M population of cells that show no evidence of EdU incorporation. As discussed earlier in the text, in addition to the DNA replicating cells Ki-67 Ab detects also the cells appear to be in the growth – pre-replicative phase, but it is absent in the cells that are off the cell cycle – (G0, G1Q cells) [96-99]. The Ki-67 Ab therefore, has a wider spectrum of detection of the proliferating cells compared with the expression of PCNA, cyclin A or cyclin E, as the presence of the latter proteins is more inclusive to DNA replicating cells.
The distinct absence of expression of cyclin D1, p21, p12 and Cdt1 proteins in the cells incorporating EdU provides the negative markers of DNA replication. Of note, however, is the observation that induction of DNA damage, likely followed by DNA repair, may also lead to the degradation of p12 [45, 46]. If this occurs in G1 or G2M cells the absence of p12 in such a case not necessarily is an indicator of the S-phase. Detection of the characteristic features of individual cells associated with DNA replication by multiparameter cytometry in addition to offering insights into molecular mechanisms controlling advancement through the cell cycle provides also indicators of cancer progression and stage that have diagnostic and prognostic clinical value.
A note of caution should be added that the immunocytochemical detection of intracellular proteins has shortcomings to be taken into an account when analyzing the cytometric data. The affinity and specificity of different batches of Abs towards epitope of the detected protein can vary, especially in the case of the polyclonal Abs [129]. The problem can be exacerbated by a possibility of cross-reactivity of the Ab with other proteins [130] as well as of auto-fluorescence of cellular constituents [131]. Therefore the detection of the background level of fluorescence to identify the specifically labeled cells based on the use of either the isotype control or the cells treated with the secondary Ab labeled with the fluorochrome only is not always definite. Furthermore, the steric hindrance [132, 133] and mode of cell fixation play a crucial role in the ability of detection of the particular protein. For example, depending on the mode of cell fixation PCNA can be either present only in nuclei of S-phase cells or can also be detected in G1 and G2 (but not G0) phase cells [134-136]. In the first case it is the chromatin/DNA-bound PCNA that after extraction of the detergent-soluble proteins prior to fixation and immuno-staining remains solely in the nucleus of S-phase cells [135, 136]. Otherwise, PCNA is present in G1 and G2 cells as shown in Figure 2C [20]. The choice of the fixative, cross-linking (e.g. formaldehyde) vs. precipitating (e.g. alcohols) plays critical role on detection of different epitopes. All immunocytochemical evidence, therefore, should be critically analyzed with mind of these possible impediments. Supplementation of the immunocytochemical evidence by the Western blotting, e.g. as it was shown in analysis of the p12 protein [45, 53, 54] provides more definite evidence of the presence and relative content of the particular protein in the cell.
Acknowledgments
Supported by NIH NCI RO1: 28 704, and the Robert A. Welke Foundation for Cancer Research (ZD,HZ) and NIH GM31973 and ES14737 (MYWTL).
REFERENCES
- 1.Dolbeare F, Gratzner H, Pallavicini MG, Gray JW. Flow cytometric measurement of total DNA content and incorporated bromodeoxyuridine. Proc Natl Acad Sci U S A. 1983;80:5573–5577. doi: 10.1073/pnas.80.18.5573. [DOI] [PMC free article] [PubMed] [Google Scholar]
- 2.Dolbeare F, Gray JW. Use of restriction endonucleases and exonuclease III to expose halogenated pyrimidines for immunochemical staining. Cytometry. 1988;9:631–635. doi: 10.1002/cyto.990090619. [DOI] [PubMed] [Google Scholar]
- 3.Li X, Traganos F, Melamed MR, Darzynkiewicz Z. Single step procedure for DNA strand-breaks labeling. Detection of apoptosis and DNA replication. Cytometry. 1995;20:172–180. doi: 10.1002/cyto.990200210. [DOI] [PubMed] [Google Scholar]
- 4.Salic A, Mitchison TJ. A chemical method for fast and sensitive detection of DNA synthesis in vivo. Proc Natl Acad Sci U S A. 2008;105:2415–2420. doi: 10.1073/pnas.0712168105. [DOI] [PMC free article] [PubMed] [Google Scholar]
- 5.Sun Y, Sun Y, Lin G, Zhang R, Zhang K, Xie J, Wang L, Li J. Multicolor flow cytometry analysis of the proliferations of T-lymphocyte subsets in vitro by EdU incorporation. Cytometry A. 2012;81:901–909. doi: 10.1002/cyto.a.22113. [DOI] [PubMed] [Google Scholar]
- 6.Buck SB, Bradford J, Gee KR, Agnew BJ, Clarke ST, Salic A. Detection of S-phase cell cycle progression using 5-ethynyl-2′-deoxyuridine incorporation with click chemistry, an alternative to using 5-bromo-2′-deoxyuridine antibodies. BioTechniques. 2008;44:927–929. doi: 10.2144/000112812. [DOI] [PubMed] [Google Scholar]
- 7.Darzynkiewicz Z, Traganos F, Zhao H, Halicka HD, Li J. Cytometry of DNA replication and RNA synthesis: Historical perspective and recent advances based on “click chemistry”. Cytometry A. 2011;79:328–337. doi: 10.1002/cyto.a.21048. [DOI] [PMC free article] [PubMed] [Google Scholar]
- 8.Diermeier-Daucher S, Clarke ST, Hill D, Vollmann-Zwerenz A, Bradford JA, Brockhoff G. Cell type specific applicability of 5-ethynyl-2′-deoxyuridine (EdU) for dynamic proliferation assessment in flow cytometry. Cytometry A. 2009;75:535–546. doi: 10.1002/cyto.a.20712. [DOI] [PubMed] [Google Scholar]
- 9.Kohlmeier F, Maya-Mendoza A, Jackson DA. EdU induces DNA damage response and cell death in mESC in culture. Chromosome Res. 2013;21:87–100. doi: 10.1007/s10577-013-9340-5. [DOI] [PMC free article] [PubMed] [Google Scholar]
- 10.Zhao H, Halicka HD, Li J, Biela E, Berniak K, Dobrucki J, Darzynkiewicz Z. DNA damage signaling, impairment of cell cycle progression, and apoptosis triggered by 5-ethynyl-2′-deoxyuridine incorporated into DNA. Cytometry A. 2013;83:979–88. doi: 10.1002/cyto.a.22396. [DOI] [PMC free article] [PubMed] [Google Scholar]
- 11.Berniak K, Rybak P, Bernaś T, Zarębski M, Biela E, Zhao H, Darzynkiewicz Z, Dobrucki JW. Relationship between DNA damage response, initiated by camptothecin or oxidative stress, and DNA replication, analyzed by quantitative 3D image analysis. Cytometry A. 2013;83A:913–824. doi: 10.1002/cyto.a.22327. PMCID: PMC3888650. [DOI] [PMC free article] [PubMed] [Google Scholar]
- 12.Bernaś T, Berniak K, Rybak P, Zarębski M, Zhao H, Darzynkiewicz Z, Dobrucki JW. Analysis of spatial correlations between patterns of DNA Damage Response and DNA replication in nuclei of cells subjected to replication stress or oxidative damage. Cytometry A. 2013;83A:825–932. doi: 10.1002/cyto.a.22325. [DOI] [PMC free article] [PubMed] [Google Scholar]
- 13.Zhao H, Dobrucki J, Rybak P, Traganos F, Darzynkiewicz Z. Relationship of DNA damage signaling induced by DNA topoisomerase inhibitors camptothecin/topotecan, mitoxantrone or etoposide and DNA replication. Cytometry A. 1012;81A:45–51. doi: 10.1002/cyto.a.21172. [DOI] [PMC free article] [PubMed] [Google Scholar]
- 14.Zhao H., Traganos F, Darzynkiewicz Z. Kinetics of the UV-induced DNA damage response in relation to cell cycle phase. Correlation with DNA replication. Cytometry A. 2010;77A:285–293. doi: 10.1002/cyto.a.20839. [DOI] [PMC free article] [PubMed] [Google Scholar]
- 15.Li B, Zhao H, Rybak P, Dobrucki JW, Darzynkiewicz Z, Kimmel M. Different rates of DNA replication at early versus late S-phase sections, Multiscale modeling of stochastic events related to DNA content/EdU incorporation bivariate distributions. Cytometry A. 2014;85A:785–797. doi: 10.1002/cyto.a.22484. [DOI] [PubMed] [Google Scholar]
- 16.Furia L, Pelicci PG, Faretta M. A computational platform for robotized fluorescence microscopy (I): high-content image-based cell-cycle analysis. Cytometry A. 2013;83A:333–343. doi: 10.1002/cyto.a.22266. [DOI] [PubMed] [Google Scholar]
- 17.Furia L, Pelicci PG, Faretta M. A computational platform for robotized fluorescence microscopy (II): DNA damage, replication, checkpoint activation, and cell cycle progression by high-content high-resolution multiparameter image-cytometry. Cytometry A. 2013;83A:344–355. doi: 10.1002/cyto.a.22265. [DOI] [PubMed] [Google Scholar]
- 18.Furia L, Pelicci P, Faretta M. High-resolution cytometry for high-content cell cycle analysis. Curr Protoc Cytom. 2014;70(7.41):1–7. doi: 10.1002/0471142956.cy0741s70. [DOI] [PubMed] [Google Scholar]
- 19.Furia L, Pelicci P, Faretta M. Confocal microscopy for high-resolution and high-content analysis of the cell cycle. Curr Protoc Cytom. 2014;70(7.42):1–7. doi: 10.1002/0471142956.cy0742s70. [DOI] [PubMed] [Google Scholar]
- 20.Zhao H, Zhang S, Xu D, YWT Lee MYWT, Zhang Z, Lee EYC, Darzynkiewicz Z. Expression of the p12 subunit of human DNA polymerase δ (Pol δ), CDK inhibitor p21WAF1, Cdt1, cyclin A, PCNA and Ki-67 in relation to DNA replication in individual cells. Cell Cycle. 2014;13:3529–3540. doi: 10.4161/15384101.2014.958910. [DOI] [PMC free article] [PubMed] [Google Scholar]
- 21.Pozarowski P, Holden E, Darzynkiewicz Z. Laser scanning cytometry: Principles and applications. An update. Meth Molec Biol. 2013;913:187–212. doi: 10.1007/978-1-62703-056-4_11. [DOI] [PMC free article] [PubMed] [Google Scholar]
- 22.Lim S, Kaldis P. Cdks, cyclins and CKIs: roles beyond cell cycle regulation. Development. 2013;140:3079–93. doi: 10.1242/dev.091744. [DOI] [PubMed] [Google Scholar]
- 23.Chang F, Steelman LS, Lee JT, Shelton JG, Navolanic PM, Blalock WL, Franklin RA, McCubrey JA. Signal transduction mediated by the Ras/Raf/MEK/ERK pathway from cytokine receptors to transcription factors: potential targeting for therapeutic intervention. Leukemia. 2003;17:1263–1293. doi: 10.1038/sj.leu.2402945. [DOI] [PubMed] [Google Scholar]
- 24.Bretones G, Delgado MD, León J. Myc and cell cycle control. Biochim Biophys Acta. 2014 Apr 1; doi: 10.1016/j.bbagrm.2014.03.013. Epub ahead of print. [DOI] [PubMed] [Google Scholar]
- 25.Duronio RJ, Xiong Y. Signaling pathways that control cell proliferation. Cold Spring Harb Perspect Biol. 2013;5:a008904. doi: 10.1101/cshperspect.a008904. [DOI] [PMC free article] [PubMed] [Google Scholar]
- 26.Manchado E, Eguren M, Malumbres M. The anaphase-promoting complex/cyclosome (APC/C): cell-cycle-dependent and -independent functions. Biochem Soc Trans. 2010;38:65–71. doi: 10.1042/BST0380065. [DOI] [PubMed] [Google Scholar]
- 27.Chang L, Zhang Z, Yang J, McLaughlin SH, Barford D. Molecular architecture and mechanism of the anaphase-promoting complex. Nature. 2014;513:388–393. doi: 10.1038/nature13543. [DOI] [PMC free article] [PubMed] [Google Scholar]
- 28.Giacinti C, Giordano A. RB and cell cycle progression. Oncogene. 2006;25:5220–5227. doi: 10.1038/sj.onc.1209615. [DOI] [PubMed] [Google Scholar]
- 29.Hinds PW, Mittnacht S, Dulic V, Arnold A, Reed SI, Weinberg RA. Regulation of retinoblastoma protein functions by ectopic expression of human cyclins. Cell. 1992;70:993–1006. doi: 10.1016/0092-8674(92)90249-c. [DOI] [PubMed] [Google Scholar]
- 30.Gong JP, Li X, Traganos F, Darzynkiewicz Z. Expression of G1 and G2 cyclins measured in individual cells by multiparameter flow cytometry; a new tool in the analysis of the cell cycle. Cell Prolif. 1994;27:357–371. [Google Scholar]
- 31.Darzynkiewicz Z, Gong JP, Juan G, Ardelt B, Traganos F. Cytometry of cyclin proteins. Cytometry. 1996;25:1–13. doi: 10.1002/(SICI)1097-0320(19960901)25:1<1::AID-CYTO1>3.0.CO;2-N. [DOI] [PubMed] [Google Scholar]
- 32.Abbas T, Dutta A. p21 in cancer: intricate networks and multiple activities. Nat Rev Cancer. 2009;9:400–414. doi: 10.1038/nrc2657. [DOI] [PMC free article] [PubMed] [Google Scholar]
- 33.Soria G, Gottifredi V. PCNA-coupled p21 degradation after DNA damage: The exception that confirms the rule? DNA Repair (Amst) 2010;9:358–364. doi: 10.1016/j.dnarep.2009.12.003. [DOI] [PMC free article] [PubMed] [Google Scholar]
- 34.el-Deiry WS, Tokino T, Velculescu VE, Levy DB, Parsons R, Trent JM, Lin D, Mercer WE, Kinzler KW, Vogelstein B. WAF1, a potential mediator of p53 tumor suppression. Cell. 1993;75:817–825. doi: 10.1016/0092-8674(93)90500-p. [DOI] [PubMed] [Google Scholar]
- 35.Xiong Y, Hannon GJ, Zhang H, Casso D, Kobayashi R, Beach D. p21 is a universal inhibitor of cyclin kinases. Nature. 1993;366:701–704. doi: 10.1038/366701a0. [DOI] [PubMed] [Google Scholar]
- 36.Gartel AL, Radhakrishnan SK. Lost in transcription: p21 repression, mechanisms, and consequences. Cancer Res. 2005;65:3980–3985. doi: 10.1158/0008-5472.CAN-04-3995. [DOI] [PubMed] [Google Scholar]
- 37.Child ES, Mann DJ. The intricacies of p21 phosphorylation. Cell Cycle. 2006;5:1313–1319. doi: 10.4161/cc.5.12.2863. [DOI] [PubMed] [Google Scholar]
- 38.Rössig L, Jadidi AS, Urbich C, Badorff C, Zeiher AM, Dimmeler S. Akt-dependent phosphorylation of p21(Cip1) regulates PCNA binding and proliferation of endothelial cells. Mol Cell Biol. 2001;21:5644–5657. doi: 10.1128/MCB.21.16.5644-5657.2001. [DOI] [PMC free article] [PubMed] [Google Scholar]
- 39.Rodriguez R, Meuth M. Chk1 and p21 cooperate to prevent apoptosis during DNA replication fork stress. Mol. Biol. Cell. 2006;17:402–412. doi: 10.1091/mbc.E05-07-0594. [DOI] [PMC free article] [PubMed] [Google Scholar]
- 40.Abbas T, Dutta A. CRL4Cdt2: master coordinator of cell cycle progression and genome stability. Cell Cycle. 2011;10:241–249. doi: 10.4161/cc.10.2.14530. [DOI] [PMC free article] [PubMed] [Google Scholar]
- 41.Havens CG, Walter JC. Mechanism of CRL4(Cdt2), a PCNA-dependent E3 ubiquitin ligase. Genes Dev. 2011;25:1568–1582. doi: 10.1101/gad.2068611. [DOI] [PMC free article] [PubMed] [Google Scholar]
- 42.Rialland M, Sola F, Santocanale C. Essential role of human CDT1 in DNA replication and chromatin licensing. J Cell Sci. 2002;115:1435–1440. doi: 10.1242/jcs.115.7.1435. [DOI] [PubMed] [Google Scholar]
- 43.Nishitani H, Taraviras S, Lygerou Z, Nishimoto T. The human licensing factor for DNA replication Cdt1 accumulates in G1 and is destabilized after initiation of S-phase. J Biol Chem. 2001;276:44905–44911. doi: 10.1074/jbc.M105406200. [DOI] [PubMed] [Google Scholar]
- 44.Nishitani H, Sugimoto N, Roukos V, Nakanishi Y, Saijo M, Obuse C, Tsurimoto T, Nakayama KI, Nakayama K, Fujita M, Lygerou Z, Nishimoto T. Two E3 ubiquitin ligases, SCF-Skp2 and DDB1-Cul4, target human Cdt1 for proteolysis. EMBO J. 2006;25:1126–1136. doi: 10.1038/sj.emboj.7601002. [DOI] [PMC free article] [PubMed] [Google Scholar]
- 45.Lee MY, Zhang S, Lin SH, Wang X, Darzynkiewicz Z, Zhang Z, Lee EY. The tail that wags the dog: p12, the smallest subunit of DNA polymerase delta, is degraded by ubiquitin ligases in response to DNA damage and during cell cycle progression. Cell Cycle. 2013;13:23–31. doi: 10.4161/cc.27407. [DOI] [PMC free article] [PubMed] [Google Scholar]
- 46.Zhang S, Zhou Y, Sarkeshik A, Yates JR, Thomson T, Zhang Z, Lee EY, Lee MY. Identification of RNF8 as a ubiquitin ligase involved in targeting the p12 subunit of DNA polymerase δ for degradation in response to DNA damage. J Biol Chem. 2013;288:2941–2950. doi: 10.1074/jbc.M112.423392. [DOI] [PMC free article] [PubMed] [Google Scholar]
- 47.Huang QM, Akashi T, Masuda Y, Kamiya K, Takahashi T, Suzuki M. Roles of POLD4, smallest subunit of DNA polymerase delta, in nuclear structures and genomic stability of human cells. Biochem Biophys Res Commun. 2010;391:542–546. doi: 10.1016/j.bbrc.2009.11.094. [DOI] [PubMed] [Google Scholar]
- 48.Tsanov N, Kermi C, Coulombe P, Van der Laan S, Hodroj D, Maiorano D. PIP degron proteins, substrates of CRL4Cdt2, and not PIP boxes, interfere with DNA polymerase eta and kappa focus formation on UV damage. Nucleic Acids Res. 2014;42:3692–36706. doi: 10.1093/nar/gkt1400. [DOI] [PMC free article] [PubMed] [Google Scholar]
- 49.Burgers PM. Polymerase dynamics at the eukaryotic DNA replication fork. J Biol Chem. 2009;284:4041–4045. doi: 10.1074/jbc.R800062200. [DOI] [PMC free article] [PubMed] [Google Scholar]
- 50.Garg P, Burgers PM. DNA polymerases that propagate the eukaryotic DNA replication fork. Crit Rev Biochem Mol Biol. 2005;40:115–128. doi: 10.1080/10409230590935433. [DOI] [PubMed] [Google Scholar]
- 51.Kunkel TA, Burgers PM. Dividing the workload at a eukaryotic replication fork. Trends Cell Biol. 2008;18:521–527. doi: 10.1016/j.tcb.2008.08.005. [DOI] [PMC free article] [PubMed] [Google Scholar]
- 52.Zhang S, Zhou Y, Trusa S, Meng X, Lee EY, Lee MY. A novel DNA damage response: rapid degradation of the p12 subunit of DNA polymerase delta. J Biol Chem. 2007;282:15330–15340. doi: 10.1074/jbc.M610356200. [DOI] [PubMed] [Google Scholar]
- 53.Chea J, Zhang S, Zhao H, Zhang Z, Lee EY, Darzynkiewicz Z, Lee MY. Spatiotemporal recruitment of human DNA polymerase delta to sites of UV damage. Cell Cycle. 2012;11:2885–2895. doi: 10.4161/cc.21280. [DOI] [PMC free article] [PubMed] [Google Scholar]
- 54.Lee MY, Zhang S, Lin SH, Chea J, Wang X, LeRoy C, Wong A, Zhang Z, Lee EY. Regulation of human DNA polymerase delta in the cellular responses to DNA damage. Environ Mol Mutagen. 2012;53:683–698. doi: 10.1002/em.21743. [DOI] [PubMed] [Google Scholar]
- 55.Zhang S, Zhao H, Darzynkiewicz Z, Zhou P, Zhang Z, Lee EY, Lee MY. A novel function of CRL4Cdt2: regulation of the subunit structure of DNA polymerase delta in response to DNA damage and during the S phase. J Biol Chem. 2013;288:29950–29961. doi: 10.1074/jbc.M113.490466. [DOI] [PMC free article] [PubMed] [Google Scholar]
- 56.Lin SH, Wang X, Zhang S, Zhang Z, Lee EY, Lee MY. Dynamics of enzymatic interactions during short flap human Okazaki fragment processing by two forms of human DNA polymerase δ. DNA Repair (Amst) 2013;12:922–935. doi: 10.1016/j.dnarep.2013.08.008. [DOI] [PMC free article] [PubMed] [Google Scholar]
- 57.Meng X, Zhou Y, Lee EY, Lee MY, Frick DN. The p12 subunit of human polymerase delta modulates the rate and fidelity of DNA synthesis. Biochemistry. 2010;49:3545–3554. doi: 10.1021/bi100042b. [DOI] [PMC free article] [PubMed] [Google Scholar]
- 58.Meng X, Zhou Y, Zhang S, Lee EY, Frick DN, Lee MY. DNA damage alters DNA polymerase delta to a form that exhibits increased discrimination against modified template bases and mismatched primers. Nucleic Acids Res. 2009;37:647–657. doi: 10.1093/nar/gkn1000. [DOI] [PMC free article] [PubMed] [Google Scholar]
- 59.Huang QM, Tomida S, Masuda Y, Arima C, Cao K, Kasahara TA, Osada H, Yatabe Y, Akashi T, Kamiya K, Takahashi T, Suzuki M. Regulation of DNA polymerase POLD4 influences genomic instability in lung cancer. Cancer Res. 2010;70:8407–8416. doi: 10.1158/0008-5472.CAN-10-0784. [DOI] [PubMed] [Google Scholar]
- 60.Cohen LS, Studzinski GP. Correlation between cell enlargement and nucleic acid and protein content of HeLa cells in unbalanced growth produced by inhibitors of DNA synthesis. J Cell Physiol. 1967;69:331–339. doi: 10.1002/jcp.1040690309. [DOI] [PubMed] [Google Scholar]
- 61.Gong JP, Traganos F, Darzynkiewicz Z. Growth imbalance and altered expression of cyclins B1, A. E and D3 in MOLT-4 cells synchronized in the cell cycle by inhibitors of DNA replication. Cell Growth & Different. 1995;6:1485–1493. [PubMed] [Google Scholar]
- 62.Kurose A, Tanaka T, Huang X, Traganos F, Darzynkiewicz Z. Synchronization in the cell cycle by inhibitors of DNA replication induces histone H2AX phosphorylation, an indication of DNA damage. Cell Prolif. 2006;39:231–240. doi: 10.1111/j.1365-2184.2006.00380.x. [DOI] [PMC free article] [PubMed] [Google Scholar]
- 63.Cooley A, Zelivianski S, Jeruss JS. Impact of cyclin E overexpression on Smad3 activity in breast cancer cell lines. Cell Cycle. 2010;9:4900–4907. doi: 10.4161/cc.9.24.14158. [DOI] [PMC free article] [PubMed] [Google Scholar]
- 64.Morris L, Allen KE, La Thangue NB. Regulation of E2F transcription by cyclin E-Cdk2 kinase mediated through p300/CBP co-activators. Nat Cell Biol. 2000;2:232–239. doi: 10.1038/35008660. [DOI] [PubMed] [Google Scholar]
- 65.Ma T, Van Tine BA, Wei Y, Garrett MD, Nelson D, Adams PD, Wang J, Qin J, Chow LT, Harper JW. Cell cycle-regulated phosphorylation of p220(NPAT) by cyclin E/Cdk2 in Cajal bodies promotes histone gene transcription. Genes Dev. 2000;14:2298–2313. doi: 10.1101/gad.829500. [DOI] [PMC free article] [PubMed] [Google Scholar]
- 66.Tarapore P, Okuda M, Fukasawa K. A mammalian in vitro centriole duplication system: evidence for involvement of CDK2/cyclin E and nucleophosmin/B23 in centrosome duplication. Cell Cycle. 2002;1:75–81. [PubMed] [Google Scholar]
- 67.Tsang WY, Spektor A, Luciano DJ, Indjeian VB, Chen Z, Salisbury JL, Sánchez I, Dynlacht BD. CP110 cooperates with two calcium-binding proteins to regulate cytokinesis and genome stability. Mol Biol Cell. 2006;17:3423–3344. doi: 10.1091/mbc.E06-04-0371. [DOI] [PMC free article] [PubMed] [Google Scholar]
- 68.Yam CH, Fung TK, Poon RY. Cyclin A in cell cycle control and cancer. Cell Mol Life Sci. 2002;59:1317–1326. doi: 10.1007/s00018-002-8510-y. [DOI] [PMC free article] [PubMed] [Google Scholar]
- 69.Pagano M, Pepperkok R, Verde F, Ansorge W, Draetta G. Cyclin A is required at two points in the human cell cycle. EMBO J. 1992;11:961–971. doi: 10.1002/j.1460-2075.1992.tb05135.x. [DOI] [PMC free article] [PubMed] [Google Scholar]
- 70.Bendris N, Lemmers B, Blanchard JM, Arsic N. Cyclin A2 mutagenesis analysis: A new insight into CDK activation and cellular localization requirements. PLoS ONE. 2011;6:e22879. doi: 10.1371/journal.pone.0022879. [DOI] [PMC free article] [PubMed] [Google Scholar]
- 71.Woo RA, Poon RY. Cyclin-dependent kinases and S phase control in mammalian cells. Cell Cycle. 2003;2:316–324. [PubMed] [Google Scholar]
- 72.Kabeche L, Compton DA. Cyclin A regulates kinetochore microtubules to promote faithful chromosome segregation. Nature. 2013;502:110–113. doi: 10.1038/nature12507. [DOI] [PMC free article] [PubMed] [Google Scholar]
- 73.Gong D, Ferrell J. E. The roles of cyclin A2, B1, and B2 in early and late mitotic events. Mol Biol Cell. 2010;21:3149–3161. doi: 10.1091/mbc.E10-05-0393. [DOI] [PMC free article] [PubMed] [Google Scholar]
- 74.Juan G, Li X, Darzynkiewicz Z. Correlation between DNA replication and expression of cyclins A and B1 in individual MOLT-4 cells. Cancer Res. 1997;57:803–807. [PubMed] [Google Scholar]
- 75.Darzynkiewicz Z, Juan G, Traganos F. Cytometry of cell cycle regulatory proteins. Prog Cell Cycle Res. 2003;5:533–542. [PubMed] [Google Scholar]
- 76.Juan G, Traganos F, James WM, Ray JM, Roberge M, Sauve DM, Anderson H, Darzynkiewicz Z. Histone H3 phosphorylation and expression of cyclins A and B1 measured in individual cells during their progression through G2 and mitosis. Cytometry. 1998;32:71–77. doi: 10.1002/(sici)1097-0320(19980601)32:2<71::aid-cyto1>3.0.co;2-h. [DOI] [PubMed] [Google Scholar]
- 77.Weis MC, Avva J, Jacobberger JW, Sreenath SN. A data-driven, mathematical model of mammalian cell cycle regulation. PLoS One. 2014;13:e97130. doi: 10.1371/journal.pone.0097130. [DOI] [PMC free article] [PubMed] [Google Scholar]
- 78.Avva J, Weis MC, Sramkoski RM, Sreenath SN, Jacobberger JW. Dynamic expression profiles from static cytometry data: component fitting and conversion to relative, “same scale” values. PLoS One. 2012;7:e38275. doi: 10.1371/journal.pone.0038275. [DOI] [PMC free article] [PubMed] [Google Scholar]
- 79.Jacobberger JW, Avva J, Sreenath SN, Weis MC, Stefan T. Dynamic epitope expression from static cytometry data: principles and reproducibility. PLoS One. 2012;7:e30870. doi: 10.1371/journal.pone.0030870. [DOI] [PMC free article] [PubMed] [Google Scholar]
- 80.Celis JE, Madsen P, Nielsen S, Celis A. Nuclear patterns of cyclin (PCNA) antigen distribution subdivide S-phase in cultured cells - some applications of PCNA antibodies. Leuk Res. 1986;10:237–349. doi: 10.1016/0145-2126(86)90021-4. [DOI] [PubMed] [Google Scholar]
- 81.Leonardi E, Girlando S, Serio G, Mauri FA, Perrone G, Scampini S, Dalla Palma P, Barbareschi M. PCNA and Ki67 expression in breast carcinoma: correlations with clinical and biological variables”. J Clin Pathol. 1992;45:416–419. doi: 10.1136/jcp.45.5.416. [DOI] [PMC free article] [PubMed] [Google Scholar]
- 82.Matsushita K, Cha EK, Matsumoto K, Baba S, Chromecki TF, Fajkovic H, Sun M, Karakiewicz PI, Scherr DS, Shariat SF. Immunohistochemical biomarkers for bladder cancer prognosis. Int J Urol. 2011;18:616–629. doi: 10.1111/j.1442-2042.2011.02809.x. [DOI] [PubMed] [Google Scholar]
- 88.Kelman Z. PCNA: structure, functions and interactions. Oncogene. 1997;14:629–640. doi: 10.1038/sj.onc.1200886. [DOI] [PubMed] [Google Scholar]
- 84.Kuriyan J, O'Donnell M. Sliding clamps of DNA polymerases. J Mol Biol. 1993;234:915–925. doi: 10.1006/jmbi.1993.1644. [DOI] [PubMed] [Google Scholar]
- 85.Bowman GD, Goedken ER, Kazmirski SL, O'Donnell M, Kuriyan J. DNA polymerase clamp loaders and DNA recognition. FEBS Lett. 2005;579:863–867. doi: 10.1016/j.febslet.2004.11.038. [DOI] [PubMed] [Google Scholar]
- 86.Mailand N, Gibbs-Seymour I, Bekker-Jensen S. Regulation of PCNA-protein interactions for genome stability. Nature reviews. Molecular cell biology. 2013;14:269–282. doi: 10.1038/nrm3562. [DOI] [PubMed] [Google Scholar]
- 87.Moldovan GL, Pfander B, Jentsch S. PCNA, the maestro of the replication fork. Cell. 2007;129:665–679. doi: 10.1016/j.cell.2007.05.003. [DOI] [PubMed] [Google Scholar]
- 88.Warbrick E. PCNA binding through a conserved motif. BioEssays: news and reviews in molecular, cellular and developmental biology. 1998;20:195–199. doi: 10.1002/(SICI)1521-1878(199803)20:3<195::AID-BIES2>3.0.CO;2-R. [DOI] [PubMed] [Google Scholar]
- 89.Gilljam KM, Feyzi E, Aas PA, Sousa MM, Müller R, Vågbø CB, Catterall TC, Liabakk NB, Slupphaug G, Drabløs F, Krokan HE, Otterlei M. Identification of a novel, widespread, and functionally important PCNA-binding motif. The Journal of Cell Biology. 2009;186:645–654. doi: 10.1083/jcb.200903138. [DOI] [PMC free article] [PubMed] [Google Scholar]
- 90.Mailand N, Gibbs-Seymour I, Bekker-Jensen S. Regulation of PCNA-protein interactions for genome stability. Nature reviews. Molecular cell biology. 2013;14:269–282. doi: 10.1038/nrm3562. [DOI] [PubMed] [Google Scholar]
- 91.Gerdes J, Schwab U, Lemke H, Stein H. Production of a mouse monoclonal antibody reactive with a human nuclear antigen associated with cell proliferation. Int J Cancer. 1983;31:13–20. doi: 10.1002/ijc.2910310104. [DOI] [PubMed] [Google Scholar]
- 92.Bruno S, Darzynkiewicz Z. Cell cycle dependent expression and stability of the nuclear protein detected by Ki-67 antibody in HL-60 cells. Cell Prolif. 1992;25:31–40. doi: 10.1111/j.1365-2184.1992.tb01435.x. [DOI] [PubMed] [Google Scholar]
- 93.Endl E, Gerdes J. The Ki-67 protein: fascinating forms and an unknown function. Exp Cell Res. 2000;257:231–237. doi: 10.1006/excr.2000.4888. [DOI] [PubMed] [Google Scholar]
- 94.Rahmanzadeh R, Huttmann G, Gerdes J, Scholzen T. Chromophore-assisted light inactivation of pKi-67 leads to inhibition of ribosomal RNA synthesis. Cell Prolif. 2007;40:422–430. doi: 10.1111/j.1365-2184.2007.00433.x. [DOI] [PMC free article] [PubMed] [Google Scholar]
- 95.Bullwinkel J, Baron-Luhr B, Ludemann A, Wohlenberg C, Gerdes J, Scholzen T. Ki-67 protein is associated with ribosomal RNA transcription in quiescent and proliferating cells. J Cell Physiol. 2006;206:624–635. doi: 10.1002/jcp.20494. [DOI] [PubMed] [Google Scholar]
- 96.Darzynkiewicz Z, Traganos F, Sharpless T, Melamed MR. Lymphocyte stimulation: a rapid multiparameter analysis. Proc Natl Acad Sci U S A. 1976;73:2881–2824. doi: 10.1073/pnas.73.8.2881. [DOI] [PMC free article] [PubMed] [Google Scholar]
- 97.Darzynkiewicz Z, Sharpless T, Staiano-Coico L, Melamed MR. Subcompartments of the G1 phase of cell cycle detected by flow cytometry. Proc Natl Acad Sci U S A. 1980;77:6696–9. doi: 10.1073/pnas.77.11.6696. [DOI] [PMC free article] [PubMed] [Google Scholar]
- 98.Darzynkiewicz Z, Traganos F, Melamed MR. New cell cycle compartments identified by multiparameter flow cytometry. Cytometry. 1980;1:98–108. doi: 10.1002/cyto.990010203. [DOI] [PubMed] [Google Scholar]
- 99.Darzynkiewicz Z, Crissman H, Traganos F, Steinkamp J. Cell heterogeneity during the cell cycle. J Cell Physiol. 1982;113:465–474. doi: 10.1002/jcp.1041130316. [DOI] [PubMed] [Google Scholar]
- 100.Andreeff M, Darzynkiewicz Z, Sharpless TK, Clarkson BD, Melamed MR. Discrimination of human leukemia subtypes by flow cytometric analysis of cellular DNA and RNA. Blood. 1980;55:282–293. [PubMed] [Google Scholar]
- 101.Darzynkiewicz Z, Evenson DP, Staiano-Coico L, Sharpless TK, Melamed ML. Correlation between cell cycle duration and RNA content. J Cell Physiol. 1979;100:425–438. doi: 10.1002/jcp.1041000306. [DOI] [PubMed] [Google Scholar]
- 102.Darzynkiewicz Z. Cellular RNA content, a feature correlated with cell kinetics and tumor prognosis. Leukemia. 1988;2:777–787. [PubMed] [Google Scholar]
- 103.Frisa PS, Jacobberger JW. Cytometry of chromatin bound Mcm6 and PCNA identifies two states in G1 that are separated functionally by the G1 restriction point. BMC Cell Biol. 2010 Apr 16;11:26. doi: 10.1186/1471-2121-11-26. doi: 10.1186/1471-2121-11-2611: PMID:20398392. [DOI] [PMC free article] [PubMed] [Google Scholar]
- 104.Bruno S, Bauer K, Crissman HA, Darzynkiewicz Z. Changes in cell nuclei during S phase: Progressive chromatin condensation and altered expression of the proliferation-associated nuclear proteins Ki-67, p-105, cyclin/PCNA and p34. Exp Cell Res. 1991;196:99–106. doi: 10.1016/0014-4827(91)90460-c. [DOI] [PubMed] [Google Scholar]
- 105.Gong JP, Traganos F, Darzynkiewicz Z. Discrimination of G2 and mitotic cells by flow cytometry based on different expression of cyclins B1 and A. Exp Cell Res. 1995;220:226–231. doi: 10.1006/excr.1995.1310. [DOI] [PubMed] [Google Scholar]
- 106.Prescott DM, Bender MA, Synthesis of RNA. protein during mitosis in mammalian tissue culture cells. Exp Cell Res. 1963;26:260–68. doi: 10.1016/0014-4827(62)90176-3. [DOI] [PubMed] [Google Scholar]
- 107.Tarnowka MA, Baglioni C. Regulation of protein synthesis in mitotic HeLa cells. J Cell Physiol. 1979;99:353–367. doi: 10.1002/jcp.1040990311. [DOI] [PubMed] [Google Scholar]
- 108.Johansson P, Jeffery J, Al-Ejeh F, Schulz RB, Callen DF, Kumar R, Khanna KK. SCF-FBXO31 E3 ligase targets DNA replication factor Cdt1 for proteolysis in the G2 phase of cell cycle to prevent re-replication. J Biol Chem. 2014;289:18514–18525. doi: 10.1074/jbc.M114.559930. [DOI] [PMC free article] [PubMed] [Google Scholar]
- 109.Chandrasekaran S, Tan TX, Hall JR, Cook JG. Stress-stimulated mitogen-activated protein kinases control the stability and activity of the Cdt1 DNA replication licensing factor. Mol Cell Biol. 2011;31:4405–4416. doi: 10.1128/MCB.06163-11. [DOI] [PMC free article] [PubMed] [Google Scholar]
- 110.Ballabeni A, Park IH, Zhao R, Wang W, Lerou PH, Daley GQ, Kirschner MW. Cell cycle adaptations of embryonic stem cells. Proc Natl Acad Sci U S A. 2011;108:19252–19257. doi: 10.1073/pnas.1116794108. [DOI] [PMC free article] [PubMed] [Google Scholar]
- 111.Wohlschlegel JA, Dwyer BT, Dhar SK, Cvetic C, Walter JC, Dutta A. Inhibition of eukaryotic DNA replication by geminin binding to Cdt1. Science. 2000;290:2309–2312. doi: 10.1126/science.290.5500.2309. [DOI] [PubMed] [Google Scholar]
- 112.Yanow SK, Lygerou Z, Nurse P. Expression of Cdc18/Cdc6 and Cdt1 during G2 phase induces initiation of DNA replication. EMBO J. 2001;20:4648–4656. doi: 10.1093/emboj/20.17.4648. [DOI] [PMC free article] [PubMed] [Google Scholar]
- 113.Matsushita K, Cha EK, Matsumoto K, Baba S, Chromecki TF, Fajkovic H, Sun M, Karakiewicz PI, Scherr DS, Shariat SF. Immunohistochemical biomarkers for bladder cancer prognosis. Int J Urol. 2011;18:616–629. doi: 10.1111/j.1442-2042.2011.02809.x. [DOI] [PubMed] [Google Scholar]
- 114.Marchiò C, Balmativola D, Castiglione R, Annaratone L, Sapino A. Predictive diagnostic pathology in the target therapy era in breast cancer. Curr Drug Targets. 2015 Feb 3; doi: 10.2174/1389450116666150203121218. Epub ahead of print. [DOI] [PubMed] [Google Scholar]
- 115.Stuart-Harris R, Caldas C, Pinder SE, Pharoah P. Proliferation markers and survival in early breast cancer: a systematic review and meta-analysis of 85 studies in 32,825 patients. Breast. 2008;17:323–334. doi: 10.1016/j.breast.2008.02.002. [DOI] [PubMed] [Google Scholar]
- 116.Santala S, Talvensaari-Mattila A, Soini Y, Honkavuori-Toivola M, Santala M. High expression of cyclin A is associated with poor prognosis in endometrial endometrioid adenocarcinoma. Tumour Biol. 2014;35:5395–5399. doi: 10.1007/s13277-014-1703-9. [DOI] [PubMed] [Google Scholar]
- 117.Gopinathan L, Tan SL, Padmakumar VC, Coppola V, Tessarollo L, Kaldis P. Loss of Cdk2 and cyclin A2 impairs cell proliferation and tumorigenesis. Cancer Res. 2014;74:3870–3879. doi: 10.1158/0008-5472.CAN-13-3440. [DOI] [PMC free article] [PubMed] [Google Scholar]
- 118.Jernman J, Välimäki MJ, Hagström J, Louhimo J, Haapasalo H, Arola J, Haglund C. Cyclin A predicts metastatic potential of rectal neuroendocrine tumors. Hum Pathol. 2014;45:1605–1609. doi: 10.1016/j.humpath.2014.03.012. [DOI] [PubMed] [Google Scholar]
- 119.Klintman M, Strand C, Ahlin C, Beglerbegovic S, Fjällskog ML, Grabau D, Gudlaugsson E, Janssen EA, Lövgren K, Skaland I, Bendahl PO, Malmström P, Baak JP, Fernö M. The prognostic value of mitotic activity index (MAI), phosphohistone H3 (PPH3), cyclin B1, cyclin A, and Ki67, alone and in combinations, in node-negative premenopausal breast cancer. PLoS One. 2013;8:e81902. doi: 10.1371/journal.pone.0081902. [DOI] [PMC free article] [PubMed] [Google Scholar]
- 120.Huang L, Ren F, Tang R, Feng Z, Chen G. Prognostic value of expression of cyclin E in gastrointestinal cancer: A systematic review and meta-analysis. Technol Cancer Res Treat. 2015 Jan 26;:pii. doi: 10.1177/1533034614568098. 1533034614568098. [Epub ahead of print] [DOI] [PubMed] [Google Scholar]
- 121.Alsina M, Landolfi S, Aura C, Caci K, Jimenez J, Prudkin L, Castro S, Moreno D, Navalpotro B, Tabernero J, Scaltriti M. Cyclin E amplification/overexpression is associated with poor prognosis in gastric cancer. Ann Oncol. 2015;26:438–439. doi: 10.1093/annonc/mdu535. [DOI] [PubMed] [Google Scholar]
- 122.Gao S, Ma JJ, Lu C. Prognostic value of cyclin E expression in breast cancer: a meta-analysis. Tumour Biol. 2013;34:3423–3430. doi: 10.1007/s13277-013-0915-8. [DOI] [PubMed] [Google Scholar]
- 123.Gong JP, Ardelt B, Traganos F, Darzynkiewicz Z. Unscheduled expression of cyclin B1 and cyclin E in several leukemic and solid tumor cell lines. Cancer Res. 1994;54:4285–4288. [PubMed] [Google Scholar]
- 124.Sangfelt O, Cepeda D, Malyukova A, van Drogen F, Reed SI. Both SCF(Cdc4alpha) and SCF(Cdc4gamma) are required for cyclin E turnover in cell lines that do not overexpress cyclin E. Cell Cycle. 2008;7:1075–1082. doi: 10.4161/cc.7.8.5648. [DOI] [PubMed] [Google Scholar]
- 125.Stead E, White J, Faast R, Conn S, Goldstone S, Rathjen J, Dhingra U, Rathjen P, Walker D, Dalton S. Pluripotent cell division cycles are driven by ectopic Cdk2, cyclin A/E and E2F activities. Oncogene. 2002;21:8320–8333. doi: 10.1038/sj.onc.1206015. [DOI] [PubMed] [Google Scholar]
- 126.Wheeler LW, Lents NH, Baldassare JJ. Cyclin A-CDK activity during G1 phase impairs MCM chromatin loading and inhibits DNA synthesis in mammalian cells. Cell Cycle. 2008;7:2179–2188. doi: 10.4161/cc.7.14.6270. [DOI] [PubMed] [Google Scholar]
- 127.Katsuno Y, Suzuki A, Sugimura K, Okumura K, Zineldeen DH, Shimada M, Niida H, Mizuno T, Hanaoka F, Nakanishi M. Cyclin A-Cdk1 regulates the origin firing program in mammalian cells. Proc Natl Acad Sci U S A. 2009;106:3184–3189. doi: 10.1073/pnas.0809350106. [DOI] [PMC free article] [PubMed] [Google Scholar]
- 128.Frum R, Ramamoorthy M, Mohanraj L, Deb S, Deb SP. MDM2 controls the timely expression of cyclin A to regulate the cell cycle. Mol Cancer Res. 2009;7:1253–1267. doi: 10.1158/1541-7786.MCR-08-0334. [DOI] [PubMed] [Google Scholar]
- 129.Kirkpatrick P. Technology: Specificity concerns with antibodies for receptor mapping. Nat Rev Drug Discov. 2009;8(4):278. doi: 10.1038/nrd2854. [DOI] [PubMed] [Google Scholar]
- 130.Faaber P, Rijke TP, van de Putte LB, Capel PJ, Berden JH. Cross-reactivity of human and murine anti-DNA antibodies with heparan sulfate. The major glycosaminoglycan in glomerular basement membranes. J Clin Invest. 1986;77:1824–30. doi: 10.1172/JCI112508. [DOI] [PMC free article] [PubMed] [Google Scholar]
- 131.Monici M. Cell and tissue autofluorescence research and diagnostic applications. Biotechnology Annu Rev. 2005;11:227–256. doi: 10.1016/S1387-2656(05)11007-2. [DOI] [PubMed] [Google Scholar]
- 132.Voorhout WF, Leunissen-Bijvelt JJ, Leunissen JLM M, Verkleij AJ. Steric hindrance in immunolabelling. J Microscopy. 1986;141:303–310. doi: 10.1111/j.1365-2818.1986.tb02724.x. [DOI] [PubMed] [Google Scholar]
- 133.Bruno S, Gorczyca W, Darzynkiewicz Z. The effect of ionic strength in immunocytochemical detection of the proliferation associated nuclear antigens p120, PCNA and the protein reacting with Ki-67 antibody. Cytometry. 1992;13:496–501. doi: 10.1002/cyto.990130508. [DOI] [PubMed] [Google Scholar]
- 134.Kurki P, Vanderlaan M, Dolbeare F, Gray J, Tan EM. Expression of proliferating cell nuclear antigen (PCNA)/cyclin during the cell cycle. Exp Cell Res. 1986;166:209–219. doi: 10.1016/0014-4827(86)90520-3. [DOI] [PubMed] [Google Scholar]
- 135.Sasaki K, Kurose A, Ishida Y. Flow cytometric analysis of the expression of PCNA during the cell cycle in HeLa cells and effects of the inhibition of DNA synthesis on it. Cytometry. 1993;14:876–882. doi: 10.1002/cyto.990140805. [DOI] [PubMed] [Google Scholar]
- 136.Landberg G, Ross G. Flow cytometric analysis of proliferation associated nuclear antigen using washless staining of unfixed cells. Cytometry. 1992;13:230–240. doi: 10.1002/cyto.990130304. [DOI] [PubMed] [Google Scholar]