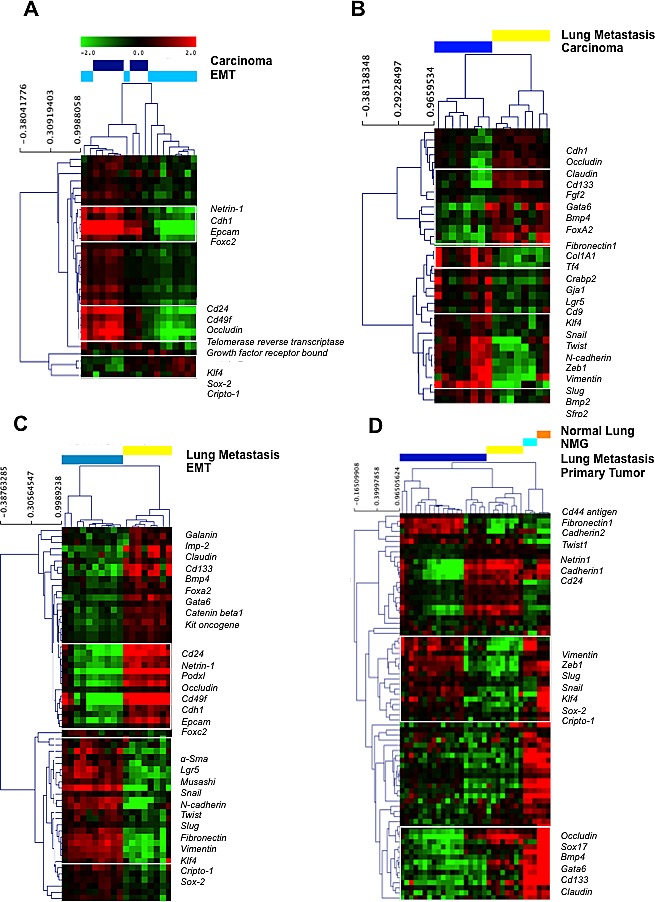
Figure 3. Gene expression profiles of laser capture microdissected tumor progression samples through unsupervised hierarchical clustering.

Primary tumor adenocarcinoma versus EMT-like areas; B. Primary tumor adenocarcinoma versus lung metastasis; C. Primary tumor EMT-like areas versus lung metastasis; D. Primary tumor, lung metastasis, normal mammary gland and normal lung parenchyma. Each row represents a single gene and each column a single sample. The red color indicates up-regulation, the green color indicates down-regulation, and the black color indicates no change in expression level compared with the reference sample. The gray color indicates that no intensity was detected. EMT: epithelial-to-mesenchymal transition.
