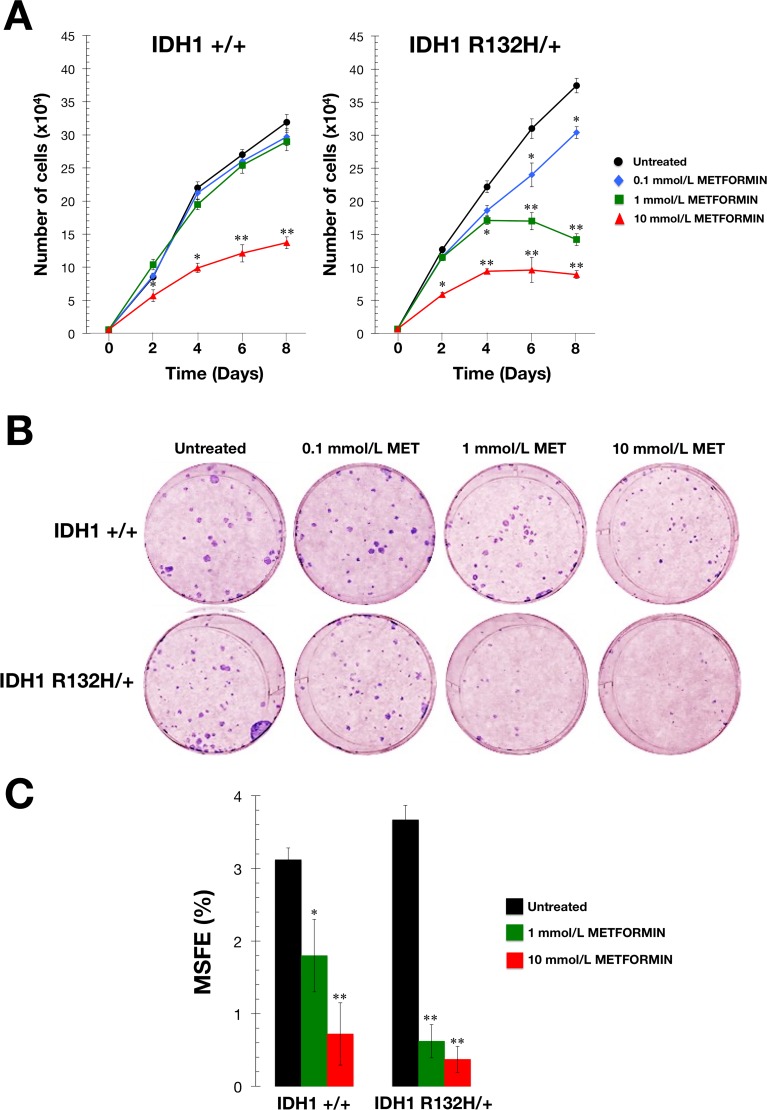
Figure 3. Metformin-hypersensitive phenotype of IDH1 mutant cells.
A. Cell proliferation assay. IDH1+/+ and R132H/+ cells were plated in 24-well plates at a density of 5000 cells/well and cultured in standard medium in the absence or presence of graded concentrations of metformin as specified. The data presented are the mean of cell number x 104/well and SD (bars) from two independent experiments performed in triplicate and obtained after 0, 2, 4, 6, and 8 days. *P < 0.05; **P < 0.01 versus the corresponding controls. B. Clonogenic assay. Representative micrographs of crystal violet-stained colonies from IDH1+/+ and R132H/+ cells pulsed with vehicle or graded concentrations of metformin for 48 h and seeded at clonal density. C. Mammosphere forming assay. MSFE of IDH1+/+ and R132H/+ cells was calculated as the number of mammospheres (diameter >50 μm) formed after 7 days, divided by the original number of cells seeded and expressed as percentage mean (columns) ± SD (bars). Re-feeding of mammospheres cultures with metformin and/or sphere medium was performed on days 3 and 5. *P < 0.05; **P < 0.01 versus the corresponding controls.

