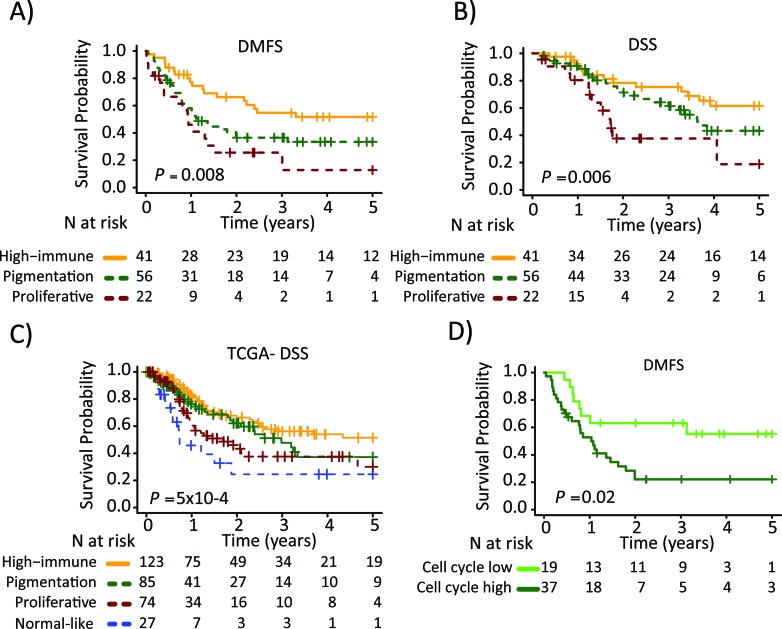
Figure 3. Survival analysis of metastatic melanomas stratified by gene expression phenotype using the Kaplan-Meier estimator to determine.
A) Distant metastasis free survival (DMFS) and B) and disease specific survival (DSS). C) Metastatic tumors from the TCGA data were stratified and Kaplan-Meier analysis was performed. D) Pigmentation-classified tumors were stratified by the cell cycle module (low or high). Survival differences between low and high groups were estimated using Kaplan-Meier analysis. P-values have been calculated using the log-rank test.

