

Abstract
Multiple sclerosis (MS), a common neurodegenerative disease of the CNS, is characterized by the loss of oligodendrocytes and demyelination. TNFα, a proinflammatory cytokine implicated in MS, can activate necroptosis, a necrotic cell death pathway regulated by RIPK1 and RIPK3 under caspase-8 deficient conditions. Here, we demonstrate defective caspase-8 activation, as well as, activation of RIPK1, RIPK3 and MLKL, the hallmark mediators of necroptosis, in the cortical lesions of human MS pathological samples. Furthermore, we show that MS pathological samples are characterized by an increased insoluble proteome in common with other neurodegenerative diseases such as AD, PD and HD. Finally, we show that necroptosis mediates oligodendrocyte degeneration induced by TNFα, and inhibition of RIPK1 protects against oligodendrocyte cell death in two animal models of MS and in culture. Our findings demonstrate that necroptosis is involved in MS and suggest that targeting RIPK1 may represent a novel therapeutic strategy for MS.
Introduction
Multiple sclerosis (MS) leads to focal inflammatory demyelination in the brain and spinal cord white matter and axonal degeneration. Although MS has been studied extensively (Buck and Hemmer, 2011), the mechanism underlying oligodendrocyte death is unclear. Preventing oligodendrocyte death may block myelin loss and inhibit axonal degeneration, the major cause of irreversible neurological disability in MS patients (Trapp and Nave, 2008).
TNFα, an important proinflammatory cytokine, is elevated in active lesions and in the serum and cerebrospinal fluid (CSF) of MS patients, and is correlated with the severity of the lesions and MS disease progression (Sharief and Hentges, 1991). TNFα-induced oligodendrocyte death resembles necrosis morphologically, and without caspase activation (Jurewicz et al., 2005; Selmaj and Raine, 1988); however, the mechanism by which this process occurs is unclear. RIPK1, a death-domain containing kinase, is a master mediator of TNFR1 signaling upon activation by TNFα (Ofengeim and Yuan, 2013). Downstream of TNFR1, the activation of caspase-8 is negatively regulated by the cellular FLICE-inhibitory protein cFLIPL (Krueger et al., 2001). Caspase-8 regulated apoptosis has an antagonistic relationship with RIPK1 regulated necroptosis; in the absence of caspase-8, the kinase activity of RIPK1 mediates necroptosis (Degterev et al., 2005; Holler et al., 2000; Kaiser et al., 2011; Kawahara et al., 1998; Oberst et al., 2011; Zhang et al., 2011a). Under apoptosis deficient conditions, RIPK1 interacts with RIPK3 to induce its phosphorylation and form a RIPK1/RIPK3 containing complex, known as complex IIb, which is critical for the induction of necroptosis (Cho et al., 2009; He et al., 2009). Activated RIPK3, in turn, phosphorylates MLKL, a pseudo-kinase thereby inducing its oligomerization and insertion into the plasma membrane, leading to the initiation of necrosis (Cai et al., 2014; Sun et al., 2012; Wang et al., 2014). Therefore, inhibition of RIPK1 kinase activity blocks necroptosis induced by TNFα by inhibiting its interaction with RIPK3 (Cho et al., 2009). Since RIPK1 can be recruited to TNFR1, but not TNFR2, inhibition of RIPK1 kinase activity offers a strategy to selectively inhibit a subset of key deleterious signaling events downstream of TNFR1.
In this manuscript, we provide evidence for the defective activation of caspase-8, as well as multiple hallmarks of necroptosis activation in human MS pathological specimens. Furthermore, we identified an increase in proteins associated with the insoluble proteome in MS patient samples – a significant portion of these proteins were found in Lewy bodies from patient pathological brain samples with Parkinson’s Disease (PD). Using two animal models of MS, we show that inhibiting necroptosis protects oligodendrocytes. Finally, we demonstrate that TNFα induces necroptosis of oligodendrocyte death in vitro. Our data suggest that necroptosis is involved in the pathology associated with MS and targeting necroptosis may provide an oligodendrocyte protective strategy for therapeutic intervention in this disease.
Results
Dysregulation of the cell death machinery in MS lesions
To explore the involvement of apoptosis and necroptosis in MS, we characterized the activation profile of caspase-8. Unexpectedly, compared to that of age-matched controls, tissue samples from cortical lesions of the MS patients showed a reduction in the levels of active 18 kDa caspase-8 subunit and a corresponding elevation in the levels of full length and partially processed p43 kDa caspase-8 subunit, the hallmarks of defective caspase-8 activation (Figure 1A; Table S1). Consistently, caspase-8 specific activity was lower in tissue lysates from the MS pathological brain samples when compared to that of the control brains (Figure 1B). Since in the CNS, caspase-8 is predominantly expressed in the microglial lineage, but not in oligodendrocytes (Zhang et al., 2014) and defects in caspase-8 activation have been implicated in promoting inflammation by engaging the necroptotic machinery (Wallach et al., 2014), our data suggest that there might be a defect of caspase-8 activity in microglia in MS cortical lesions which promotes inflammation mediated by key mediators of necroptosis.
Figure 1. Dysregulation of the apoptotic and necroptotic machinery in cortical white matter lesions of MS patients.
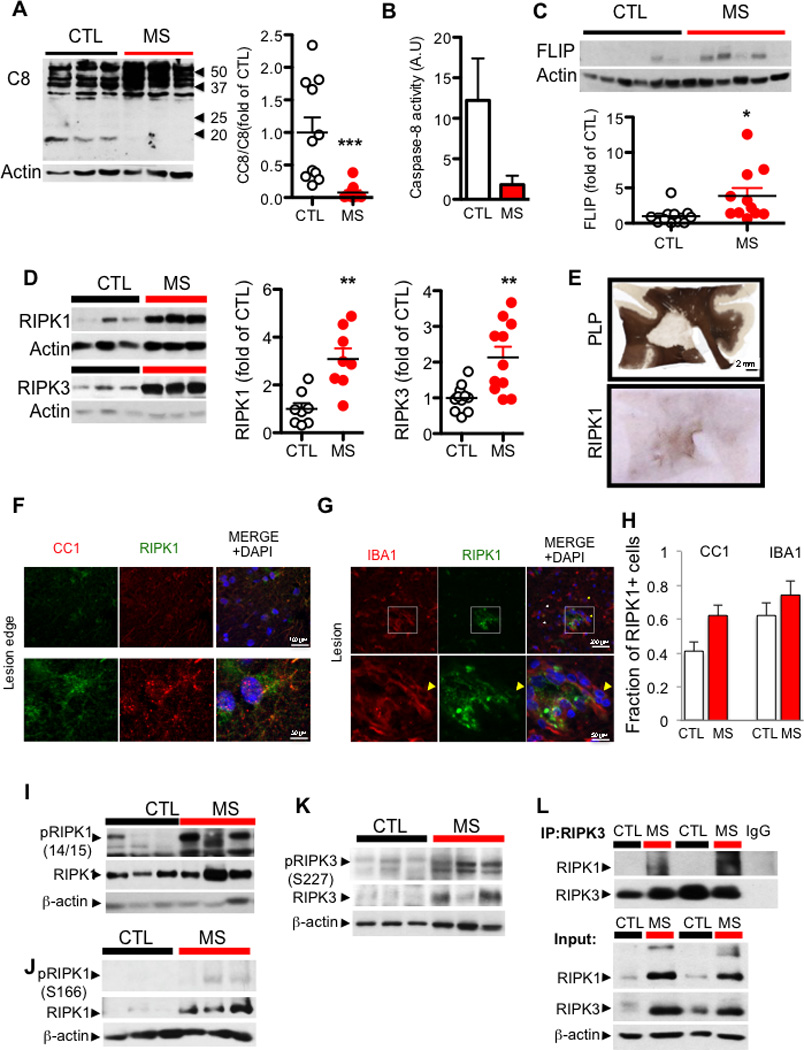
(A) Western blotting analysis and quantifications of brain lysates from 11 control and 11 white matter lesions of MS cases probed with antibodies against caspase-8 and β-actin. The quantification is shown as bar graphs to the right. Data are represented as the normalized means ± SEM, n=11 replicates per group (*p<0.05, **p<0.01, ***p<0.001). (B) The caspase-8 specific activity (arbitrary units/ µg of brain tissue) was assessed in cell lysates from control and MS tissue. (C) Representative western blot analyses and quantifications of samples from 11 control and 11 white matter lesions of MS cases probed with antibodies against c-FLIP and β-actin. The quantification is shown as bar graphs at the bottom. Data are represented as the normalized means ± SEM, n=11 replicates per group (*p<0.05, **p<0.01, ***p<0.001). (D) Western blotting analysis of control and MS white matter lesion tissues for RIPK1 and RIPK3 levels in urea soluble fraction from 3 control and 4 MS patients (left). The bar graphs on the right quantified western blotting data from 11 control and 11 MS cases probed with antibodies against RIPK1 and RIPK3 and normalized to actin loading control. Data are represented as the normalized means ± SEM, n=11 replicates per group (**p<0.01). (E) PLP and RIPK1 immunostaining of a large MS lesion within the cortical white matter from a patient with primary progressive MS which showed strong reactivity for RIPK1 of all the tissues examined. (F) Immunostaining using anti-RIPK1 and CC1 antibody, an oligodendrocyte marker (upper panels). Higher magnification images of a CC1+ cell with RIPK1 expression (lower panels). (G) Immunostaining using anti-RIPK1 and IBA1 within the lesion (top panels); lower panels show higher magnification images highlighted in the white square. (H) Quantifications of RIPK1+ oligodendrocytes and microglia in normal white matter (CTL) tissues and in MS lesions (MS) were shown as bar graphs to the right. Data are represented as the normalized means ± SEM, n=4–6 images per group replicates per group. (I) A western blot of the urea soluble fraction from control and MS samples probed with antibodies against phospho-RIPK1 serine 166, total RIPK1, and β-actin. (J) A western blot of the urea soluble fraction from control and MS samples probed with antibodies against phospho-RIPK1 serine 14/15, total RIPK1 and β-actin. (K) A western blot of the urea soluble fraction from control and MS samples probed with antibodies against phospho-RIPK3 serine 227, total RIPK3, and β-actin. (L) The lysates from control and MS brain samples were immunoprecipitated with antibody against RIPK3 followed by western blotting analysis with antibodies against RIPK1 and RIPK3 (top); the input whole cell lysates were probed with the same antibodies, as well as β-actin.
In contrast, we found that the expression of cFLIPL was significantly elevated in the MS samples (Figure 1C; Table S1). cFLIPL is expressed in many cell types including microglia, OPCs and mature oligodendrocytes, but not neurons, in the CNS (Zhang et al., 2014). Since cFLIPL is permissive for the initial processing of pro-caspase-8 into the p43 subunit but blocks the full activation of caspase-8 and the production of p18 (Krueger et al., 2001), the elevated levels of cFLIPL suggest a possible mechanism by which caspase-8 activation may be inhibited in MS.
To examine the possible role of necroptosis in the pathogenesis of MS patients, we compared a microarray study of MS patient samples (Mycko et al., 2004) on the up-regulated genes in chronic active lesions versus inactive lesions with the hits from our siRNA screen for regulators of necroptosis (Hitomi et al., 2008). Interestingly, we found that ∼49% (20 of 41) of genes that were up-regulated in chronic active lesions were also identified as regulators of necroptosis (Table S2). This analysis identified both positive and negative modulators of necroptosis differentially regulated in the MS lesions, suggesting that both degenerative and protective processes are activated in MS, consistent with the double-edged sword effect of TNFα in this disease.
We characterized the expression and biochemical characteristics of key mediators of necroptosis, including RIPK1, RIPK3 and MLKL, in the brain tissues from control and MS patients. We found that in tissue samples extracted with mild detergent (Triton X-100/SDS), the levels of RIPK1 and RIPK3 proteins were slightly increased in the MS samples (Figure S1A–B & Table S1). Strikingly, the predominant portion of RIPK1 and RIPK3 in MS cortical lesions was extractable only by strong detergent conditions (8M urea) (Figure 1D; 8 of 9 MS for RIPK1; 9 of 11 MS for RIPK3). We next characterized the cells expressing RIPK1 in lesions and peri-lesions from fixed MS samples by immunostaining. We found that the expression of RIPK1 was increased in the cortical lesions and identified a subset of cells positive for both RIPK1 and CC1 or R461 (He et al., 2004), markers for mature oligodendrocytes, as well as cells that were positive for both RIPK1 and IBA1, a marker for microglia (Figure 1E–H; Figure S1C–D). Thus, both oligodendrocytes and microglia express RIPK1.
Phosphorylation of RIPK1 and RIPK3 has been recognized as another set of hallmarks for the activation of necroptosis (Jouan-Lanhouet et al., 2014). We characterized an antibody specifically recognizing phospho-S14/15 of human and mouse RIPK1 (Figure S2A–D). In addition, an antibody against phospho-S166 of human RIPK1, a known RIPK1 autophosphorylation site (Degterev et al., 2008), was developed as a marker for its activation (Berger et al., 2014). We confirmed that S166 of RIPK1 was phosphorylated upon the activation of necroptosis and that the phosphorylation was inhibited by 7N-1 (Figure S2E–F). Using these two phospho-RIPK1 specific antibodies, we found that the increased levels of RIPK1 in the MS brain samples were associated with an elevation of both S14/15 and S166 phosphorylation (Figure 1I–J). In addition, using an antibody against phospho-S227 of RIPK3, a marker for its activation (Sun et al., 2012) (Figure S2F), we found that the phosphorylation of RIPK3 was also markedly increased in the MS brain samples compared to that of the control brains (Figure 1K). Activated RIPK1 and RIPK3 interact to form complex IIb in necroptosis (Cho et al., 2009; He et al., 2009); interestingly, we detected the interaction of RIPK1 and RIPK3 in the MS, but not the control, human samples (Figure 1L). Thus, RIPK1 and RIPK3, two key mediators of necroptosis, are enriched in an activated state and interact in the cortical lesions in MS patients.
To evaluate whether MLKL, a key executioner of necroptosis, is also engaged in MS, we examined the phosphorylation of T358 in MLKL, a critical event mediated by RIPK3 that induces the oligomerization and activation of MLKL in the execution of necroptosis (Wang et al., 2014) (Figure S2F). While little reactivity against anti-phospho-T358 was observed in the control tissues (Figure S2G), robust reactivity for anti-phospho-T358 MLKL was detected in the MS associated cortical lesions by both immunostaining and western blot analysis (Figure 2A–B). In addition, we found that a substantially increased amount of higher molecular weight phospho-MLKL in the MS pathological samples, compared to that of control (Figure 2C). Since the oligomerization of MLKL constitutes a key execution step for necroptosis which leads to the disruption of the plasma membrane (Cai et al., 2014; Chen et al., 2014; Dondelinger et al., 2014; Jouan-Lanhouet et al., 2014; Wang et al., 2014), we further characterized the state of MLKL in the control and the MS brain samples using size-exclusion chromatography. Interestingly, we found that while the majority of MLKL in control tissues was eluted close to its predicted molecular weight (∼55kDa), the predominant peak of MLKL in the MS pathological samples was eluted as high-molecular weight complexes above 250 kDa (Figure 2D), suggesting that MLKL is activated in MS. Consistent with a CNS transcriptome study (Zhang et al., 2014), we found that MLKL is expressed in CC1+ oligodendrocytes, but less in IBA1+ microglia (Figure 2E–F; Figure S2H). Taken together, these data demonstrate the biochemical characteristics of RIPK1, RIPK3 and MLKL activation in human MS pathological specimen and suggest an active engagement of necroptosis in MS.
Figure 2. Activation of MLKL in cortical white matter lesions of MS patients.
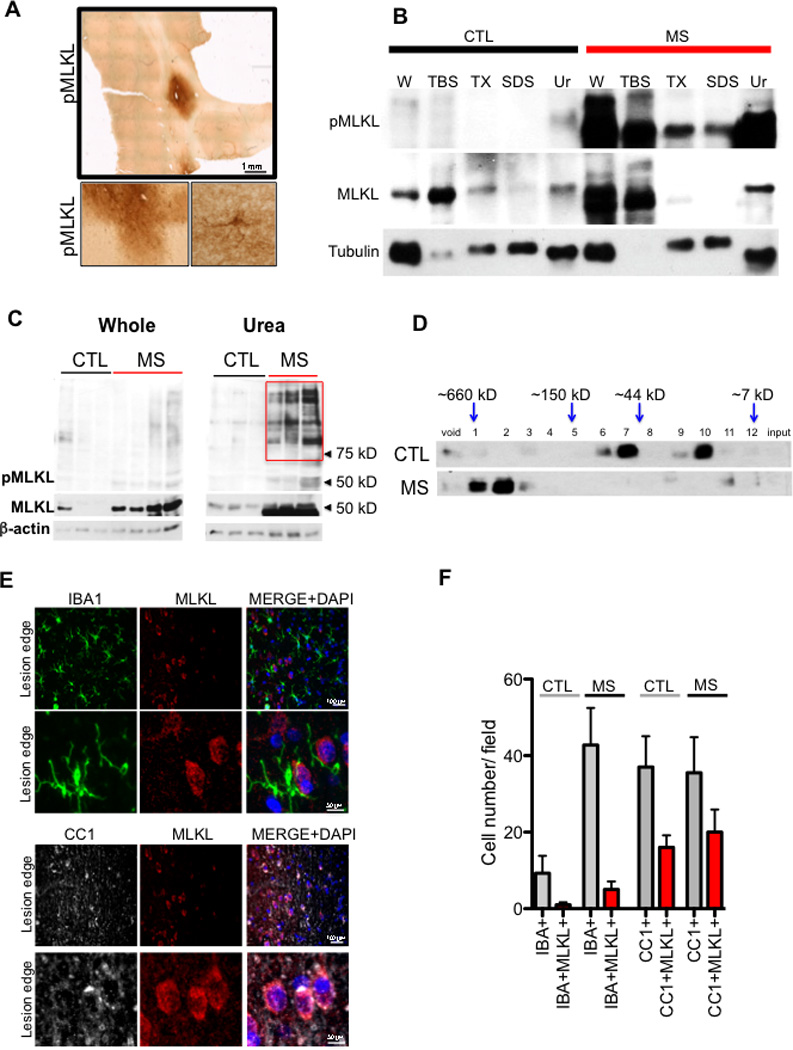
(A) phospho-MLKL immunostaining in the cortical white matter lesion from a post mortem MS sample. Higher magnification images are shown below. (B) A sequential solubility analysis of MLKL from a control and a white matter lesion of a MS patient. The fractions – TBS soluble (TBS), 1% Triton soluble (TX), 2% SDS soluble (SDS) and 8M urea soluble (Ur). (C) A western blot of the whole cell lysate (left) and 8M urea soluble fraction (right) from control and MS samples probed with antibodies against phospho-MLKL, total MLKL, and β-actin. The red box in the urea fraction depicts higher molecular weight pMLKL+ bands found in the urea fraction of MS samples. (D) Brain lysates from 3 control individuals and 3 MS patients were subjected to fractionation using size exclusion column chromatography and the fractions were then analyzed by western blotting using anti-MLKL. (E-F) Immunostaining of MS cortical lesions using anti-MLKL, CC1 and IBA1 antibodies (E). A quantification of the cells that are positive for both IBA1/MLKL and CC1/MLKL (F). Higher magnification images of IBA1+ cells that lack of MLKL reactivity and CC1+ cells that show MLKL reactivity (lower panels on both IBA1 and CC1 immunostaining).
Protein misfolding and activation of RIPK3 in MS
Since proteins in the amyloid state, such as in β-amyloid plaques associated with Alzheimer’s disease (AD), can typically only be extracted by strong detergent/formic acid (Arai et al., 2006), the enrichment of RIPK1 in the insoluble fractions of MS brain suggests the possibility that RIPK1 might exist in an oligomeric amyloid conformation. To directly test this possibility, we next performed a rigorous sequential multi-step sarkosyl extraction protocol (Arai et al., 2006), which was used to extract amyloid plaques and neurofibrillary tangles in AD, to examine the distribution of RIPK1 in brain tissues from control and MS samples. While the majority of RIPK1 was easily extractable in TBS buffer alone or gentle detergent in control samples, a large fraction of RIPK1 could only be extracted by strong detergents or formic acid in the cortical lesions of MS patients (Figure 3A). These data suggest the possibility that RIPK1 in MS exists in an amyloid-like conformation.
Figure 3. An increased insoluble proteomes in MS.
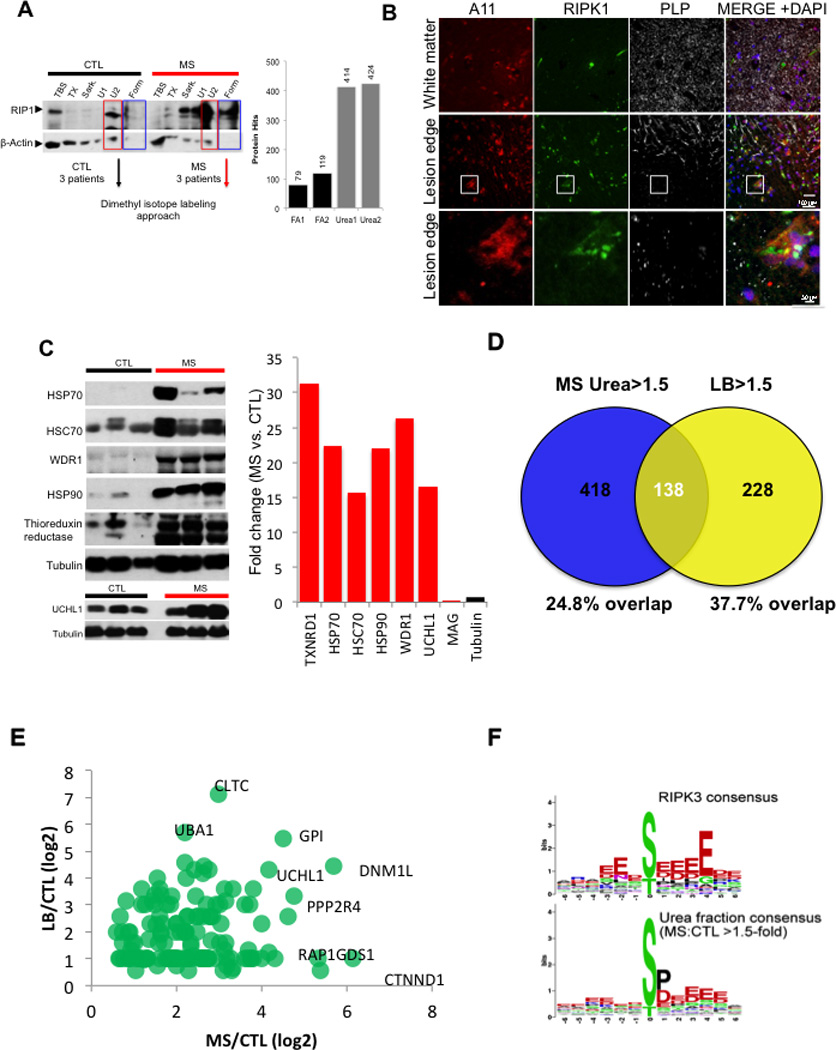
(A) A sequential solubility analysis of RIPK1 in brain lysates from 3 control individuals and 3 MS patients. The fractions – TBS soluble (TBS), 1% Triton soluble (TX), 1% sarkosyl soluble (Sark), 8M urea soluble (U1), 2% SDS soluble (U2) and 70% formic acid soluble (Form). Full length RIPK1 is ∼75 kDa. Combined samples from 3 MS patients and 3 control individuals extracted with 8M urea were used for quantitative mass spectrometry analysis. (B) Immunostaining using anti-A11, RIPK1 and PLP at the lesion edge (top panels); lower panels show higher magnification images highlighted in the white square. (C) Western blotting analysis of the crude insoluble fraction from control and MS samples used to confirm the quantitative data obtained using mass spectrometry; the data in the bar graph is the average fold of enrichment of proteins identified by proteomic analysis in 8M urea fractions in MS vs. control samples. (D-E) Proteins enriched at least 1.5 fold in urea fraction of MS samples in common with the proteins associated with Lewy body in PD. The percentage of overlap (D) and a scatter plot of the common hits between MS and Lewy body in PD (E). (F) Consensus of proteins phosphorylated in MS is similar to the consensus of RIP3K substrates. Phosphopeptides increased by >1.5-fold in MS urea fraction compared to control urea fraction were analyzed by WebLogo software (http://weblogo.berkeley.edu/) to generate the consensus graph of urea soluble phosphoproteome. RIPK3 substrate consensus was obtained from PhosphoNetworks (http://www.phosphonetworks.org/).
Since proteins in an oligomerized amyloid-like state are known to have the capability to act as seeds to induce additional protein oligomerization (Holmes et al., 2014; Luk et al., 2009; Spirig et al., 2014), we next examined a possible reorganization of the total insoluble proteome in MS. We first used A11, an antibody that can recognize amyloid proteins in heterologous systems (Kayed et al., 2007; Kayed et al., 2003; Shorter and Lindquist, 2004) to perform immunostaining in sections of cortical lesions from MS patients with anti-RIPK1. Interestingly, we found that these lesions contained a significant number of A11+ cells that were also positive for RIPK1 (Figure 3B). In addition, we performed an unbiased quantitative proteomic analysis of proteins enriched in MS pathological samples in both the urea soluble and formic acid soluble fractions by mass spectrometry (Figure 3A). Using dimethyl isotope labeling approach, we identified 141 proteins differentially enriched in the formic acid soluble fraction and 552 proteins enriched greater than 1.5-fold in the urea soluble fraction of the MS patients tissue samples as compared to the control tissue (Table S3). Consistent with a general demyelination in MS, we observed a reduction of myelin proteins as assesses by mass spectrometry analysis (Figure S2I). In addition, a targeted mass spectrometry analysis identified RIPK1 and RIPK3 in MS but not in control samples. We confirmed several hits identified in the proteomic analysis using western blotting and demonstrated an enrichment of chaperone proteins and thioreduxin reductase as well as UCHL1, a protein known to be involved in the pathogenesis of PD, in the insoluble proteome of MS samples (Figure 3C).
Interestingly, a bioinformatic analysis of the proteins enriched in the urea fraction of MS patients found that of the 418 unique proteins identified in both urea fraction, 138 proteins were also found in a mass spectrometry data set of 366 proteins (∼37.7% overlap) associated with Lewy bodies (LB) in Parkinson’s diseases, a classical example of inclusion/amyloid in neurodegenerative disease (Figure 3D; Table S4). The fold changes for the common hits between MS/CTL insoluble fraction dataset and LB/CTL insoluble dataset were plotted in a scatter plot (Figure 3E). The list of proteins shared between the insoluble proteome of MS and Lewy bodies of PD include proteins that are localized in the cytoplasmic, but not nuclear, compartment and involved in multiple intracellular processes including mediating protein and vesicular trafficking, cytoskeletal organization and macromolecular protein assembly (data not shown). Furthermore, some of them (47 hits) have been implicated in the pathogenesis of other neurodegenerative diseases including Alzheimer’s disease (AD), Parkinson’s disease (PD), or Huntington’s disease (HD) (Table S5). These data suggest the existence and possible involvement of protein misfolding in the pathogenesis in MS.
We next examined the global phosphorylation pattern in the insoluble proteome of control and MS samples for additional evidence of the activation of RIPK3. Interestingly, we found a significant increase in phosphorylation events with acidic residues following the phosphorylation sites, consistent with the consensus motif targeted by RIPK3 (Figure 3F; Table S6). Thus, our data suggest that RIPK3 might be activated in MS, which is in accordance with the enticing possibility that necroptosis may mediate oligodendrocyte death in this disease.
Roles of RIPK1 and RIPK3 in oligodendrocyte degeneration and inflammation in cuprizone model
To assess whether RIPK1/RIPK3-dependent signaling is involved in mediating oligodendrocyte degeneration in vivo, we utilized the cuprizone model in which demyelination is mediated by the cytotoxicity of cuprizone on oligodendrocytes (Blakemore, 1972). We found that the motor deficits as well as marked loss of myelin and CC1+ oligodendrocytes in the corpus callosum and microglial activation induced were attenuated in animals treated with 7N-1 (Figure 4A–B; Figure S3A–B). Because a significant portion of oligodendrocyte loss occurs in the third and fourth weeks following cuprizone treatment without significant caspase activation (Arnett et al., 2004; Buschmann et al., 2012; Matsushima and Morell, 2001), we tested whether inhibiting RIPK1 can also preserve motor function in a therapeutic mode of treatment. Within this context, we found that delayed delivery of 7N-1 after dosing with cuprizone for 3 weeks still conferred a protective effect against motor dysfunction (Figure S3C).
Figure 4. Inhibition of RIPK1 kinase protects oligodendrocytes from necroptosis induced by cuprizone in vivo.
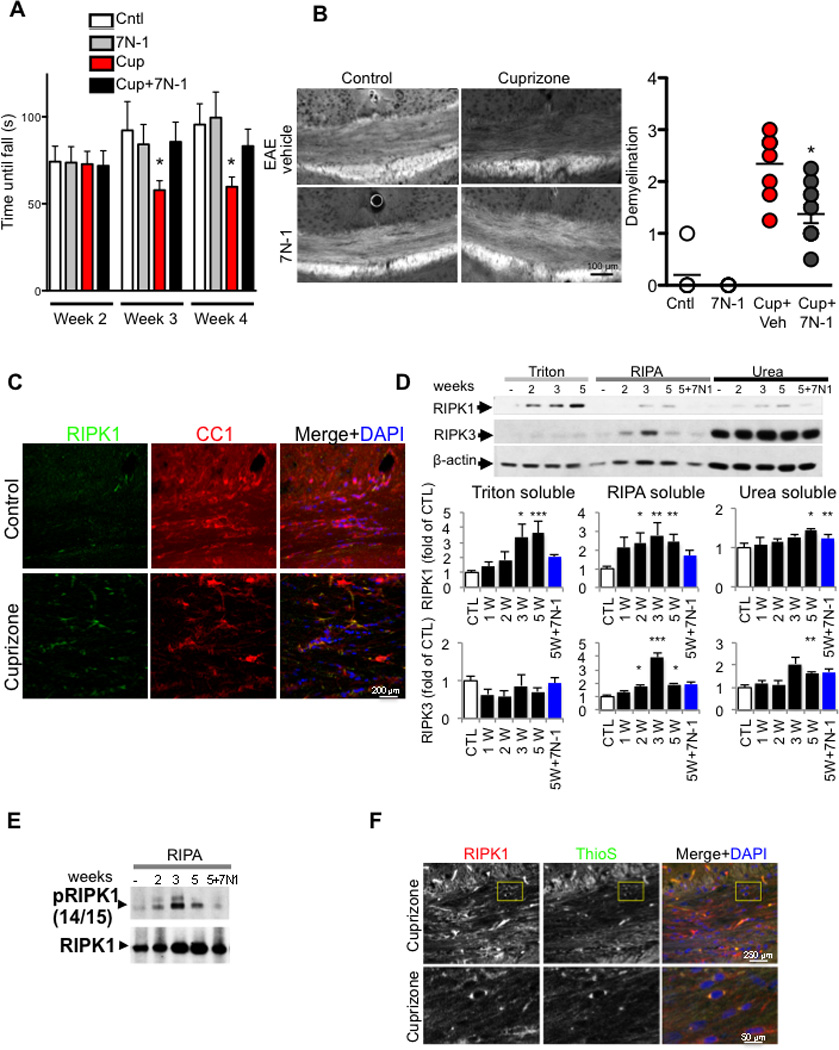
(A) Mice were fed either control or 0.2 % cuprizone containing diet with vehicle or 7N-1 and assessed for motor deficit with rotarod test in double blind manner. The time until mice fell off the rotarod was measured. Data are means ± SEM, n=10–18 per group. (*p<0.05). (B) Representative images of sections from medial corpus callosum show the marked reduction of fluoromyelin fluorescence intensity following 5 weeks of cuprizone treatment. The images were scored in a double blind fashion and quantified for demyelination. Data are means ± SEM, n=5–8 per group. (*p<0.05). (C) Representative images of corpus callosum (CC) sections from control and cuprizone treated animals were immunostained by anti-RIPK1 and CC1, a marker for oligodendrocytes. (D) Mice were fed either control or 0.2 % cuprizone containing diet for the indicated times; CC was microdissected, lysed and sequentially separated as Triton (1%) soluble, RIPA soluble and urea soluble fractions and analyzed by western blot analysis using antibodies against RIPK1 and RIPK3 as indicated and normalized to β-actin. The quantifications were shown as bar graphs below. Data are represented as the normalized means ± SEM, n=5–8 replicates per group (*p<0.05, **p<0.01, ***p<0.001). (E) RIPA soluble fractions from CC of mice after 2, 3, or 5 weeks of cuprizone diet, or 5 weeks of cuprizone diet with 7N-1 were analyzed by western blotting for anti-RIPK1 and anti-p-S14/15 RIPK1. (F) Representative images of sections from medial CC show the increase of RIPK1 reactivity and ThioS staining, in cuprizone treated animals as compared to control treated animals following 5 weeks of cuprizone treatment.
Consistent with the involvement of RIPK1, the number of RIPK1+ cells in the corpus callosum in cuprizone-treated wt mice was significantly increased. The RIPK1 expressing cells include oligodendrocytes (CC1+, NG2+ or Oligo2+), microglia (IBA1+) and astrocytes (GFAP+) (Figure 4C; Figure S3D). Furthermore, we found that the levels of RIPK1 protein were increased in the corpus callosum of mice treated with cuprizone in a time-dependent manner, which was inhibited by 7N-1 (Figure 4D). Cuprizone treatment also led to increased phosphorylation of S14/15 RIPK1, which was inhibited by 7N-1 (Figure 4E). To further characterize the formation of RIPK1 complexes after cuprizone treatment, we immunostained sections of corpus callosum from cuprizone-treated animals with an anti-RIPK1 antibody and thioflavin S (ThioS), a dye that binds to β-sheet-rich structures and is commonly used to visualize the formation of amyloid containing structures (Sanchez et al., 2003). We found that cuprizone treatment led to an increase of ThioS positivity throughout the corpus callosum (Figure S3E). RIPK1+ cells that were also positive for ThioS staining could be seen in cuprizone treated but not control animals (Figure 4F). To examine the presence of oligomeric amyloid-containing structures, we used A11 to immunostain sections containing the corpus callosum from control and cuprizone treated animals. We found that cuprizone treatment led to an enhancement of A11+ inclusions throughout the corpus callosum, which included RIPK1+ cells (Figure S3F–G). Taken together, these data suggest that cuprizone treatment may lead to a generalized cellular or intracellular reorganization that contain amyloid protein structures, which can mediate the activation of RIPK1 and RIPK3 by promoting their association.
To examine the role of RIPK3 in oligodendrocyte cell death in vivo, we tested the susceptibility of RIPK3−/− mice (Newton et al., 2004) to cuprizone-mediated toxicity. Interestingly, RIPK3−/− mice showed increased resistance to cuprizone induced-demyelination and a reduced number of IBA1+ microglia and GFAP+ astrocytes and an improvement in motor function compared to that of wild-type mice (Figure 5A–C). Consistently, we also observed a protection of the normal ultrastructural features in the corpus callosum of cuprizone-treated RIPK3−/− mice including more myelinated axons with a better g-ratio than that of wild-type mice treated with cuprizone (Figure 5D). Furthermore, the induction of RIPK1 and translocation of RIPK1 into the insoluble fraction was significantly reduced in RIPK3−/− mice (Figure S3H). Since both inhibition of RIPK1 kinase by 7N-1 and RIPK3 deficiency can block demyelination, motor dysfunction, and microglial activation mediated by cuprizone, we conclude that RIPK1-RIPK3 dependent necroptosis contributes to oligodendrocyte degeneration and inflammation in vivo.
Figure 5. RIPK3 deficiency protects against demyelination in the corpus callosum after cuprizone treatment.
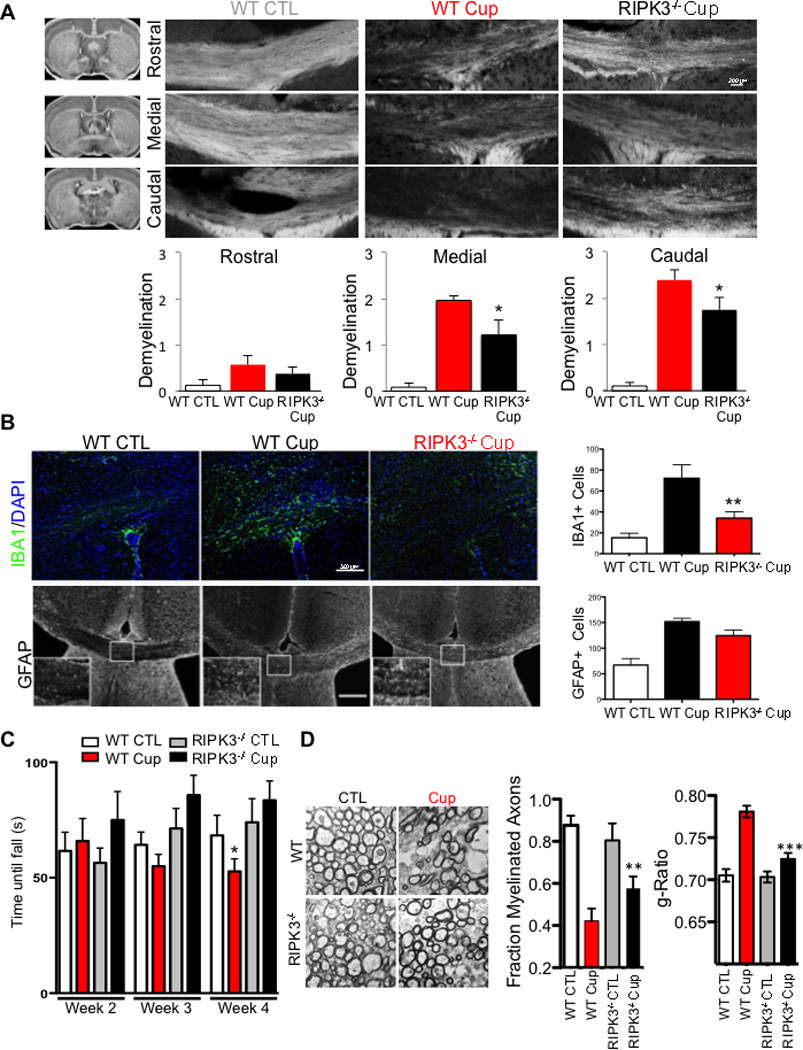
(A) Wild-type or RIPK3−/− mice were fed a normal diet with or without 0.2% cuprizone for 5 weeks to induce demyelination. Coronal sections were stained for myelin with fluoromyelin at rostral, medial and caudal parts of the CC, as indicated to the right of the images with a diagram from the Mouse Brain Library. The images were scored in a double blind fashion and quantified for demyelination. Data are means ± SEM, n=11–14 per group. (B) Coronal sections were stained with antibodies against the microglial marker IBA1 and the astrocyte marker GFAP. The amount of IBA1- and GFAP-positive cells/100 µm2 in the CC was quantified (Data are means ± SEM, n=5–6 per group). (C) Mice were fed either control diet or 0.2% cuprizone containing diet with vehicle or 7N-1 administration and assessed for motor deficit on the rotarod test in double blind manner. The time until mice fell off the rotarod was measured. Data are means ± SEM, n=10–12 per group (*p<0.05). (D) Ultrastructure of myelination in the CC was examined using electron microscopy. Representative images from WT and RIPK3−/− in both control and cuprizone treated groups are shown. Both the number of myelinated axons and the g-ratio of myelinated axons are quantified. n=2 animals per group, 30 images per animals and ∼200 axons quantified; data are means ± SEM, n=10–12 per group (*p<0.05).
RIPK1 kinase inhibitor attenuates EAE-induced inflammation and oligodendrocyte degeneration
Experimental autoimmune/allergic encephalomyelitis (EAE) models an inflammatory autoimmune demyelinating disease in which demyelination is induced by subcutaneous injection of synthetic peptides derived from myelin proteins. In this model, the activation of TNFR1 by TNFα is known to play an important role in mediating the degeneration of oligodendrocytes in the EAE model (Eugster et al., 1999). Surprisingly, we detected the 18 kDa active caspase-8 subunit in the spinal cord of control samples (Figure 6A). Strikingly, after induction of EAE, the spinal cord levels of full-length caspase-8 were significantly elevated, but the presence of active 18 kDa caspase-8 subunit was correspondingly decreased (Figure 6A). Interestingly, the levels of c-FLIPL were also increased by EAE (Figure 6B). Thus, induction of EAE may activate a mechanism to induce caspase-8 but suppress its activation. Consistent with the data described above from the human MS samples, reduced activation of caspase-8 in EAE may be involved in mediating an inflammatory response.
Figure 6. Caspase-8 deficiency and RIPK1 activation in EAE.
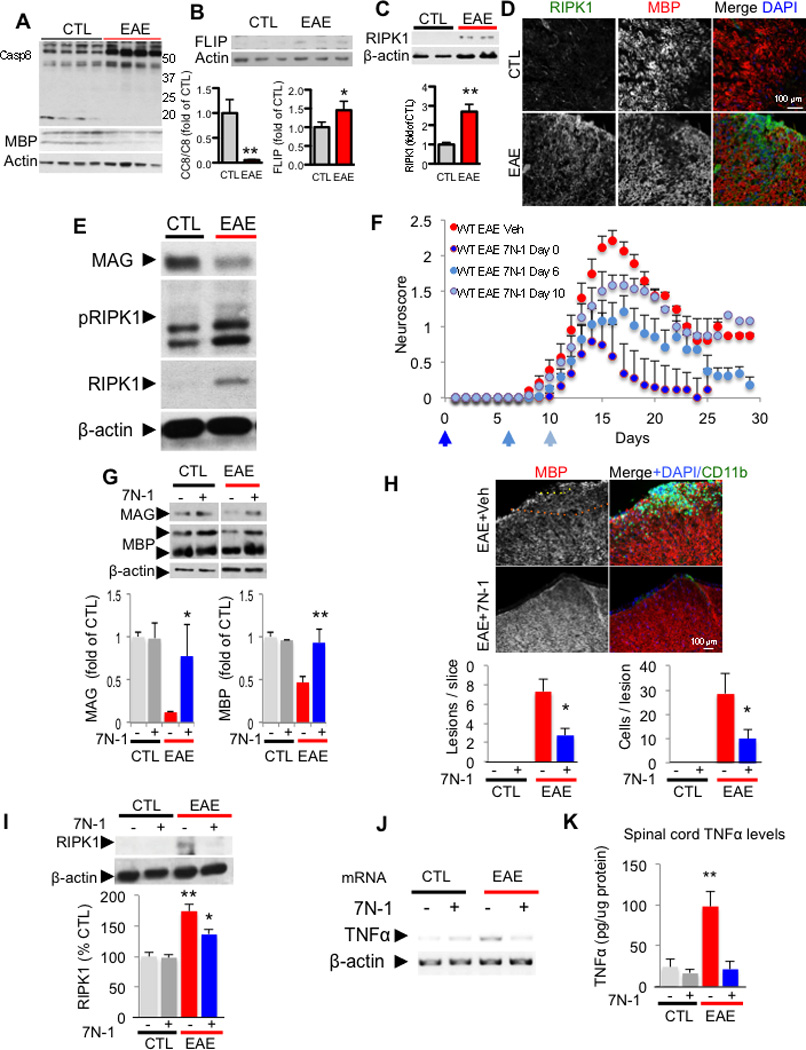
Western blotting analysis of control and EAE spinal cords (20 days post immunization) for caspase-8 (A), c-FLIPL (B). MBP and actin are used as a loading control. The graphs below represent the quantification of western blot results of caspase-8 full length and c-FLIPL in EAE spinal cords (15–20 days post immunization. Data are means ± SEM, n=6–8 animals per group). (C) Western blotting analysis of control and EAE spinal cord lysates for the expression of RIPK1 and bar graph quantification (below). (D) Representative images of spinal cord sections immunostained with anti-RIPK1, anti-MBP (myelin basic protein) and DAPI to show low RIPK1 reactivity in control untreated mice (CTL, upper panels) and increased RIPK1 immunostaining in the white matter after induction of EAE within an inflammatory lesion (lower panels; 17 days post immunization; 10–12 animals were used in each experimental group). (E) Western blotting analysis of control and EAE (15–17 days postimmunization) spinal cord lysates for anti-RIPK1 and anti-phospho-S14/15 RIPK1. β-actin is used as a loading control. (F) Clinical scores (scored in double blind manner) of vehicle (veh) and 7N-1 treated animals starting day 0, 6 or 10 after immunization of MOG 35–55 in CFA as indicated. Data from 3 independent experiments are summarized as the normalized mean ± SEM; n = 7–18 animals per group. (*p<0.05, **p<0.01, assessed by both one way ANOVA and t-test). (G) Western blotting analysis of spinal cord from either vehicle or 7N-1 treated control animals or vehicle 15–18 day post-induction of EAE with anti-MBP, anti-MAG (myelin associated glycoprotein) and anti-β-actin antibodies. Quantification of the levels of MAG and MBP normalized to β-actin is represented in graphs as ± SEM; n = 4–8 animals per group. (H) Representative images and quantification of spinal cord lesions and immunostaining with anti-MBP and anti-CD11b from control vehicle and 7N-1 treated (6 days after immunization) animals. The lesions were defined as >5 CD11b+ cells within an area of 2502 µm in the spinal cord white matter. The quantification is represented in graphs as ± SEM; n = 5 animals per group, 1–2 slices per animal from the same region of lumbar spinal cord (*p<0.05). (I) Western blotting analysis of spinal cords from either vehicle or 7N-1 treated control animals, 15–18 day post-induction of EAE with anti-RIPK1 and anti-β-actin antibodies and quantified to that of β-actin as % of the control, vehicle treated group± SEM. The quantification was from western blot data of n = 4–7 animals per group (*p<0.05, **p<0.01). The levels of TNFα mRNA (J) and protein (K) in the spinal cords of the control and treatment groups after 15–17 days of treatment were determined by RT-PCR and ELISA, respectively. The quantification is represented ± SEM; n = 6–9 animals per group (**p<0.01) in the graph.
The levels of RIPK1 were significantly and consistently elevated after EAE induction (Figure 6C–D). Interestingly, the increased levels of RIPK1 were found in IBA1+ microglia, as well as in some oligodendrocytes (Figure S4A). Consistent with activation of RIPK1, increased phospho-S14/15 RIPK1 was detected (Figure 6E). To understand whether RIPK1 kinase activity contributed causally to the detrimental effects in EAE, we examined the effect of 7N-1 on this model. Administration of 7N-1, immediately after immunization (day 0) or at day 6 after MOG peptide immunization, was able to markedly reduce disease severity compared to vehicle alone as measured by a standard EAE neuroscore, while 7N-1 given at day 10 after immunization partially reduced disease severity (Figure 6F). Dosing with 7N-1 also protected the weight loss associated with the induction of EAE (Data not shown). The loss of myelin-associated proteins, MAG and MBP, was also significantly attenuated by 7N-1 (Figure 6G). Consistent with the protection of myelin, CD11b+ monocyte infiltration was attenuated in animals treated with 7N-1 relative to the monocyte infiltration in vehicle treated animals (Figure 6H). Furthermore, the levels of RIPK1 were correspondingly reduced by 7N-1 (Figure 6I). Consistent with a reduction of inflammatory cells infiltration, the mRNA and protein levels of TNFα were also reduced (Figure 6J–K) as well as the levels of IL6 and IL1β (Figure S4B–C).
7N-1 and vehicle administered animals, however, showed no difference in the spleen enlargement induced by EAE (Figure S4D). The titers of MOG peptide directed antibody were similar in the sera of vehicle and 7N-1 treated animals (Figure S4E). The percentages of B220+, CD11b+ and CD3+ in the spleens were not significantly different with or without 7N-1 (Figure S4F). Furthermore, the immunological responses of splenocytes isolated from control and 7N-1 treated animals to MOG peptide in vitro, were not significantly different, as measured by the rate of proliferation and IL6 production (Figure S4G–H). We also examined whether 7N-1 could alter inflammatory mediated induction of adhesion molecules, similar to the mechanism of action of other therapeutics for MS (Griffith and Luster, 2013). Specifically, we examined TNFα-mediated VCAM-1 up-regulation in epithelial cells (HUVECs) and found that 7N-1 did not interfere with this process (Figure S4I). Finally, we also tested whether 7N-1 altered the immune infiltration into the CNS by performing adoptive transfer of MOG primed GFP-splenocytes and lymphocytes into naïve animals. 7N-1 did not change the number of GFP-positive cells in the CNS (Figure S4J–K). Thus, the treatment of 7N-1 significantly reduces the loss of myelin and inflammation without significantly affecting the immunologic response to MOG peptide. Taken together these data indicate that RIPK1 plays a causal role in the pathophysiology of EAE.
To examine the role of RIPK3 in EAE, we compared the expression of RIPK3 with that of RIPK1 in demyelinated lesions after the induction of EAE. Interestingly, while many of the RIPK1 positive cells in the lesions were positive for IBA1 (Figure S4A) - a marker for activated microglia - only a subset of RIPK1+ cells were also positive for RIPK3 (Figure S5A). The increase in RIPK3 protein levels was also less compared to the levels of RIPK1 (Figure S5B). Consistent with its expression levels, RIPK3 deficiency provided a mildly attenuated response to the motor dysfunction induced by EAE (Figure S5C). Similar to 7N-1 treated animals, RIPK3 deficiency had no effect on the levels of splenic B220, CD11b and CD3 positive cells when compared to that of wild-type animals (Figure S5D). Thus, in contrast to the lesions induced by cuprizone, elevated expression of RIPK1 and to a lesser extent, RIPK3, in the EAE model was largely restricted to microglia. Taken together, we conclude that EAE models an inflammatory demyelination disease mediated predominantly by infiltrating monocytes and activated microglia where RIPK1 kinase plays an important role.
Activation of necroptosis in oligodendrocytes by TNFα
RIPK1, RIPK3 (Kim et al., 2010) and MLKL the core components of necroptotic machinery, are expressed in the oligodendrocytes (Figure S2H & Figure S6A); while the expression of caspase-8, a critical mediator of death receptor mediated apoptosis, is very low in oligodendrocytes (Zhang et al., 2014), which is consistent with the reports about the inability of oligodendrocytes to undergo apoptosis upon TNFα stimulation (Jurewicz et al., 2005; Selmaj and Raine, 1988). To evaluate the role of necroptosis in the degeneration of oligodendrocytes, we examined the sensitivity of oligodendrocytes to TNFα mediated necroptosis. While apoptosis of oligodendrocytes has been found to occur during the development of the central nervous system (Butts et al., 2008), the mechanisms that mediate injury-induced oligodendrocyte degeneration in adult life are not clear. To explore the mechanism of oligodendrocyte cell death mediated by TNFα, we characterized the morphological and biochemical features of oligodendrocyte cell death treated with TNFα. Consistent with previous reports (Jurewicz et al., 2005; Selmaj and Raine, 1988), TNFα treatment induced ultrastructural changes reminiscent of necrosis in oligodendrocytes and without significant activation of caspase-3 (Figure 7A & Figure S6B–C). Using time-lapse microscopy, we found that TNFα-induced oligodendrocyte cell death is characterized by rapid cytoplasmic membrane expansion, but without the accompanied membrane blebbing characteristic of apoptosis (Figure S6D and Movie S1) but similar to the morphological changes reported for necroptotic cells (Degterev et al., 2005). Supporting the activation of necroptosis, the death of oligodendrocytes induced by TNFα was inhibited by 7N-1 (Figure 7B–C). The protection of O1+ oliogdendrocytes by 7N-1 was further confirmed using a high content imaging based approach (Figure 7D). Finally, RIPK3 deficiency also protected oligodendrocytes from TNFα-mediated necroptosis (Figure 7E). Taken together, these results suggest that necroptosis mediates oligodendrocyte cell death induced by TNFα.
Figure 7. Inhibition of RIPK1 kinase and RIPK3 protects oligodendrocytes from necroptosis induced by TNFα in vitro.
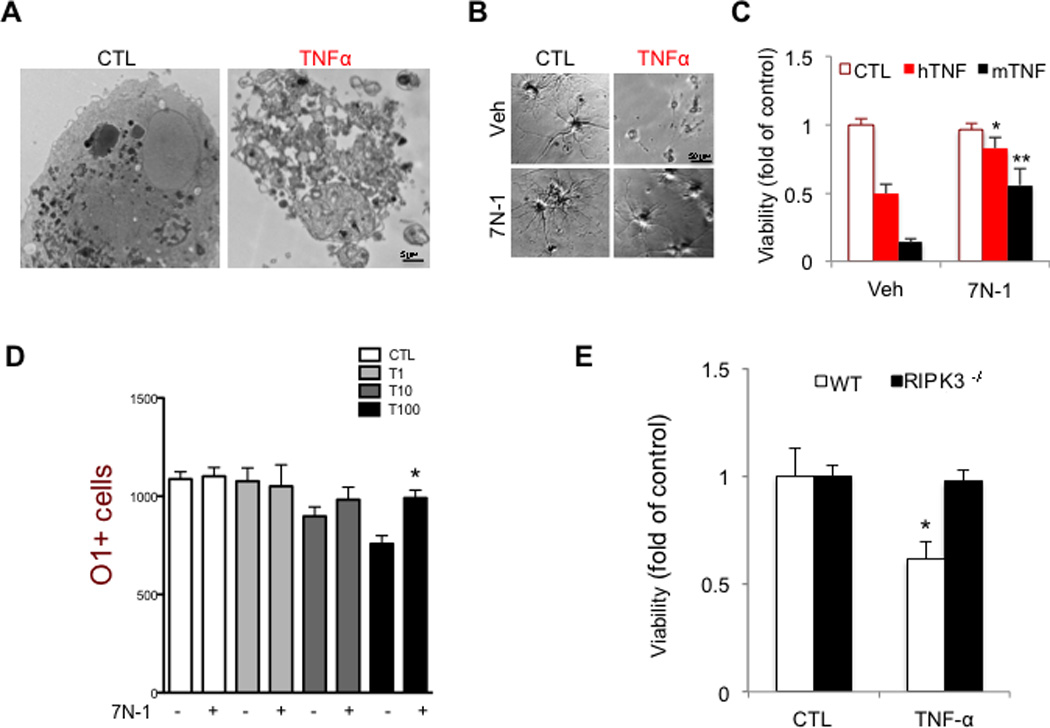
(A) Electron micrographs of control and TNFα (8h) treated rat oligodendrocytes shows non-apoptotic morphology of a dying oligodendrocyte. Images were taken at 2900x direct magnification. (B-C) Rat oligodendrocytes (DIV 8) were treated with human (hTNF, 50 ng/mL) or mouse (mTNF, 10ng/mL) TNFα (24–36 h) and viability was assessed by using the CellTiterGlo assay (Promega). Representative images are shown. Data are represented as the normalized means ± SEM, n=5–9 replicates per group (*p<0.05). (D) Oligodendrocytes were plated in 96 well plates and treated with increasing amounts of mTNFα (as indicated: T1= 1ng/ml; T10=10ng/ml; T100=100ng/ml) for 48 h in the presence or absence of 7N-1. The cells were fixed and stained with DAPI and O1-antigen specific antibody. High throughput imaging and quantification was used to count the number of cells in each condition. (E) Murine oligodendrocytes, isolated from either wild-type or RIPK3−/− mice, were treated with mTNFα (50 ng/mL, 24–36 h). The cell viability was assessed using CellTiterGlo assay. Data are represented as the normalized means ± SEM, n=10–15 wells per group and repeated 2–4 times.
Discussion
In this study, we provide substantial evidence for the activation of the necroptotic machinery in MS including the oligomerization/aggregation and phosphorylation of RIPK1, RIPK3 and MLKL in post mortem brain tissues from MS patients. Engagement of the necroptotic machinery in oligodendrocytes, which express RIPK1, RIPK3 and MLKL, but are largely devoid of caspase-8 expression, leads to necrosis. Importantly, we discover a defective caspase-8 activation in MS cortical lesions. Since caspase-8 is critical for suppressing the activation of necroptosis, these data suggest that defective activation of caspase-8 might be involved in the pathogenesis of MS. Thus, similar to the requirement of caspase-8 for supporting normal embryonic development (Kaiser et al., 2011; Oberst et al., 2011; Zhang et al., 2011b), caspase-8 activity may be required to maintain normal CNS function in adult life by suppressing the activation of RIPK1 and RIPK3.
Since caspase-8 is predominantly expressed in microglia but not in oligodendrocytes, the elevated levels of inactive caspase-8 as found in MS and EAE are most likely the result of an activated inflammatory responses in microglia. On the other hand, MLKL, a key executioner of necroptosis, is not significantly expressed in microglia (Zhang et al., 2014)(Figure S5B), which may explain why microglia under normal condition do not die in response to caspase inhibition (Kim and Li, 2013). A defect in caspase-8 activation has been implicated in promoting inflammation through the necroptotic machinery (Wallach et al., 2014) which can be blocked by the RIPK1 inhibitor 7N-1 (Christofferson et al., 2012). Thus, the engagement of the necroptotic machinery in microglia might promote inflammation, which can be blocked by 7N-1. Since RIPK1 is more highly expressed in activated microglia than RIPK3, targeting RIPK1 may be appropriate to attenuate microglial-mediated inflammatory signaling.
Complex IIb, the critical signaling/executioner of necroptosis formed by the interaction of RIPK1 and RIPK3, exists in an amyloid-like conformation (Li et al., 2012). Consistent with the activation of necroptosis in MS, we obtained multiple lines of evidence for the formation of complex IIb in human MS samples. First, we detected the interaction of RIPK1 and RIPK3 in MS, but not control, brain samples. Second, we found that a significant portion of RIPK1 and RIPK3 in MS samples could only be extracted by strong detergent or formic acid, which is typical for proteins in an amyloid conformation. Third, we found that MLKL existed in higher order oligomers in MS but not in the control tissue. Fourth, we detected increased A11+ amyloid immunostaining, a part of which overlapped with RIP1+ cells, in MS samples. The consequences of forming the amyloid-like containing complex IIb might not be limited to mediating necroptosis per se, as the presence of protein amyloids may act as seeds to induce the aggregation of additional proteins that lead to changes in the overall proteome. Consistent with this possibility, we identified an increase in proteins associated with the insoluble proteome – a significant portion of these proteins have previously been shown to be associated with Lewy bodies in pathological brain samples from patients with PD. These results suggest that the pathogenesis of MS may share a component that is common with other neurodegenerative diseases, such as AD, PD, or HD, where protein misfolding and aggregation are known to play a crucial role in pathogenesis. Similar to other neurodegenerative diseases, the formation of amyloid-like proteins may underlie the progressive motor dysfunction of MS, which is currently not addressed by existing MS therapies that target the immunological aspects of the disease.
The two MS animal models used in this study each mimics certain aspects of human MS. In the cuprizone model, ThioS+ and A11+ cells are significantly increased in the treated corpus callosum; however, we did not detect robust changes in caspase-8 activation or c-FLIP expression (data not shown). The activation of RIPK1 and RIPK3 may be in part mediated through this generalized effect of cuprizone in inducing protein aggregation in the corpus callosum. Thus, the cuprizone model might mimic aspects of protein aggregation in MS. On the other hand, in the EAE model, we found an increased expression of cFLIPL and a defective caspase-8 activation, similar to what we found in the human MS brain samples; but no obvious protein aggregation was found in EAE (data not shown). Since caspase-8 is expressed by microglia but not by oligodendrocytes, defective caspase-8 activation in EAE likely contributes significantly to inflammation through RIPK1-dependent manner. Importantly, the two models share a common feature: RIPK1 is induced and phosphorylated. These results suggest that targeting RIPK1 kinase may provide a strategy to selectively inhibit the degenerative and inflammatory events mediated by the necroptotic machinery in the CNS.
Our study implicates that elevated levels of c-FLIP might be involved in suppressing the activation of caspase-8 in human MS and in EAE. This finding may have significance in the etiology of MS: since several members of the herpesvirus family, which have been implicated in the etiology of MS (Virtanen and Jacobson, 2012), express v-FLIPs, the viral homologues of cellular FLIPs, and can inhibit caspase-8 activation. Our data also suggest the possibility that inhibition of caspase-8 by v-FLIPs might be involved in promoting the onset of MS
Experimental Procedures
Animals
C57BL/6 (B6) mice were purchased from The Jackson Laboratory. RIPK3−/− mice were kindly provided by Vishiva Dixit of Genentech (Newton et al., 2004). All animals were maintained in a pathogen-free environment, and experiments on mice were conducted according to the protocols approved by the Harvard Medical School Animal Care Committee.
7N-1 administration
7N-1 is orally available; however, its rodent in vivo t1/2 is only ∼1h. To compensate for this short t1/2 of 7N-1, we developed a drinking water formulation. We show that oral administration of 7N-1 in drinking water leads to a constant plasma and CNS concentrations of ∼237 nM and ∼42 nM, respectively (Figure S7A–D). Since the Kd of our 3rd generation optimized 7N-1 for RIPK1 is ∼6 nM (Christofferson et al., 2012), the in vivo concentration of 7N-1 through drinking water is sufficient for inhibiting RIPK1. To ensure successful inhibition of RIPK1 kinase, we combined oral administration through drinking water supplemented with a single intraperitoneal injection of 7N-1 on the first day of initiating treatment, which led to a transient dose of 7N-1 in the blood and CNS at ∼500µM and ∼100µM, respectively. No adverse effect was found to be associated with 7N-1 administration alone in this study and through a CRO contracted toxicology study (data not shown). To prepare oral delivery of 7N-1, the compound (custom synthesized) was first dissolved in DMSO (50% w/v), and then transferred into 35% PEG solution and this was suspended in water containing 2% sucrose, to increase the amount of daily water intake at a final concentration: 0.5mg/mL of 7N-1. Mice consumed 5–10 mL/day (2.5–5 mg/day). A similar process (without sucrose) was used to dissolve 7N-1 for intraperitoneal (IP) injection at concentration of (10 mg/kg). 7N-1 concentrations in plasma and brain were determined by LC/MS/MS (Figure S7).
ELISA
Spinal cord was homogenized in 1% Triton X-100 in PBS supplemented with Complete Protease Inhibitor (Roche, Indianapolis, IN, USA). Total protein levels were determined by Bradford protein assay (Bio-Rad, Hercules, CA, USA). The levels of TNFα, IL-6, and IL-1β in the spinal cord were determined using the appropriate ELISA kit according to the manufacturers instructions (R&D Systems, Minneapolis, MN, USA).
Supplementary Material
Acknowledgement
This work was supported in part by grants from the NINDS (1R01NS082257), the NIA (1R01AG047231) and a Senior Scholar Award from the Ellison Medical Foundation (to JY). DO was supported in part by the Molecular Biology of Neurodegeneration Training Grant from the NINDS (PI: Bruce Yankner) and a postdoctoral fellowship from the National Multiple Sclerosis Society. YI was supported in part by postdoctoral fellowships from Japan (Daiichi Sankyo Foundation of Life Science, The Nakatomi Foundation, the Mochida Memorial Foundation for Medical & Pharmaceutical Research, and Japan Society for the Promotion of Science). JLB was supported in part by a pre-doctoral fellowship from the Brazilian CNPq Sandwich Program. We thank Ming Guo (UCLA) for helping to obtain and James S. Riehl for providing pathological samples from control and MS patients. We thank Gary Kasof of Cell Signaling for developing anti-phospho-S166 and phosphor-S14/15 RIPK1 antibodies. We thank Dr. Ben Barres of Stanford, Drs. Bing Zhu and Samia J. Khoury of Beth Israel Deaconess Medical Center, and Dr. Paul Rosenberg of Boston Children Hospital for helpful advice. We thank Drs. Vishiva Dixit of Genentech, Riqiang Yan of Cleveland Clinic Lerner Research Institute for RIPK3−/− mice and R461/NOGO antibodies, respectively. We thank Dr. Jennifer Walters and staff at the HMS Nikon microscope facility for helps with the microscopy. We thank Dr. Manuela Polydoro and Dr. J. Bradley Zuchero for technical advice. We would like to thank Dr. Maria Salskov, Dena Ofengeim, Wen Zhou for scoring animals and the members of Yuan laboratory for support and helpful discussion.
Footnotes
Publisher's Disclaimer: This is a PDF file of an unedited manuscript that has been accepted for publication. As a service to our customers we are providing this early version of the manuscript. The manuscript will undergo copyediting, typesetting, and review of the resulting proof before it is published in its final citable form. Please note that during the production process errors may be discovered which could affect the content, and all legal disclaimers that apply to the journal pertain.
References:
- Arai T, Hasegawa M, Akiyama H, Ikeda K, Nonaka T, Mori H, Mann D, Tsuchiya K, Yoshida M, Hashizume Y, et al. TDP-43 is a component of ubiquitin-positive taunegative inclusions in frontotemporal lobar degeneration and amyotrophic lateral sclerosis. Biochem Biophys Res Commun. 2006;351:602–611. doi: 10.1016/j.bbrc.2006.10.093. [DOI] [PubMed] [Google Scholar]
- Arnett HA, Fancy SP, Alberta JA, Zhao C, Plant SR, Kaing S, Raine CS, Rowitch DH, Franklin RJ, Stiles CD. bHLH transcription factor Olig1 is required to repair demyelinated lesions in the CNS. Science. 2004;306:2111–2115. doi: 10.1126/science.1103709. [DOI] [PubMed] [Google Scholar]
- Berger SB, Kasparcova V, Hoffman S, Swift B, Dare L, Schaeffer M, Capriotti C, Cook M, Finger J, Hughes-Earle A, et al. Cutting Edge: RIP1 kinase activity is dispensable for normal development but is a key regulator of inflammation in SHARPIN-deficient mice. J Immunol. 2014;192:5476–5480. doi: 10.4049/jimmunol.1400499. [DOI] [PMC free article] [PubMed] [Google Scholar]
- Blakemore WF. Observations on oligodendrocyte degeneration, the resolution of status spongiosus and remyelination in cuprizone intoxication in mice. J Neurocytol. 1972;1:413–426. doi: 10.1007/BF01102943. [DOI] [PubMed] [Google Scholar]
- Buck D, Hemmer B. Treatment of multiple sclerosis: current concepts and future perspectives. J Neurol. 2011;258:1747–1762. doi: 10.1007/s00415-011-6101-2. [DOI] [PubMed] [Google Scholar]
- Buschmann JP, Berger K, Awad H, Clarner T, Beyer C, Kipp M. Inflammatory response and chemokine expression in the white matter corpus callosum and gray matter cortex region during cuprizone-induced demyelination. J Mol Neurosci. 2012;48:66–76. doi: 10.1007/s12031-012-9773-x. [DOI] [PMC free article] [PubMed] [Google Scholar]
- Butts BD, Houde C, Mehmet H. Maturation-dependent sensitivity of oligodendrocyte lineage cells to apoptosis: implications for normal development and disease. Cell Death Differ. 2008;15:1178–1186. doi: 10.1038/cdd.2008.70. [DOI] [PubMed] [Google Scholar]
- Cai Z, Jitkaew S, Zhao J, Chiang HC, Choksi S, Liu J, Ward Y, Wu LG, Liu ZG. Plasma membrane translocation of trimerized MLKL protein is required for TNF-induced necroptosis. Nat Cell Biol. 2014;16:55–65. doi: 10.1038/ncb2883. [DOI] [PMC free article] [PubMed] [Google Scholar]
- Chen X, Li W, Ren J, Huang D, He WT, Song Y, Yang C, Li W, Zheng X, Chen P, et al. Translocation of mixed lineage kinase domain-like protein to plasma membrane leads to necrotic cell death. Cell Res. 2014;24:105–121. doi: 10.1038/cr.2013.171. [DOI] [PMC free article] [PubMed] [Google Scholar]
- Cho YS, Challa S, Moquin D, Genga R, Ray TD, Guildford M, Chan FK. Phosphorylation-driven assembly of the RIP1-RIP3 complex regulates programmed necrosis and virus-induced inflammation. Cell. 2009;137:1112–1123. doi: 10.1016/j.cell.2009.05.037. [DOI] [PMC free article] [PubMed] [Google Scholar]
- Christofferson DE, Li Y, Zhou W, Hitomi J, Upperman C, Zhu H, Gerber SA, Gygi S, Yuan J. A Novel Role for RIP1 kinase in Mediating TNFα Production. Cell Death Diseases. 2012;3:e320. doi: 10.1038/cddis.2012.64. [DOI] [PMC free article] [PubMed] [Google Scholar]
- Degterev A, Hitomi J, Germscheid M, Ch'en IL, Korkina O, Teng X, Abbott D, Cuny GD, Yuan C, Wagner G, et al. Identification of RIP1 kinase as a specific cellular target of necrostatins. Nat Chem Biol. 2008;4:313–321. doi: 10.1038/nchembio.83. [DOI] [PMC free article] [PubMed] [Google Scholar]
- Degterev A, Huang Z, Boyce M, Li Y, Jagtap P, Mizushima N, Cuny GD, Mitchison TJ, Moskowitz MA, Yuan J. Chemical inhibitor of nonapoptotic cell death with therapeutic potential for ischemic brain injury. Nat Chem Biol. 2005;1:112–119. doi: 10.1038/nchembio711. [DOI] [PubMed] [Google Scholar]
- Dondelinger Y, Declercq W, Montessuit S, Roelandt R, Goncalves A, Bruggeman I, Hulpiau P, Weber K, Sehon CA, Marquis RW, et al. MLKL compromises plasma membrane integrity by binding to phosphatidylinositol phosphates. Cell reports. 2014;7:971–981. doi: 10.1016/j.celrep.2014.04.026. [DOI] [PubMed] [Google Scholar]
- Eugster HP, Frei K, Bachmann R, Bluethmann H, Lassmann H, Fontana A. Severity of symptoms and demyelination in MOG-induced EAE depends on TNFR1. Eur J Immunol. 1999;29:626–632. doi: 10.1002/(SICI)1521-4141(199902)29:02<626::AID-IMMU626>3.0.CO;2-A. [DOI] [PubMed] [Google Scholar]
- Griffith JW, Luster AD. Targeting cells in motion: migrating toward improved therapies. Eur J Immunol. 2013;43:1430–1435. doi: 10.1002/eji.201243183. [DOI] [PMC free article] [PubMed] [Google Scholar]
- He S, Wang L, Miao L, Wang T, Du F, Zhao L, Wang X. Receptor interacting protein kinase-3 determines cellular necrotic response to TNF-alpha. Cell. 2009;137:1100–1111. doi: 10.1016/j.cell.2009.05.021. [DOI] [PubMed] [Google Scholar]
- He W, Lu Y, Qahwash I, Hu XY, Chang A, Yan R. Reticulon family members modulate BACE1 activity and amyloid-beta peptide generation. Nat Med. 2004;10:959–965. doi: 10.1038/nm1088. [DOI] [PubMed] [Google Scholar]
- Hitomi J, Christofferson DE, Ng A, Yao J, Degterev A, Xavier RJ, Yuan J. Identification of a molecular signaling network that regulates a cellular necrotic cell death pathway. Cell. 2008;135:1311–1323. doi: 10.1016/j.cell.2008.10.044. [DOI] [PMC free article] [PubMed] [Google Scholar]
- Holler N, Zaru R, Micheau O, Thome M, Attinger A, Valitutti S, Bodmer JL, Schneider P, Seed B, Tschopp J. Fas triggers an alternative, caspase-8-independent cell death pathway using the kinase RIP as effector molecule. Nat Immunol. 2000;1:489–495. doi: 10.1038/82732. [DOI] [PubMed] [Google Scholar]
- Holmes BB, Furman JL, Mahan TE, Yamasaki TR, Mirbaha H, Eades WC, Belaygorod L, Cairns NJ, Holtzman DM, Diamond MI. Proteopathic tau seeding predicts tauopathy in vivo. Proc Natl Acad Sci U S A. 2014;111:E4376–E4385. doi: 10.1073/pnas.1411649111. [DOI] [PMC free article] [PubMed] [Google Scholar]
- Jouan-Lanhouet S, Riquet F, Duprez L, Vanden Berghe T, Takahashi N, Vandenabeele P. Necroptosis, in vivo detection in experimental disease models. Seminars in cell & developmental biology. 2014 doi: 10.1016/j.semcdb.2014.08.010. [DOI] [PubMed] [Google Scholar]
- Jurewicz A, Matysiak M, Tybor K, Kilianek L, Raine CS, Selmaj K. Tumour necrosis factor-induced death of adult human oligodendrocytes is mediated by apoptosis inducing factor. Brain. 2005;128:2675–2688. doi: 10.1093/brain/awh627. [DOI] [PubMed] [Google Scholar]
- Kaiser WJ, Upton JW, Long AB, Livingston-Rosanoff D, Daley-Bauer LP, Hakem R, Caspary T, Mocarski ES. RIP3 mediates the embryonic lethality of caspase-8-deficient mice. Nature. 2011;471:368–372. doi: 10.1038/nature09857. [DOI] [PMC free article] [PubMed] [Google Scholar]
- Kawahara A, Ohsawa Y, Matsumura H, Uchiyama Y, Nagata S. Caspase-independent cell killing by Fas-associated protein with death domain. J Cell Biol. 1998;143:1353–1360. doi: 10.1083/jcb.143.5.1353. [DOI] [PMC free article] [PubMed] [Google Scholar]
- Kayed R, Head E, Sarsoza F, Saing T, Cotman CW, Necula M, Margol L, Wu J, Breydo L, Thompson JL, et al. Fibril specific, conformation dependent antibodies recognize a generic epitope common to amyloid fibrils and fibrillar oligomers that is absent in prefibrillar oligomers. Mol Neurodegener. 2007;2:18. doi: 10.1186/1750-1326-2-18. [DOI] [PMC free article] [PubMed] [Google Scholar]
- Kayed R, Head E, Thompson JL, McIntire TM, Milton SC, Cotman CW, Glabe CG. Common structure of soluble amyloid oligomers implies common mechanism of pathogenesis. Science. 2003;300:486–489. doi: 10.1126/science.1079469. [DOI] [PubMed] [Google Scholar]
- Kim S, Dayani L, Rosenberg PA, Li J. RIP1 kinase mediates arachidonic acid-induced oxidative death of oligodendrocyte precursors. Int J Physiol Pathophysiol Pharmacol. 2010;2:137–147. [PMC free article] [PubMed] [Google Scholar]
- Kim SJ, Li J. Caspase blockade induces RIP3-mediated programmed necrosis in Toll-like receptor-activated microglia. Cell Death Dis. 2013;4:e716. doi: 10.1038/cddis.2013.238. [DOI] [PMC free article] [PubMed] [Google Scholar]
- Krueger A, Schmitz I, Baumann S, Krammer PH, Kirchhoff S. Cellular FLICE-inhibitory protein splice variants inhibit different steps of caspase-8 activation at the CD95 death-inducing signaling complex. J Biol Chem. 2001;276:20633–20640. doi: 10.1074/jbc.M101780200. [DOI] [PubMed] [Google Scholar]
- Li J, McQuade T, Siemer AB, Napetschnig J, Moriwaki K, Hsiao YS, Damko E, Moquin D, Walz T, McDermott A, et al. The RIP1/RIP3 Necrosome Forms a Functional Amyloid Signaling Complex Required for Programmed Necrosis. Cell. 2012;150:339–350. doi: 10.1016/j.cell.2012.06.019. [DOI] [PMC free article] [PubMed] [Google Scholar]
- Luk KC, Song C, O'Brien P, Stieber A, Branch JR, Brunden KR, Trojanowski JQ, Lee VM. Exogenous alpha-synuclein fibrils seed the formation of Lewy body-like intracellular inclusions in cultured cells. Proc Natl Acad Sci U S A. 2009;106:20051–20056. doi: 10.1073/pnas.0908005106. [DOI] [PMC free article] [PubMed] [Google Scholar]
- Matsushima GK, Morell P. The neurotoxicant, cuprizone, as a model to study demyelination and remyelination in the central nervous system. Brain Pathol. 2001;11:107–116. doi: 10.1111/j.1750-3639.2001.tb00385.x. [DOI] [PMC free article] [PubMed] [Google Scholar]
- Mycko MP, Papoian R, Boschert U, Raine CS, Selmaj KW. Microarray gene expression profiling of chronic active and inactive lesions in multiple sclerosis. Clin Neurol Neurosurg. 2004;106:223–229. doi: 10.1016/j.clineuro.2004.02.019. [DOI] [PubMed] [Google Scholar]
- Newton K, Sun X, Dixit VM. Kinase RIP3 is dispensable for normal NF-kappa Bs, signaling by the B-cell and T-cell receptors, tumor necrosis factor receptor 1, and Toll-like receptors 2 and 4. Mol Cell Biol. 2004;24:1464–1469. doi: 10.1128/MCB.24.4.1464-1469.2004. [DOI] [PMC free article] [PubMed] [Google Scholar]
- Oberst A, Dillon CP, Weinlich R, McCormick LL, Fitzgerald P, Pop C, Hakem R, Salvesen GS, Green DR. Catalytic activity of the caspase-8-FLIP(L) complex inhibits RIPK3-dependent necrosis. Nature. 2011;471:363–367. doi: 10.1038/nature09852. [DOI] [PMC free article] [PubMed] [Google Scholar]
- Ofengeim D, Yuan J. Regulation of RIP1 kinase signalling at the crossroads of inflammation and cell death. Nat Rev Mol Cell Biol. 2013;14:727–736. doi: 10.1038/nrm3683. [DOI] [PubMed] [Google Scholar]
- Sanchez I, Mahlke C, Yuan J. Pivotal role of oligomerization in expanded polyglutamine neurodegenerative disorders. Nature. 2003;421:373–379. doi: 10.1038/nature01301. [DOI] [PubMed] [Google Scholar]
- Selmaj KW, Raine CS. Tumor necrosis factor mediates myelin and oligodendrocyte damage in vitro. Ann Neurol. 1988;23:339–346. doi: 10.1002/ana.410230405. [DOI] [PubMed] [Google Scholar]
- Sharief MK, Hentges R. Association between tumor necrosis factor-alpha and disease progression in patients with multiple sclerosis. N Engl J Med. 1991;325:467–472. doi: 10.1056/NEJM199108153250704. [DOI] [PubMed] [Google Scholar]
- Shorter J, Lindquist S. Hsp104 catalyzes formation and elimination of self-replicating Sup35 prion conformers. Science. 2004;304:1793–1797. doi: 10.1126/science.1098007. [DOI] [PubMed] [Google Scholar]
- Spirig T, Ovchinnikova O, Vagt T, Glockshuber R. Direct Evidence for Self-Propagation of Different Amyloid-beta Fibril Conformations. Neuro-degenerative diseases. 2014;14:151–159. doi: 10.1159/000363623. [DOI] [PubMed] [Google Scholar]
- Sun L, Wang H, Wang Z, He S, Chen S, Liao D, Wang L, Yan J, Liu W, Lei X, et al. Mixed lineage kinase domain-like protein mediates necrosis signaling downstream of RIP3 kinase. Cell. 2012;148:213–227. doi: 10.1016/j.cell.2011.11.031. [DOI] [PubMed] [Google Scholar]
- Trapp BD, Nave KA. Multiple sclerosis: an immune or neurodegenerative disorder? Annu Rev Neurosci. 2008;31:247–269. doi: 10.1146/annurev.neuro.30.051606.094313. [DOI] [PubMed] [Google Scholar]
- Virtanen JO, Jacobson S. Viruses and multiple sclerosis. CNS Neurol Disord Drug Targets. 2012;11:528–544. doi: 10.2174/187152712801661220. [DOI] [PMC free article] [PubMed] [Google Scholar]
- Wallach D, Kang TB, Yang SH, Kovalenko A. The in vivo significance of necroptosis: lessons from exploration of caspase-8 function. Cytokine Growth Factor Rev. 2014;25:157–165. doi: 10.1016/j.cytogfr.2013.12.001. [DOI] [PubMed] [Google Scholar]
- Wang H, Sun L, Su L, Rizo J, Liu L, Wang LF, Wang FS, Wang X. Mixed lineage kinase domain-like protein MLKL causes necrotic membrane disruption upon phosphorylation by RIP3. Mol Cell. 2014;54:133–146. doi: 10.1016/j.molcel.2014.03.003. [DOI] [PubMed] [Google Scholar]
- Zhang H, Zhou X, McQuade T, Li J, Chan FK, Zhang J. Functional complementation between FADD and RIP1 in embryos and lymphocytes. Nature. 2011a;471:373–376. doi: 10.1038/nature09878. [DOI] [PMC free article] [PubMed] [Google Scholar]
- Zhang J, Zhang H, Li J, Rosenberg S, Zhang EC, Zhou X, Qin F, Farabaugh M. RIP1-mediated regulation of lymphocyte survival and death responses. Immunol Res. 2011b;51:227–236. doi: 10.1007/s12026-011-8249-3. [DOI] [PMC free article] [PubMed] [Google Scholar]
- Zhang Y, Chen K, Sloan SA, Bennett ML, Scholze AR, O'Keeffe S, Phatnani HP, Guarnieri P, Caneda C, Ruderisch N, et al. An RNA-sequencing transcriptome and splicing database of glia, neurons, and vascular cells of the cerebral cortex. J Neurosci. 2014;34:11929–11947. doi: 10.1523/JNEUROSCI.1860-14.2014. [DOI] [PMC free article] [PubMed] [Google Scholar]
Associated Data
This section collects any data citations, data availability statements, or supplementary materials included in this article.