

ABSTRACT
Antiretroviral therapy (ART) inhibits HIV-1 replication, but the virus persists in latently infected resting memory CD4+ T cells susceptible to viral reactivation. The virus-encoded early gene product Tat activates transcription of the viral genome and promotes exponential viral production. Here we show that the Tat inhibitor didehydro-cortistatin A (dCA), unlike other antiretrovirals, reduces residual levels of viral transcription in several models of HIV latency, breaks the Tat-mediated transcriptional feedback loop, and establishes a nearly permanent state of latency, which greatly diminishes the capacity for virus reactivation. Importantly, treatment with dCA induces inactivation of viral transcription even after its removal, suggesting that the HIV promoter is epigenetically repressed. Critically, dCA inhibits viral reactivation upon CD3/CD28 or prostratin stimulation of latently infected CD4+ T cells from HIV-infected subjects receiving suppressive ART. Our results suggest that inclusion of a Tat inhibitor in current ART regimens may contribute to a functional HIV-1 cure by reducing low-level viremia and preventing viral reactivation from latent reservoirs.
IMPORTANCE
Antiretroviral therapy (ART) reduces HIV-1 replication to very low levels, but the virus persists in latently infected memory CD4+ T cells, representing a long-lasting source of resurgent virus upon ART interruption. Based on the mode of action of didehydro-cortistatin A (dCA), a Tat-dependent transcription inhibitor, our work highlights an alternative approach to current HIV-1 eradication strategies to decrease the latent reservoir. In our model, dCA blocks the Tat feedback loop initiated after low-level basal reactivation, blocking transcriptional elongation and hence viral production from latently infected cells. Therefore, dCA combined with ART would be aimed at delaying or halting ongoing viral replication, reactivation, and replenishment of the latent viral reservoir. Thus, the latent pool of cells in an infected individual would be stabilized, and death of the long-lived infected memory T cells would result in a continuous decay of this pool over time, possibly culminating in the long-awaited sterilizing cure.
INTRODUCTION
Antiretroviral therapy (ART) has significantly improved the health and quality of life of many individuals infected with HIV-1. However, ART fails to permanently eradicate the virus. Stable reservoirs composed of latently infected resting memory CD4+ T cells harbor an integrated form of the HIV genome that, in the absence of ART, can reignite active replication (1–4). The long half-life of latently infected cells appears to be mainly responsible for HIV persistence in individuals receiving ART (5, 6). In addition to these latently infected cells, HIV may still persist through ongoing viral replication in subjects on suppressive ART (7–9), although this mechanism of viral persistence remains controversial (10, 11). Residual viremia is thought to be a major contributor to inflammation and other HIV-associated complications, leading to cardiovascular and neurological diseases (12). Unfortunately, ART intensification does not seem to reduce the size of the viral reservoir nor inhibit residual viremia (13, 14).
The early virus-encoded gene product Tat is required for robust transcription of the integrated viral genome by RNA polymerase II (RNAP II) (15, 16). Tat binds the 5′ terminal region of the HIV mRNA stem-bulge-loop structure transactivation response element (TAR) and recruits the positive transcription elongation factor B (P-TEFb), composed of cyclin T1 and cyclin-dependent kinase 9 (CDK9), to promote transcriptional elongation from the viral promoter (5′-long terminal repeat [5′-LTR]) (17–19).
In resting CD4+ T cells, HIV-1 is maintained in a latent state by several mechanisms. These include low levels of Tat (20, 21) or active P-TEFb (22), the exclusion of cellular transcription factors such as nuclear factor κB (NF-κB) and nuclear factor of activated T cells (NFAT) from the nucleus (23, 24), the presence of repressors CBF-1 and YY1 (25, 26), lower levels of intracellular deoxynucleoside triphosphate (dNTP) pools (27, 28), as well as transcriptional interference (29). The viral promoter activity is directly governed by its chromatin environment (30). Nucleosomes are precisely positioned at the HIV-1 promoter. Nucleosome-1, downstream from the transcription start site, directly impedes activity of the 5′-LTR (31). Moreover, additional transcriptional initiation blocks are imposed by specific epigenetic chromatin modifications at nucleosomes on the 5′-LTR, notably, deacetylation and methylation of histone N-terminal tails (32). DNA methylation of CpG islands within the HIV 5′-LTR has also been associated with HIV-1 latency, but it likely enhances silencing of already-latent viruses rather than contributing to entry into latency (33). Furthermore, recent studies did not confirm the previous findings and rather supported the absence of a role of DNA hypermethylation in the maintenance of latency (34, 35).
Transcriptional reactivation is accompanied by changes in the local chromatin structure, which is accomplished by recruitment via Tat of chromatin remodeling factors such as SWI/SNF (36, 37) and histone acetyltransferases, such as CREB binding protein (CBP) and p300 (38), p300/CBP-associated factors, and the histone acetyltransferase hGCN5 (37, 39–43), which can reverse the effects of histone deacetylation. Tat may also induce nuclear translocation of NF-κB p50/p65 (44). In sum, even though much progress has been made toward the understanding of latency, transcriptional silencing is a multifactorial phenomenon, and these mechanisms in vivo are still incompletely understood.
Tat is an attractive target for therapeutic intervention, because it is expressed early during virus replication and it has no cellular homologs. Moreover, direct inhibition of Tat blocks the feedback loop that drives exponential increase in viral transcription and the production of viral particles (45). There is evidence that latently infected cells, as opposed to productively infected CD4+ T cells, accumulate Tat-deficient viruses with impaired reactivation abilities (46). These results suggest that blocking Tat activity might help block viral reactivation and maintain the virus in a state of prolonged silencing.
While dependence of HIV transcription on Tat has made it a highly sought-after drug target, no therapeutic agents are currently available in the clinic to inhibit this viral protein (47). We have recently characterized didehydro-cortistatin A (dCA), an analog of the natural product cortistatin A, that potently and selectively inhibits Tat transactivation of the HIV promoter by specifically binding to the TAR-binding domain of Tat (48). dCA reduces cell-associated HIV-1 RNA and capsid p24 antigen production in both acutely and chronically infected cells. In primary CD4+ T cells isolated from viremic individuals, dCA presents an additive effect with other antiretrovirals (ARVs) (48). To our knowledge, dCA is the most potent Tat inhibitor described to date, blocking HIV transcription at subnanomolar concentrations without cell-associated toxicity.
Our working hypothesis is that dCA, by inhibiting Tat activity and the residual HIV transcription commonly observed in various cell line models of latency, as well as in CD4+ T cells from ART-treated subjects (49), could promote and maintain a prolonged state of latency highly refractory to viral reactivation. As a result, ongoing viral transcripts and reactivation events that could replenish the viral reservoir would be significantly reduced, potentially curtailing the time for the elimination of the reservoir.
Here we show that dCA efficiently inhibits viral reactivation mediated by a protein kinase C (PKC) agonist or upon antigenic stimulation of primary latently infected cells isolated from individuals receiving suppressive ART. We also demonstrate that dCA, unlike ART, can reduce the low, but persistent, cell-associated HIV-1 RNA production in several cellular models of latency by reducing RNAP II recruitment to the HIV promoter. As a result, these cells become refractory to viral reactivation by several well-characterized antilatency agents (histone deacetylase [HDAC] inhibitors, PKC activators, and cytokines). Importantly, discontinuation of dCA treatment does not result in viral rebound, as the promoter is transcriptionally shut off and epigenetic modifications most likely block RNAP II recruitment to the HIV promoter. Finally, and as expected, latent cell lines containing virus with either mutated TAR or Tat are insensitive to dCA treatment.
RESULTS
dCA blocks viral reactivation in CD4+ T cells isolated from virally suppressed patients upon T-cell receptor engagement.
Transcriptionally silent proviruses can be induced by stimuli such as gamma-c cytokines or antigenic stimulation through the T-cell receptor (TCR) (50–52). These stimuli activate PKC and Ca2+-calcineurin pathways, resulting in nuclear translocation of NF-κB and NFAT (53, 54). We sought to determine whether dCA could block viral reactivation upon stimulation of latently infected CD4+ T cells isolated from nine aviremic subjects treated with ART for at least 3 years. In an effort to assess the effect of dCA on latency, we selected patient samples that did not display detectable levels of spontaneous viral production when cultured in vitro but which robustly released virus upon antigenic stimulation. CD4+ T cells were maintained with ARVs at all times, to avoid spreading of the infection. Using an ultrasensitive quantitative reverse transcription-PCR (RT-qPCR) assay, we measured viral genomic RNAs associated with viral particles upon stimulation with anti-CD3/CD28 antibodies in the presence of ARVs with or without 100 nM dCA (Fig. 1). Under these strong virus-reactivating conditions, dCA potently blocked viral reactivation in latently infected cells from the nine patient samples tested. The average percent inhibition of all 9 samples was 92.3%, and individual inhibition levels ranged from 55.4% to 100%. Thus, dCA can potently inhibit viral reactivation in latently infected CD4+ T cells isolated from ART-suppressed HIV-infected subjects.
FIG 1 .

dCA inhibits HIV reactivation after TCR stimulation from CD4+ T cells isolated from virally suppressed subjects. (A) CD4+ T cells were isolated from PBMCs from nine virally suppressed infected individuals carefully selected that did not display spontaneous viral production upon in vitro culture to better reflect latency. Activation of viral production from latency with anti-CD3/CD28 beads was performed in the presence of ARVs with or without 100 nM dCA. Viral genomic RNAs from viral particles released in the supernatants were extracted 6 days later and analyzed by ultrasensitive RT-qPCR. NS, nonstimulated; ND, not detected. (B) Summary of the nine subjects. The two-tailed paired t test was used for statistical comparisons.
dCA represses residual HIV-1 transcription and production in cellular models of HIV latency.
None of the existing cell line models accurately reflects the HIV latency observed in quiescent CD4+ T cells from HIV-infected individuals (55). This is in part because latency is established by a combination of events, including variation in the levels of transcription factors and dNTPs, as well as the location and sense of proviral integration, among others. This multitude of factors may vary between latently infected CD4+ T cells, resulting in different residual viral transcriptional activities. Moreover, cell lines used in vitro are not quiescent and are often transformed to maintain their immortality. Notably, HIV latency models derived from primary cells using clonal tissue culture-adapted virus have shown largely divergent results upon stimulation (55), demonstrating the difficulty of recapitulating latency in vitro. Nonetheless, the available in vitro models have proven useful to understand several aspects of HIV latency. Therefore, we next investigated dCA’s impact on the residual levels of HIV transcription commonly detected in several latently infected cell lines and whether dCA could achieve complete transcriptional silencing.
We first tested the effect of dCA in a population of HeLa-CD4 cells latently infected with the HIV-1 isolate NL4-3, a cell population which we developed in the laboratory and that is characterized by very low levels of virus production. We treated these cells for a period of 239 days with 100 nM dCA or dimethyl sulfoxide (DMSO) (Fig. 2A, left panel). Residual levels of HIV-1 p24 antigen production were monitored in the supernatant via an enzyme-linked immunosorbent assay (ELISA). In the presence of dCA, we observed a continuous reduction in the levels of p24 release to below the limit of detection of the assay (3.1 pg/ml) by day 82. dCA, but not other ARVs (200 nM lamivudine, 200 nM raltegravir, and 100 nM efavirenz), reduced residual levels of viral production, as ARVs act on new infections but have no effect on residual transcription from already-integrated genomes (see Fig. S1A in the supplemental material). The marked reduction in viral production suggested that dCA lowered equilibrium concentrations of Tat protein and/or promoted epigenetic modifications, resulting in a state of transcriptional repression and latency (56, 57). Upon day 97, HIV expression remained undetectable in dCA-treated cells, even when the dCA concentration was reduced to 10 nM (day 118) (Fig. 2A, left panel). Using RT-qPCR targeting the vpr gene, we confirmed that viral mRNA expression in dCA-treated cells (day 239) was drastically reduced (97%) from that in DMSO-treated control cells (Fig. 2A, right panel). dCA was not toxic or cytostatic at the concentrations used (see Fig. S1B) (48).
FIG 2 .
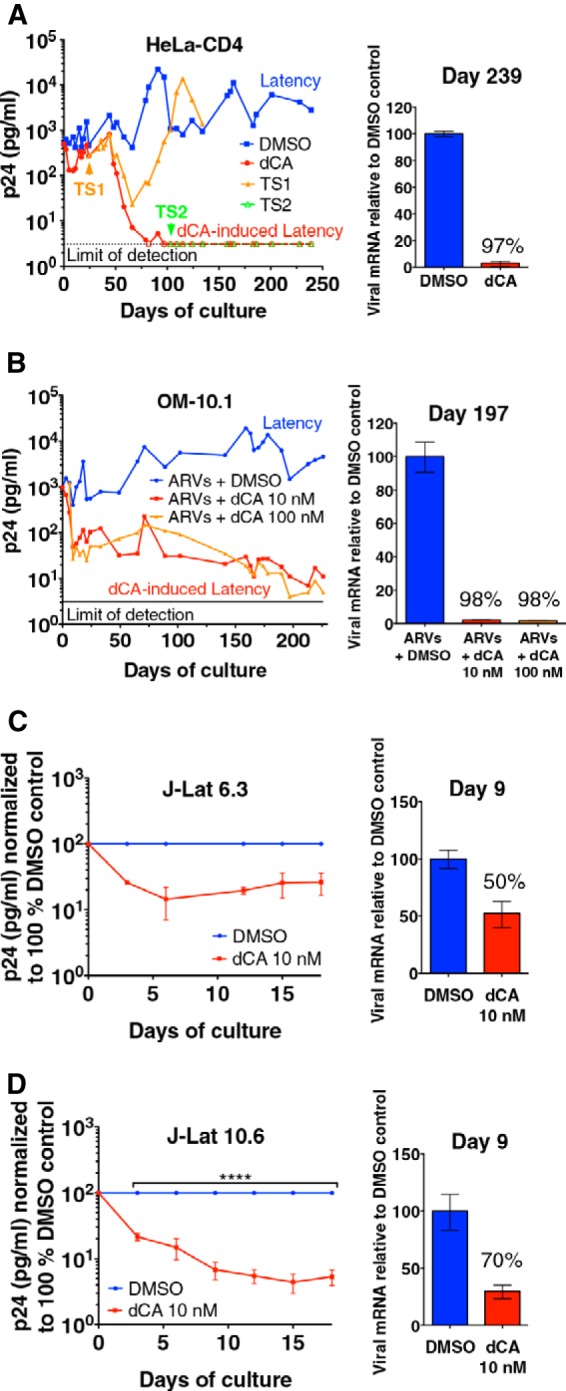
dCA inhibits residual transcription in HIV-1 latently infected cell line models. (A) dCA inhibits NL4-3 virus expression to undetectable levels in HeLa-CD4 cells (left panel). Latently infected HeLa-CD4 cells were treated with DMSO control or dCA for 239 days (100 nM dCA used from 0 to 118 days and then at 10 nM afterward). dCA treatment was stopped at day 24 (TS1) and day 103 (TS2). TS, treatment stop. Capsid p24 in the supernatants was assayed in an ELISA (detection limit, 3.1 pg/ml). Data are representative of two independent experiments (right panel). For analysis of viral mRNA expression, cDNAs from total RNA extracted at day 239 were quantified by RT-qPCR using primers to the Vpr region. Results were normalized as number of viral mRNA copies per GAPDH mRNA. Viral mRNA generated in the DMSO control was set to 100%. Data are representative of two analyses (days 129 and 239). RT-qPCR data are reported as means ± SD. (B) dCA inhibits viral production in the OM-10.1 cell line to almost-undetectable levels (left panel). OM-10.1 cells were split and treated on average every 3 days in the presence of ARVs with or without dCA. Capsid production was quantified via a p24 ELISA. Data are representative of four independent experiments with treatment of cells ranging from 42 to 226 days (right panel). For analysis of viral mRNA expression in dCA-treated OM-10.1 cells, cDNAs from total RNA (day 197) were quantified, normalized, and are reported as described for panel A using primers to the Gag-Pol region. Data are representative of three analyses at days 102, 163, and 197. (C and D) Effects of dCA on J-Lat 6.3 and 10.6 clones (left panels). Cells were split and treated on average every 3 days with or without 10 nM dCA. Capsid production was quantified via a p24 ELISA, and results for the DMSO controls were set to 100%. Data are reported as means ± SD of two or three independent experiments, respectively. Significant effects of dCA (****, P < 0.0001) and time (****, P < 0.0001) were determined by a two-way repeated-measures ANOVA with Bonferroni correction post hoc (n = 3 per group) (right panels). dCA inhibited viral transcription in J-Lat clones. Viral mRNA levels (day 9) were quantified, normalized, and are reported as described for panel A, using Gag-Pol primers. Data are representative of two independent experiments.
Upon ART interruption, HIV viremia rebound occurs in all but exceptional cases (58). We posit that dCA represses HIV transcription and promotes a closed chromatin environment at the HIV promoter. To address this possibility, we assessed whether HIV replication resumed upon dCA withdrawal in HeLa-CD4 cells or if the repressed chromatin limited viral reactivation. An early dCA treatment stop (TS) was performed at day 24 (TS1), when virus production was still detectable by p24 ELISA (Fig. 2A, left panel). During the first 50 days after TS, HIV production was similar to that in dCA-treated cells. However, virus production rebounded at day 66 to levels similar to those of control cells. In contrast, treatment discontinuation at day 103 (TS2), when viral production was undetectable, did not lead to viral rebound and viral production remained below the limit of detection for over 4 months (Fig. 2A, left panel). Of note, no residual traces of dCA were observed by liquid chromatography-mass spectrometry in HeLa-CD4 cell extracts passaged 3 or 11 times upon drug withdrawal (see Fig. S1C in the supplemental material). Altogether, these results suggest that the long-lasting inhibitory effects of dCA on virus production are likely due to epigenetic transcriptional repression, as no viral transcripts were produced after removal of the drug.
To verify that long-term treatment with dCA had not simply positively selected for uninfected HeLa-CD4 cells, we determined the number of integrated proviruses by Alu-PCR followed by qPCR at days 0, 129, 178, and 194 of culture (see Fig. S1D in the supplemental material). Interestingly, we observed a higher number of integrated proviruses in dCA-treated latent cells than in DMSO-treated controls. This result may be explained by negative selection of cells with multiple viral integration events. In contrast, in dCA-treated cells, the absence of proviral expression would bypass this counterselection and allow survival of cells with multiple integrated proviruses. Nevertheless, these results confirmed that dCA-treated cells contain integrated provirus, and the lack of virus production is due to a loss of transcription and not to a loss of infected cells.
The drastic reductions in virus production and viral transcription were also confirmed in well-characterized cell line models of latency, such as the promyelocytic OM-10.1 (59) and the J-Lat T-lymphocytic (60) cell lines (Fig. 2B, C, and D). OM-10.1 cells carry a competent provirus, while J-Lat cells harbor an HIV-1 genome with a frameshift mutation in env that renders them transcriptionally competent but replication incompetent. Similar to latently infected HeLa-CD4 cells, treatment of OM-10.1 cells for 226 days with 10 or 100 nM dCA in the presence of ARVs reduced p24 production to close to the assay’s limit of detection (Fig. 2B, left panel). Consistently, viral mRNA levels were reduced by 98% at day 197 (Fig. 2B, right panel). As expected, in the OM-10.1 model, the number of integrated proviruses was not affected by the long-term treatment with dCA combined with ARVs (see Fig. S2A in the supplemental material). In J-Lat clones 6.3 and 10.6, dCA treatment resulted in similar effects as in HeLa-CD4 and OM-10.1 cells, as demonstrated by the reduction in p24 and viral mRNA production by 10 nM dCA during the shorter 18-day treatment period (Fig. 2C and D). dCA was not toxic or cytostatic in any of the tested cell lines (see Fig. S2B and C). Altogether, our results demonstrated the ability of the Tat inhibitor dCA to induce transcriptional silencing in several cell line models of HIV latency.
dCA treatment results in loss of RNAP II recruitment to the HIV promoter.
To confirm that transcriptional inhibition was at the root of the dCA-mediated block of viral mRNA production in HeLa-CD4 cells, we performed chromatin immunoprecipitation (ChIP) to RNAP II followed by RT-qPCR to measure transcriptional initiation (nucleosome 0 [Nuc-0], promoter [Pro], and Nuc-1 amplicons) and elongation (Vpr amplicon) (Fig. 3). As controls for RNAP II recruitment, we used tumor necrosis factor alpha (TNF-α) to activate the vehicle cells and α-amanitin to inhibit RNAP II activity (Fig. 3B and C). Recruitment of RNAP II during transcription initiation was reduced 2-fold upon dCA treatment, while the occupancy of RNAP II on the GAPDH promoter or open reading frame (ORF) was unchanged by dCA (Fig. 3B and C). Transcriptional elongation (vpr) was reduced by 80% in dCA-treated cells, demonstrating that blocking Tat activity further reduces transcription in latent cells already expressing few viral transcripts (Fig. 3B). In this particular latently infected model, TNF-α activation induced a 2-fold increase in the levels of p24 production (see Fig. S3 in the supplemental material), which was paralleled by a similar increase in RNAP II recruitment at the LTR, as determined by ChIP (Fig. 3B). As a control, we used the RNAP II inhibitor α-amanitin and, as expected, the drug inhibited RNAP II recruitment at all positions (Fig. 3B and C). Collectively, these results demonstrated that dCA represses residual levels of HIV transcription and viral production in latently infected cells by inhibiting the recruitment of RNAP II.
FIG 3 .

dCA reduces RNAP II recruitment to the HIV promoter and inhibits viral transcription elongation from latently infected HeLa-CD4 cells. (A) Schematic representation of the HIV genome and primer localizations. (B) RNAP II ChIP results with latently infected HeLa-CD4 cells treated long term with DMSO or dCA, at day 172. As controls, DMSO-treated cells were activated with TNF-α for 8 h or inhibited with α-amanitin (α-ama) for 48 h. Data are presented as percentages of input, with the average IgG background subtracted. Data for RT-qPCR (using the indicated primers) are reported as means ± SD. Results are representative of two independent ChIP assays. (C) GAPDH was used as the reference gene, with amplicons to the promoter or ORF.
CpG hypermethylation does not contribute to dCA-induced latency.
Several CpG islands have been identified within the HIV genome, including one in the U3 region of the LTR and another just downstream of the LTR (61). Hypermethylated CpG islands in the HIV promoter have been associated with latency (33, 62). We therefore investigated whether proviruses from dCA-treated cells were silenced by CpG methylation (see Fig. S4 in the supplemental material). HeLa-CD4 cells treated with DMSO or dCA (Fig. 2A) and acutely infected cells were treated with bisulfite. This method characterizes the DNA methylation status by deamination of unmethylated cytosines into uracil. The resulting DNA was amplified, cloned, and sequenced. In this HeLa-CD4 model, DNA methylation of the 5′-LTR did not seem to contribute to dCA-mediated transcriptional silencing of the provirus (see Fig. S4), in agreement with the growing evidence that DNA hypermethylation is not required for latency maintenance (34, 35).
Long-term treatment with dCA induces viral latency not susceptible to conventional latency-reversing agents.
Next, we asked whether long-term treatment with dCA would render latently infected HeLa-CD4 cells resistant to viral reactivation. Since these cells do not have TCRs for viral activation, phorbol myristate acetate (PMA) and ionomycin (iono), which activate the PKC pathway and promote transcription via NF-κB (63, 64), were used to reactivate HIV (Fig. 2A). A 5-fold increase in p24 release was observed following 24 h of PMA-iono treatment under the control conditions; in contrast, no detectable viral activation was observed in cells that were previously exposed to dCA (Fig. 4A). To further ascertain whether the HeLa-CD4 cells grown for a long period of time in DMSO or dCA were equally responsive to PMA-iono, we analyzed interleukin-1β (IL-1β) mRNA production by qPCR, as this cellular gene is activated by NF-κB (65). No difference in susceptibility to PMA-iono activation was observed between either group of long-term-treated cells (DMSO versus dCA) and the uninfected HeLa-CD4 cells (see Fig. S5A in the supplemental material). Similarly, activation of the mitogen-activated protein kinases (MAPKs) triggered by PKC activation (66) was unaffected, as both MEK1/2 and extracellular signal-regulated kinases 1 and 2 (ERK1/2) were phosphorylated equally well under the two conditions (see Fig. S5B).
FIG 4 .
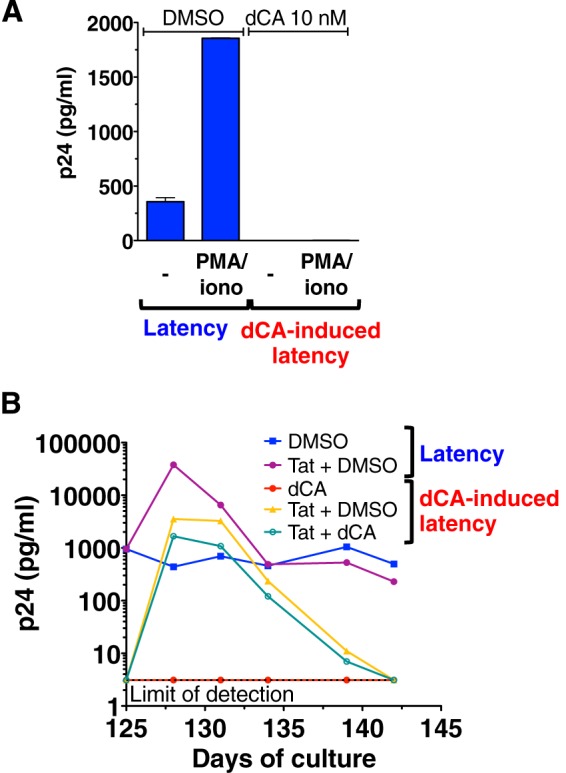
dCA inhibits viral reactivation from latently infected HeLa-CD4 cells. (A) PMA-iono treatment failed to reactivate virus from dCA-mediated latency in HeLa-CD4 cells. Cells treated with DMSO or dCA at 10 nM were activated or not for 24 h with a combination of PMA and iono. Data are presented as means ± SD of two independent experiments performed at days 131 and 152 post-dCA treatment (n = 2). (B) Exogenous Tat reactivates virus from latency in dCA-treated HeLa-CD4 cells. Cells were evaluated at day 125 post-dCA treatment in the presence or absence of dCA by transfecting an empty vector control or a Tat-Flag-expressing plasmid, and p24 production was determined via an ELISA. Results are representative of three independent transfection experiments.
To demonstrate that the integrated provirus in HeLa-CD4 cells treated long term with dCA were transcriptionally competent but incapable of reactivation due to the lack of Tat activity mediated by dCA, a plasmid harboring the Tat gene or the corresponding empty vector (Fig. 4B) was transfected into control or long-term-treated dCA cells. In control cells, the plasmid produced Tat-reactivated viral production well above the normal basal level (approximately 2 logs). When the Tat-carrying plasmid was transfected in long-term dCA-treated cells, in the presence or absence of dCA we observed a similar robust level of viral reactivation in both cases, indicating that latent provirus expression can be rescued by large amounts of Tat. The presence of the Tat inhibitor only decreased by 2-fold the reactivation, suggesting that an excess of the overexpressed Tat overrides dCA function. Unexpectedly, within 17 days viral production from the long-term dCA-treated cells returned to below the limit of viral detection even in the absence of dCA, suggesting that the mechanisms involved in the maintenance of dCA-mediated latency are long lasting and not easily circumvented. To determine whether the HIV NL4-3 produced in response to Tat stimulation remained replication competent and that dCA-mediated latency was not just simply the result of the accumulation of impairing mutations over time, we used the supernatants from both DMSO- and dCA-treated cells activated by Tat and cultured the released viruses. Viruses produced from these newly infected HeLa-CD4 cells replicated in vitro and could be inhibited by 10 nM dCA (see Fig. S5C in the supplemental material). Proviral DNA from the DMSO- and dCA-treated samples (from day 178) were sequenced and aligned to the HIV-1 NL4-3 reference sequence and this revealed only three unique mutations in the dCA-induced latent virus sequence (see Fig. S5D). This limited mutation profile is characteristic of chronically infected cells, in which rates of replication are low. Two of these mutations, one in a noncoding region (G771A) and one encoding a K314R change, are not known to impair HIV replication. A third mutation, S173A in the Gag region, is rare (5% of subtype B virus) and known to be compensatory for Gag-specific CD8+ T-lymphocyte response escape mutant R264K (67). Together, our results demonstrated that the potent PMA-iono stimulus was not sufficient to reactivate viral production in HeLa-CD4 cells treated with dCA, but that viral production could be rescued by exogenous Tat production. Furthermore, we did not identify mutations that would impair the fitness of the latent virus, indicating that transcriptional inhibition established by long-term treatment with dCA results from loss of Tat activity and not from positive selection of proviruses incompetent for replication.
Both TNF-α and the PKC agonist prostratin trigger the NF-κB pathway and activate HIV transcription (68, 69). HDAC inhibitors, such as suberoylanilide hydroxamic acid (SAHA), are known activators of HIV production in latently infected cell lines and primary cells (70). To substantiate the results found with HeLa-CD4 cells, OM-10.1 cells (illustrated in Fig. 2B) were stimulated with SAHA, TNF-α, or prostratin in the presence of ARVs and either DMSO or 100 nM dCA (Fig. 5A). Similarly, J-Lat cells were activated in the presence of DMSO or dCA at 100 nM (Fig. 5B and C). Viral reactivation by all stimulators was potently blocked when dCA was present, by 78 to 97% in OM-10.1 cells (Fig. 5A), 74 to 78% in J-Lat clone 10.6 cells (Fig. 5B), and 88 to 90% in J-Lat clone 6.3 cells (Fig. 5C). Together, our results demonstrate that dCA inhibits viral transcription from several cell line models of latency by establishing a long-lasting state of latency refractory to viral reactivation by standard latency-reversing agents (LRAs; HDAC inhibitors, PKC activators, and cytokines).
FIG 5 .

dCA inhibits viral reactivation from several models of latency. (A) dCA-mediated viral latency in OM-10.1 cells is refractory to reactivation by SAHA, TNF-α, or prostratin. Cells (DMSO controls or treated with dCA at 10 nM) (shown in Fig. 2B) were activated in the presence of ARVs with SAHA or TNF-α for 24 h or prostratin (pros) for 9 h, plus 100 nM dCA for the dCA-treated cells. Supernatant was collected at the end of the activation period and analyzed in a p24 ELISA. Data are presented as means ± SD of two independent activation experiments performed at days 219 and 226 post-dCA treatment (n = 5). (B and C) dCA inhibits viral reactivation from J-Lat 10.6 and 6.3 clones. At day 0, these clones were activated with SAHA, TNF-α, or prostratin in the presence or absence of 100 nM dCA for 24 h. SAHA was not able to activate J-Lat 6.3 above the limit of detection of the assay. Viral production was analyzed and is presented as described for panel in A, as means of two independent activation experiments (n = 4). Percentages represent the percent inhibition. The two-tailed paired t test was used for statistical comparisons. ND, not detectable.
Latent cell lines containing Tat/TAR-deficient proviruses are insensitive to dCA.
To confirm that dCA inhibits HIV-1 transcription in a Tat-dependent manner, we took advantage of the ACH-2 (T-lymphocyte) (71, 72) and U1 (promonocyte) (73) cell lines that contain proviruses that are, respectively, TAR or Tat deficient. The provirus in ACH-2 cells contains a C37T point mutation in TAR that renders the provirus insensitive to Tat activation (74, 75). U1 cells carry two proviruses, with suboptimal levels of Tat activity; one lacks the Tat ATG initiation codon, and the other contains an H13L mutation in Tat that impairs the recruitment of P-TEFb (74, 76, 77). The Tat/TAR deficiency in these cell lines is responsible for their latent phenotype, which manifests as a predominance of nonprocessive viral transcripts (78, 79). In these Tat/TAR-restricted environments, dCA had no effect on viral mRNA production and only a modest impact on p24 production in ACH-2 and U1 cell lines treated for 33 and 38 days, respectively (Fig. 6A and B). As with other cell lines, no dCA toxicity or cytostatic effects were detected (see Fig. S6 in the supplemental material).
FIG 6 .

dCA does not affect HIV-1 transcription in the ACH-2 or U1 models of HIV latency. (A and B) ACH-2 and U1 cells were infected with a virus with a mutant TAR or Tat, respectively (left panels). To analyze the effect of dCA on viral production in ACH-2 and U1 cells, cells were split and treated every 3 days on average with or without 10 nM dCA. Capsid production was quantified in a p24 ELISA. Data were normalized for each point to results with the DMSO control (as 100%) and are presented as means ± SD of three independent experiments. For analysis of the effects of dCA and time, a two-way repeated-measures ANOVA was performed. For ACH-2 cells (A), significant effects of dCA treatment (**, P = 0.0037) and time (***, P < 0.0002) are shown. For U1 cells (B), significant effects of dCA treatment (**, P = 0.0065) are shown. After post hoc Bonferroni correction (n = 3 per group), the statistical significance of results is indicated as follows: NS, nonsignificant; *, P < 0.05; **, P < 0.01; ***, P < 0.001; ****, P < 0.0001 (right panels). dCA does not inhibit viral transcription in ACH-2 or U1 cells. On the indicated day, viral mRNA was extracted and analyzed by RT-qPCR using Gag-Pol primers. RT-qPCR data are presented as means ± SD and are representative of at least two independent experiments. (C and D) dCA does not inhibit viral reactivation in ACH-2 or U1 cells. Cells were grown for 15 days with ARVs and in the presence or absence of dCA at 10 nM. At days 9 and 15, DMSO-treated (blue) or dCA-treated (red) cells and also treated with ARVs were activated with SAHA, TNF-α, or prostratin for 24 h in the presence or absence of 100 nM dCA. Supernatant was collected at the end of the activation period and analyzed in a p24 ELISA. Data are presented as means ± SD of two independent activation experiments performed at days 9 and 15 (n = 4) except for U1 cells (SAHA and prostratin treatments, for which n = 2, due to the use of a different activation protocol at day 9). Percentages indicate the percent inhibition. The two-tailed paired t test was used for statistical comparisons. ND, not detectable.
ACH-2 and U1 were then grown for 15 days in the presence of ARVs and DMSO or 10 nM dCA and stimulated with SAHA, prostratin, or TNF-α at days 9 and 15, followed by quantification of p24 antigen in supernatants (Fig. 6C and D). As expected, the reactivation of ACH-2 or U1 cells by all activators was only very modestly inhibited by dCA (between 21 and 44% reduction) (Fig. 6C and D). The origin of the small effect of dCA on the U1 cell line may be explained by the inhibition of the residual transcriptional activity of the mutated Tat, which still possesses an intact basic domain, the binding site for dCA (48). Moreover, in both U1 and ACH-2 cells, dCA may inhibit other functions of Tat that enhance HIV transcription, such as the recruitment by Tat of chromatin remodeling factors, e.g., SWI/SNF, an interaction mediated by the acetylated lysine 50 at the Tat basic domain (36, 37, 39). Finally, it cannot be ruled out that dCA may have Tat/TAR-independent effects. However, we previously demonstrated via an LTR reporter assay that, in the absence of Tat, dCA does not interfere with basal transcription nor with the activation pathway mediated by NF-κB when stimulated with TNF-α or PMA (48). Altogether, our results demonstrate that dCA can block viral reactivation from latently infected cells with competent Tat/TAR activity and has only limited activity when the Tat feedback loop is impaired.
dCA treatment limits viral rebound and reactivation in expanded primary CD4+ T cells derived from infected individuals.
In Fig. 1, we show that viral rebound after antigenic stimulation was reduced by dCA treatment ex vivo of primary CD4+ T cells. In order to test the hypothesis that dCA treatment can prevent viral rebound upon ART termination in primary cells, we used in vitro-expanded primary CD4+ T cells from virally suppressed HIV-infected individuals. CD4+ T cells were initially expanded from two subjects (subjects A and B in Fig. 1) in the presence of IL-2, phytohemagglutinin (PHA), “feeder cells,” or with ARVs alone or ARVs together with dCA. From day 7 on, CD4+ T cells were cultured in the presence of IL-2 and ARVs or with ARVs and dCA (Fig. 7A), and viral production was monitored by an ultrasensitive RT-qPCR every 7 days. In the expanded cells model, viral production usually decreased to low or undetectable levels by day 22 (see Fig. S7A in the supplemental material). To measure HIV rebound after treatment interruption in vitro, cells were washed at day 22 and kept with or without ARVs, in the presence of absence of dCA. Viral genomic RNA in the supernatant was measured 6 days later. In the presence of ARVs with or without dCA, no or low-level viral production was observed in cells from both subjects (Fig. 7B). When all drugs were removed, viral rebound was readily observed in CD4+ T cells previously expanded in ARVs, but it was dramatically reduced in CD4+ T cells previously expanded in the presence of dCA (magnitude of the rebound of ARVs versus ARVs plus dCA cell lines, 93.5% and 93.1% for cells A and B, respectively) (Fig. 7B). The ARVs with or without dCA treatment did not affect the viability of the expanded CD4+ T cells (see Fig. S7B).
FIG 7 .

dCA maintains a state of latency and blocks reactivation in primary expanded CD4+ T cells. (A) Schematic of generation of expanded CD4+ T cells and reactivation. CD4+ T cells were sorted from patient PBMCs and initially expanded with 1 µg/ml PHA, 100 U/ml IL-2, and irradiated autologous feeder PBMCs. Cells were then grown for 22 days in the presence of IL-2 and either ARVs alone or ARVs plus 100 nM dCA. At day 22, cells were split into 6 groups and either stimulated with prostratin or nonstimulated, with treatment stopped (TS) or continued for an additional 6 days before measuring HIV RNA viral production. (B) Limited viral rebound upon dCA removal in expanded primary CD4+ T cells derived from patients A and B. At day 22, the ARVs or ARVs plus dCA cultured CD4+ T cells were washed, and all drugs were removed. Particle-associated HIV genomic RNAs were quantified by RT-qPCR at day 6 after TS (day 28). (C) Inhibition of viral reactivation upon prostratin stimulation in primary CD4+ T cells expanded in the presence of dCA. At day 22, the ARVs or ARVs plus dCA cultured CD4+ T cells were stimulated with prostratin or left unstimulated. Quantification was done as described for panel B (day 28). ND, nondetected. Data are presented as means ± standard errors of the means (n = 2).
Using these expanded primary cell models, we also assessed whether long-term treatment with dCA impacted viral reactivation. Therefore, at day 22, cells were activated with the PKC activator prostratin. Culturing the cells in the presence of dCA dramatically inhibited prostratin-mediated reactivation by more than 99.9% in both expanded cells (Fig. 7C). These results further support results obtained in Fig. 1 that show cells from subjects A and B drastically suppressing reactivation by anti-CD3/CD28 antibodies.
Collectively, our results show that a long-term in vitro treatment of primary CD4+ T cells with the Tat inhibitor dCA establishes a state of latency that renders the provirus almost incapable of reactivation. Thus, treatment with dCA establishes a state of transcriptional repression resulting in potent abrogation of viral reactivation from latency, even when drugs are withdrawn, implicating long-lasting repression of HIV promoter activity.
DISCUSSION
Our findings provide a proof of concept that a small-molecule Tat inhibitor, such as dCA, can potently inhibit residual HIV-1 levels of viral transcription in latently infected cells and block events of viral reactivation. We have shown in several latently infected cell lines (Fig. 2), as well as in primary cells derived from HIV-infected individuals (Fig. 7), that dCA establishes a state of latency with an extremely impaired ability to reactivate. This state is characterized by a significant inhibition of an already low level of residual transcription, which results in a marked reduction in viral mRNA levels. Furthermore, given the transcription-repressed nature of the promoter following dCA treatment, viral reactivation becomes extremely inefficient (Fig. 4 and 5). Indeed, in latently infected primary CD4+ T cells isolated from nine HIV-infected subjects on suppressive ART, dCA reduced an average of 92.3% of the robust viral reactivation initiated by anti-CD3/CD28 stimulation (Fig. 1). We speculate that weaker stimulation of the type that latently infected cells would encounter in vivo would be inhibited to a greater extent by dCA.
Given the difficulty to perform biochemical studies with primary cells, especially when the ratio of latently infected cells is approximately 1 per 106 uninfected cells (6), we do not yet have direct evidence that the promoter upon dCA exposure is epigenetically repressed. However, because of the different lines of evidence, such as the lack of RNAP II recruitment to the HIV promoter and ORF (Fig. 3), lack of viral rebound upon dCA discontinuation (Fig. 2A), and blocked reactivation (Fig. 1, 4, 5, and 7), it appears that access to the promoter is altered, implicating epigenetic modifications. There are two possible mechanisms by which dCA exerts its effect: (i) dCA simply accelerates the establishment of typical proviral latency by facilitating the corresponding epigenetic modifications; (ii) because dCA blocks a subset of the multiple Tat activities, it may result in unique epigenetic changes. For example, dCA may block binding of Tat to SWI/SNF (36), p300 (43), or C/EBP (80), dependent on Tat’s basic domain, but not P-TEFb (18), hGCN5 (41), PP1 (81), or DNA-PK (82), which bind to other regions of Tat and are all involved in chromatin remodeling or transcriptional activity. In future studies it will be important to describe which of these possibilities accounts for dCA’s suppression of reactivation.
HIV-1 lacking Tat undergoes some basal transcription, but it does not sustain a spreading infection (83). Early studies have shown that Tat-deficient mutants are frequently observed in peripheral blood mononuclear cells (PBMCs) isolated from infected individuals (84, 85) and that latently infected CD4+ T cells from subjects on ART are enriched for HIV-1 variants with impaired Tat activity (46). It has been speculated that a cause for entrance into latency results from low levels of P-TEFb and the presence of Tat mutants that still retain partial transcriptional activity to various extents, and therefore could be subject to stochastic reactivation (77). Moreover, an in vitro study showed that infected Jurkat cells overexpressing wild-type Tat had significantly fewer latent proviruses than regular infected Jurkat cells (86). Finally, a recent and very elegant study demonstrated that the Tat feedback loop is sufficient to regulate the passage from active viral production to the entrance into latency, independently of the CD4+ T cell activation state (45). Additionally, the study showed that Tat-mediated reactivation from latency was 300% more efficient than that triggered by cellular activation. Together, these results argue that the use of Tat inhibitors would only benefit current therapy strategies by rendering Tat inefficient, provoking entrance of the provirus into a prolonged transcriptional silencing, preventing viral rebound, and maintaining a permanent state of latency.
Limitations of current primary cell models of latency include the use of clonal HIV laboratory strains (59, 60), reliance on different cytokine cocktails to drive cells into latency, or use of transduction vectors (55). Here, we used expanded primary CD4+ T cells from HIV-infected subjects carrying autologous virus, which returns to a resting state after 3 weeks in culture (Fig. 7). In this model, cells spontaneously stop producing HIV particles but can be reinduced to produce virus after stimulation. Using this system, we confirmed our results obtained with primary CD4+ T cells from virally suppressed individuals (Fig. 1) and extended the results to show that dCA blocks viral reactivation with the PKC activator prostratin (Fig. 7). Most importantly, this system allowed us to demonstrate that dCA can block or at least significantly delay viral rebound upon ART discontinuation. These results suggest that a different set of epigenetic modifications is established at the HIV promoter when dCA promotes latency.
The most commonly explored strategy for HIV eradication is dubbed “kick and kill,” which attempts to purge the viral reservoirs by using LRAs such as HDAC inhibitors, while simultaneously preventing additional rounds of infection by maintaining ART (87, 88). This approach is based on the assumption that reactivation will prompt elimination of infected cells by cytopathic effects and/or lysis mediated by HIV-1-specific cytolytic T lymphocytes (89). Despite an initial success using the HDAC inhibitor SAHA to reactivate the virus in several patients, the size of the viral reservoir was unchanged (87, 90). Moreover, a recent study demonstrated that the barrier to cure has increased, as the latent reservoir size is believed to be 60-fold larger than previously estimated from the results of a viral outgrowth assay (35). Given the stochastic nature of latent provirus reactivation, multiple activations would be required without the assurance of complete reactivation of the latent reservoir, a prerequisite to a sterilizing cure.
Our results highlight an alternative approach to the “kick and kill” strategy. In this model (Fig. 8), a Tat inhibitor blocks the Tat feedback loop that is initiated after low-level basal reactivation and drives the viral promoter into more complete transcriptional inhibition. dCA treatment combined with ART would delay or halt viral replication, reactivation, and replenishment of the latent viral reservoir. Thus, the latent pool of cells in an infected individual would be stabilized, and death of the long-lived infected memory T cells could result in a continuous decay of this pool over time, possibly culminating in a sterilizing cure. It was previously demonstrated that the decay of the viral reservoir in patients with no “blips,” or episodes of clinically detectable viremia, was faster than in patients with blips (6, 91). These results argue that reducing low-level viremia and replenishment may reduce the half-life of the viral reservoir and reinforce the rationale for the inclusion of a Tat inhibitor in eradication strategies.
FIG 8 .
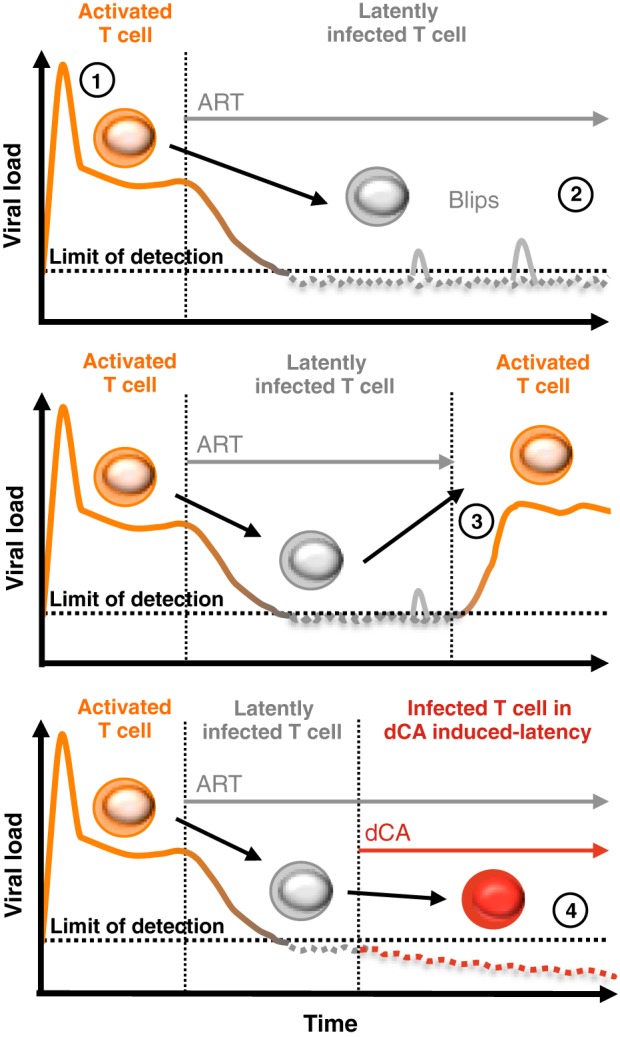
Hypothetical approach to a functional HIV cure. (1) Upon HIV infection, there is a sharp increase of the viral load in circulating plasma of infected individuals. (2) The viral load sharply decreases to below the limit of detection (<50 copies/ml) during an ART regimen, but episodes of detectable viremia “blips” are commonly observed. Most of the infected cells remain latently infected, and if ART is discontinued (3), there is an immediate resurgence of virus correlating with CD4+ T cell reactivation (4). The addition of a Tat inhibitor such as dCA to an ART regimen could promote and maintain a state of latency, possibly allowing for ART interruption without viral rebound. dCA may also prevent reservoir replenishment. With time, patients may potentially observe a reduction in the size of the viral reservoir and relief from chronic inflammation caused by ongoing low-level virus production.
MATERIALS AND METHODS
Cell lines and cell culture.
HeLa-CD4 cells were provided by Uriel Hazan (Université de Cachan, France). The population of latently infected HeLa-CD4 cells was obtained by infecting naive cells with NL4-3 virus and passaging cells until residual p24 production was observed (<500 pg/ml). The following reagents were obtained through the NIH AIDS Reagent Program, Division of AIDS, NIAID, NIH: efavirenz, zidovudine, raltegravir, and lamivudine. OM-10.1 cells (59) were obtained from Salvatore Butera, ACH-2 cells (71, 72) and U1 cells (73) came from Thomas Folks, and J-Lat full-length clones (6.3 and 10.6) (60) were obtained from Eric Verdin. HeLa-CD4 cells were cultured in Dulbecco’s modified Eagle’s medium supplemented with 5% fetal bovine serum (FBS) and PSG (penicillin [100 units/ml], streptomycin [100 µg/ml], and l-glutamine [2 mM]). OM-10.1, U1, ACH-2, and J-Lat clones are cultured in Roswell Park Memorial Institute 1640 medium with 10% FBS and PSG. All cells were cultured at 37°C and 5% CO2.
Passaging of latently infected cells.
Latently infected HeLa-CD4 cells were seeded at 1 × 10⁶ cells per 10-cm2 culture dish. OM-10.1, ACH-2, and U1 cells were seeded at 1 × 10⁵ to 2.5 × 10⁵ cells/ml, and J-Lat clones were seeded at 5 × 10⁵ cells/ml. All cells were passaged every 3 days on average at the indicated concentrations of dCA or DMSO. OM-10.1, ACH-2, and U1 were grown also in the presence of ARVs (200 nM lamivudine, 200 nM raltegravir, 100 nM efavirenz) (Fig. 2B, 5A, and 6C and D).
Latent viral reactivation.
Latently infected HeLa-CD4 cells were treated with PMA (20 nM) and iono (2 µM) for 24 h with 10 nM dCA or DMSO. ACH-2 and U1 were cultured for 15 days in the presence of ARVs and in the presence or absence of dCA at 10 nM (Fig. 6C and D). At days 9 and 15, ACH-2 cells (5 × 10⁵ cells/ml) were activated for 24 h with SAHA (1 µM) or TNF-α (10 ng/ml) or for 9 h with prostratin (5 µM) in 100 nM dCA or DMSO. U1 cells were grown and activated similarly, with SAHA (2.5 µM), TNF-α (10 ng/ml), or prostratin (1 µM) for 24 h. OM-10.1 cells were grown and activated similarly at days 219 and 226 (Fig. 5A). At day 0, J-Lat clones (5 × 10⁵ cells/ml) were activated with SAHA (1 µM), TNF-α (10 ng/ml), or prostratin (1 µM) for 24 h (Fig. 5B and C). p24 production in the supernatant was determined in an ELISA.
Western blot analysis.
Original uninfected HeLa-CD4 cells and latently infected HeLa-CD4 cells (treated either with DMSO or 10 nM dCA) were activated or not with PMA (20 nM) and iono (2 µM) for 30 min. Cells were lysed (lysis buffer of 20 mM HEPES [pH 8.0], 100 mM KCl, 0.2 mM EDTA, 5 mM β-mercaptoethanol, 0.1% IGEPAL CA-630, 10% glycerol, 10 mM sodium fluoride, 1 mM sodium orthovanadate, and Complete EDTA-free protease inhibitor cocktail [Roche]), and the lysate was centrifuged at 18,000 × g for 10 min at 4°C. The protein concentration in the supernatant was quantified with the Bio-Rad protein assay (catalog number 500-0006). Total protein extracts were separated by SDS-PAGE and transferred onto polyvinylidene difluoride membranes. Membranes were probed with an anti-β-actin mouse monoclonal antibody (MAb) from Sigma (catalog number A5441) or MEK1/2 rabbit polyclonal Ab (9122), phospho-MEK1/2 (Ser217/221) rabbit polyclonal Ab (9121), p44/42 mitogen-activated protein kinase (MAPK; ERK1/2) mouse MAb (9107), or phospho-p44/42 MAPK (ERK1/2; Thr202/Tyr204) rabbit MAb (4370) from Cell Signaling. The membranes were incubated in horseradish peroxidase-conjugated anti-mouse or anti-rabbit IgG goat polyclonal antibodies as secondary antibodies. Bands were visualized by using the enhanced chemiluminescence Western blotting system (Amersham).
Tat transfection.
pGL4.74-Tat(101)-F-wt expressing Flag-tagged 101-amino-acid Tat was generated by PCR as previously described (48). To reactivate the latent virus in HeLa-CD4 cells, 1 × 10⁶ cells were seeded and transfected 24 h later with 5 µg of pGL4.74-Tat(101)-F-wt or the empty vector control in the presence or absence of 10 nM dCA. Viral production in the supernatant was quantified every 3 days via a p24 ELISA.
p24 ELISA.
Quantification of HIV p24 capsid production was performed using the antigen capture assay kit from Advanced BioScience Laboratories, Inc. (catalog number 5447), according to the manufacturer’s protocol.
RT-qPCR analysis of cell-associated RNA.
Total RNA was prepared using the RNeasy kit (Qiagen). First-strand cDNA was prepared from total RNA with oligo(dT) using a SuperScript III kit (Invitrogen). RT-qPCR was performed with the cDNA, using a LightCycler 480 SYBR Green I Master system (Roche). Analyses were performed in triplicate, and the mean RNA expression levels were normalized to viral mRNA expression of glyceraldehyde-3-phosphate dehydrogenase (GAPDH). All reactions had a negative control in which no reverse transcriptase was added. The GAPDH reference gene was amplified using the primers 5′-GAPDH/3′-GAPDH. NL4-3 amplification (Vpr) was performed using the primers P10/P11 (see Table S1 in the supplemental material). OM-10.1, U1, ACH-2, and J-Lat clone cDNA analyses were performed using the primers GagPol-For/GagPol-Rev (see Table S1). IL-1β mRNA analysis was performed using the primers IL-1β-For/IL-1β-Rev (see Table S1).
Quantification of integration events.
Genomic DNA (gDNA) was prepared from 2 × 10⁶ HeLa-CD4 or OM-10.1 cells by using the DNeasy blood and tissue kit (Qiagen). Integration events were quantified by Alu-Gag PCR (Alu/P9) for HeLa-CD4 cells or Alu/GagPol-Rev cells for OM-10.1, followed by nested qPCR with P6/P8 or GagPol-For/GagPol-Rev, respectively (see Table S1 in the supplemental material). The cycling conditions for the Alu-PCR included an initial denaturation (94°C for 2 min), followed by 20 cycles of amplification (94°C for 20 s, 50°C for 10 s, and 65°C for 3.5 min) and a final elongation step (65°C for 7 min).
Mitochondrial metabolic activity assay.
The assay for mitochondrial metabolic activity utilized 3-(4,5-dimethylthiazol-2-yl)-2,5-diphenyltetrazolium bromide (MTT) and was performed in the presence of increasing concentrations of dCA according to the manufacturer’s protocol (ATCC).
Chromatin immunoprecipitation assay.
The chromatin immunoprecipitation (ChIP) assay was performed as previously described (48) with small modifications detailed here. Briefly, latently infected and dCA-induced latently infected HeLa-CD4 cells were grown in DMSO or 10 nM dCA, respectively. Positive and negative controls were generated, respectively, by exposing DMSO-treated cells to TNF-α (10 ng/ml) for 8 h or α-amanitin (5 µg/ml) for 48 h. Cells were cross-linked with 1% formaldehyde. Pellets of 1 × 10⁷ cells were sonicated 18 times for 10-s bursts on ice to generate sheared chromatin of 200 to 500 nucleotides. The equivalent of 3 × 10⁶ cells was used for each IP assay with anti-RNAP II (catalog number 05-623; Millipore) or nonspecific rabbit immunoglobulin G (IgG; p120-301; Bethyl). The equivalent of 10% chromatin was saved as an input control. Immunoprecipitated DNA was eluted with elution buffer (20 mM Tris-HCl [pH 7.5], 5 mM EDTA, 200 mM NaCl, 1% sodium dodecyl sulfate) containing 1 mg/ml of proteinase K. Samples were incubated for 1 h at 42°C and then 2 h at 65°C. PK was inactivated at 95°C for 15 min. DNA samples were reverse cross-linked overnight at 65°C. After 1 h of RNase A treatment at 37°C, the DNA was purified by using PCR Clean (Promega). Primers used were Nuc-0 (P1/P2), Pro (P3/P4), Nuc-1 (P5/P7), and Vpr (P10/P11) (see Table S1 in the supplemental material). The GAPDH gene was used as the reference gene. The promoter and ORF of GAPDH were amplified using, respectively, GAPDH-Pro-For/GAPDH-Pro-Rev and GAPDH-ORF-For/GAPDH-ORF-Rev (see Table S1). Input (10%) was used to standardize the values obtained. The relative proportions of coimmunoprecipitated DNA fragments were determined on the basis of the threshold cycle (CT) for each qPCR product. The data sets were normalized to input values {percent input = 2[CT(input) − CT(IP)] × 100}. The average value of the IgG background for each primer was subtracted from the raw data.
Bisulfite conversion and quantification of methylated cytosine.
gDNAs were extracted using the DNeasy blood and tissue kit (Qiagen) from 5 × 10⁶ latently infected HeLa-CD4 cells treated with DMSO or dCA for 178 days (Fig. 2A) or from cells acutely infected with HIV NL4-3 for 3 days. gDNA (4 µg) was digested overnight at 37°C with 60 units of EcoRV, SpeI, and SalI. After gel purification, 400 ng of the digested gDNA was used for bisulfite conversion of the cytosines by using the MethylCode bisulfite conversion kit (Invitrogen) following the manufacturer’s protocol. The region containing CpG islands 1 and 2 was amplified by PCR in triplicate to avoid the selection of a unique clone. Bisulfite-converted DNA (1 µl) and the following cycling conditions were used: an initial denaturation (95°C for 10 min), followed by 40 cycles of amplification (95°C for 30 s, 55°C for 60 s, and 72°C for 60 s), and a final elongation step (72°C for 10 min) and using the primers B1/B4. Triplicates were pooled. A nested PCR in triplicate to amplify individually each CpG was performed using the same cycling conditions and the primers B1/B2 (CpG1) and B3/B4 (CpG2) (see Table S1 in the supplemental material). Resulting single-banded PCR products of each triplicate sample were pooled and TOPO cloned using the TOPO TA cloning kit (Invitrogen). Nine clones for each condition were submitted for sequencing using standard M13F and M13R primers (Operon). Only PCR clones with at least 95% conversion of cytosines outside CpGs were taken into account.
HIV-infected subjects.
Nine HIV-seropositive patients on stable suppressive ART for at least 3 years were enrolled in this study. All subjects signed informed consent forms approved by the Oregon Health and Science University and the Martin Memorial Health Systems (Stuart, FL) or by the Royal Victoria Hospital and the CR-CHUM Hospital (Montreal, Quebec, Canada) review boards. All patients underwent leukapheresis to collect large numbers of PBMCs.
Viral reactivation from CD4+ T cells isolated from virally suppressed subjects.
In an effort to assess the effect of dCA on latency, we selected patient samples with CD4+ T cells that did not display detectable levels of spontaneous viral production when cultured in vitro but which robustly released virus upon antigenic stimulation. Total CD4+ T cells were isolated from PBMCs of nine virally suppressed subjects by using magnetic bead-based negative selection (StemCell Technologies). Isolated CD4+ T cells (5 × 10⁶ cells per well) were cultured in the presence of ARVs (100 nM efavirenz, 180 nM zidovudine, 200 nM raltegravir). Cells were stimulated with Dynabeads human T-expander CD3/CD28 (Invitrogen) at a concentration of one bead per cell in the presence or absence of dCA (100 nM). Medium was harvested every 3 days for quantification of viral particles and replaced with fresh medium containing ARVs and dCA when appropriate. Freshly collected cell culture supernatants were centrifuged for 1 h at 25,000 × g to pellet HIV particles. Viral RNA at day 6 was extracted using the Qiamp viral RNA kit (Qiagen) and quantified using an ultrasensitive seminested real-time RT-qPCR with a detection limit of a single copy of HIV RNA. Extracted viral RNA was reverse transcribed and subjected to 16 cycles of amplification with the primers O1/O2. Preamplified products were diluted and subjected to a nested real-time PCR for 40 cycles on a Rotor-Gene Q apparatus and using the primers O3/O4 and probe (see Table S1 in the supplemental material). In all experiments, serial dilutions of HIV particles (LAI strain) in culture medium were processed in parallel with experimental samples. A paired Student’s t test was performed to test for statistical significance (Fig. 1).
Generation of expanded CD4+ T cells from subjects A and B.
We expanded primary CD4+ T cells from two successfully treated donors, subjects A and B (Fig. 1) after at least 3 years on ART. For that, 50 × 106 PBMCs previously collected were thawed, and sorted CD4+ T cells were initially expanded with 1 µg/ml of PHA, 100 U/ml of IL-2, irradiated feeder PBMCs, and either ARVs alone or ARVs plus 100 nM dCA in medium supplemented with human serum for 22 days. After 7 days, the cells were cultured only with IL-2 and the indicated drugs. At day 22, CD4+ T cells were split into 6 groups for 6 different conditions and either stimulated with 1 µM prostratin or nonstimulated, treatment stopped (TS), or continued for an additional 6 days before measuring HIV RNA viral production by ultrasensitive RT-qPCR in the supernatant. Cell viability was monitored weekly using trypan blue dye exclusion staining.
Statistical analysis.
Statistics were performed with GraphPad Prism, and a P value of ≤0.05 was considered significant for all comparisons. The two-tailed paired Student’s t test was used when applicable. In Fig. 2D and 6A and B, data were normalized for each point to 100% of the DMSO control and are reported as the means ± standard deviations (SD) of three independent experiments (n = 3). Comparisons between data from vehicle- and dCA-treated cell lines were performed using a two-way analysis of variance (ANOVA) repeated-measures test. The Bonferroni correction was used for post hoc analysis.
SUPPLEMENTAL MATERIAL
Effect of dCA on latently infected HeLa-CD4 cells. (A) dCA inhibits HIV replication in chronically infected HeLa-CD4 cells. Chronically infected HeLa-CD4 cells were treated for 6 days with DMSO, ARVs (raltegravir at 200 nM, lamivudine at 200 nM, efavirenz at 100 nM) or dCA at 10 nM. Supernatants were analyzed in a p24 ELISA at day 6. (B) Effect of dCA on HeLa-CD4 cell number. The number of cells was determined along with the experiments depicted in Fig. 2A. Cells were treated with DMSO or dCA at the indicated concentrations. Data are representative of two independent experiments. (C) dCA does not accumulate in HeLa-CD4 cells. Pellets of 12 × 106 cells were collected from cells continuously treated with DMSO or dCA at 10 nM, or treatment was stopped and cultures were split 3 or 11 times before collection. After lysis of the cells in 33% water–66% acetonitrile, the supernatant was analyzed by liquid chromatography-mass spectrometry. Limit of detection, 4.3 fmol/106 cells. ND, nondetectable; TS, treatment stop. (D) Integration events upon treatment in HeLa-CD4 cells. gDNA extracted at the indicated days (see Fig. 2A) was amplified by Alu-PCR followed by a nested qPCR. Integration events are reported as the fold change compared to DMSO controls. qPCR data are presented as means ± SD. HI, heat inactivated. Download
Effect of dCA on latently infected OM-10.1 and J-Lat cell lines. (A) Integration events upon dCA treatment in OM-10.1 cells. gDNA extracted at day 202 (from OM-10.1 cells [see Fig. 2B]) was amplified by Alu-PCR followed by a nested qPCR. Integration events are reported as the fold change compared to the DMSO control. Data are representative of four analyses at days 9, 49, 99, and 202. qPCR data are presented as means ± SD. (B) Effect of dCA on cell number in the indicated cell lines. Cell number was determined along with the experiments depicted in Fig. 2B to D. Data are presented as means ± SD of two or three independent experiments for J-Lat 10.6 (n = 3) and J-Lat 6.3 (n = 2) clones. (C) Toxicity of dCA was assessed in the indicated cell lines in an MTT assay. A total of 25,000 cells per well were treated for 48 h with DMSO or 0.1 nM to 10,000 nM dCA, and cell proliferation was assessed in the MTT assay. Data are presented as means ± SD of three independent experiments (n = 9) for OM-10.1 cells and two independent experiments (n = 6) for J-Lat clones. Download
TNF-α activation of latently infected HeLa-CD4 cells. Activation for 72 h by TNF-α (10 ng/ml) of latently infected and DMSO-treated HeLa-CD4 cells at day 180 (see Fig. 2A). Supernatant at day 183 was analyzed in a p24 ELISA. Download
CpG hypermethylation does not maintain a state of transcriptional repression during normal or dCA-induced latency in HeLa-CD4 infected cells. At day 178, gDNAs of latent, dCA-induced latent, and acutely infected HeLa-CD4 cells were converted with the bisulfite method (see Fig. 2A). After amplification by nested PCR, the converted DNA was TOPO cloned. Nine clones were sequenced per condition. Non-CpG cytosine bisulfite conversion ranged from 95 to 100% for each clone. Data are representative of two independent experiments. Download
Long-term-treated HeLa-CD4 cells are equally susceptible to PMA-iono activation, and dCA-induced latent viruses are replication competent. (A) Susceptibility to PMA activation. Uninfected cells and long-term-cultured HeLa-CD4 cells treated with DMSO (latency) or with dCA at 10 nM (dCA-induced latency) were activated for 24 h. IL-1β mRNA production was quantified from cDNAs prepared from total RNA extracted at day 154. Results were normalized as mRNA copies per GAPDH mRNA copy. Viral mRNA generated in nonactivated (NA) controls was set to 1. Data are presented as means ± SD of two biological duplicates. (B) Susceptibility to PMA activation. The same cells grown for 140 days (see Fig. 2A) were activated for 30 min with PMA and iono. As a control, uninfected HeLa-CD4 cells were activated similarly. Western blot analysis was performed with the indicated antibodies. The results are representative of two independent experiments performed at days 140 and 145. (C) Latent and dCA-induced latent viruses are replication competent and can be inhibited by dCA in newly infected cells. Viruses produced after Tat transfection of latent and dCA-induced latent cells at day 178 were used to infect naive HeLa-CD4 cells (see Fig. 4B). After passaging the cells within a month, a state of chronicity was observed. Chronic cells were treated for 72 h with DMSO or 10 nM dCA before the supernatant was analyzed in a p24 ELISA. (D) Unique mutations of the sequenced gDNA from dCA-induced latent virus at day 178. Download
Toxicity and cytostatic effects were assessed in ACH-2 and U1 cells. (A) Effect of dCA on cell number. Cell numbers from the indicated cell lines were determined along with the experiments depicted in Fig. 6. Cells were treated with DMSO or dCA at the indicated concentrations. Data are presented as means ± SD of three independent experiments (n = 3). (B) Toxicity of dCA was assessed for the indicated cell lines by MTT assay. A total of 25,000 cells per well were treated for 48 h with DMSO or 0.1 nM to 10,000 nM dCA, cell proliferation was assessed in an MTT assay. Data are presented as means ± SD of three independent experiments (n = 9). Download
Expanded CD4+ T-cell HIV production and viability. (A) HIV production from expanded CD4+ T cells. CD4+ T cells were expanded for 35 days and monitored for viral production weekly. HIV RNA viral production was below detection at 22 days postexpansion. (B) Viability of expanded CD4+ T cells. Cell viability was monitored weekly using trypan blue dye exclusion staining. Cells maintained greater than 90% viability. Download
List of primers and oligos.
ACKNOWLEDGMENTS
This work was supported by the National Institutes of Health (R01AI097012). R.F. is supported by amfAR, The Foundation for AIDS Research (fellowship no. 108264).
We are grateful to I. Usui, P. Baran, and Sirenas Marine Discovery for providing us with dCA. We thank M. Farzan, R. Derosiers, B. Torbett, and M. Clementz for helpful discussions and critical reading of the manuscript. We thank the AIDS Reagent Program for providing materials.
Footnotes
Citation Mousseau G, Kessing CF, Fromentin R, Trautmann L, Chomont N, Valente ST. 2015. The Tat inhibitor didehydro-cortistatin A prevents HIV-1 reactivation from latency. mBio 6(4):e00465-15. doi:10.1128/mBio.00465-15.
Contributor Information
Vicente Planelles, University of Utah School of Medicine.
Vinayaka R. Prasad, Albert Einstein College of Medicine.
REFERENCES
- 1.Chun TW, Finzi D, Margolick J, Chadwick K, Schwartz D, Siliciano RF. 1995. In vivo fate of HIV-1-infected T cells: quantitative analysis of the transition to stable latency. Nat Med 1:1284–1290. doi: 10.1038/nm1295-1284. [DOI] [PubMed] [Google Scholar]
- 2.Chun TW, Stuyver L, Mizell SB, Ehler LA, Mican JA, Baseler M, Lloyd AL, Nowak MA, Fauci AS. 1997. Presence of an inducible HIV-1 latent reservoir during highly active antiretroviral therapy. Proc Natl Acad Sci U S A 94:13193–13197. doi: 10.1073/pnas.94.24.13193. [DOI] [PMC free article] [PubMed] [Google Scholar]
- 3.Finzi D, Hermankova M, Pierson T, Carruth LM, Buck C, Chaisson RE, Quinn TC, Chadwick K, Margolick J, Brookmeyer R, Gallant J, Markowitz M, Ho DD, Richman DD, Siliciano RF. 1997. Identification of a reservoir for HIV-1 in patients on highly active antiretroviral therapy. Science 278:1295–1300. doi: 10.1126/science.278.5341.1295. [DOI] [PubMed] [Google Scholar]
- 4.Wong JK, Hezareh M, Günthard HF, Havlir DV, Ignacio CC, Spina CA, Richman DD. 1997. Recovery of replication-competent HIV despite prolonged suppression of plasma viremia. Science 278:1291–1295. doi: 10.1126/science.278.5341.1291. [DOI] [PubMed] [Google Scholar]
- 5.Finzi D, Blankson J, Siliciano JD, Margolick JB, Chadwick K, Pierson T, Smith K, Lisziewicz J, Lori F, Flexner C, Quinn TC, Chaisson RE, Rosenberg E, Walker B, Gange S, Gallant J, Siliciano RF. 1999. Latent infection of CD4+ T cells provides a mechanism for lifelong persistence of HIV-1, even in patients on effective combination therapy. Nat Med 5:512–517. doi: 10.1038/8394. [DOI] [PubMed] [Google Scholar]
- 6.Siliciano JD, Kajdas J, Finzi D, Quinn TC, Chadwick K, Margolick JB, Kovacs C, Gange SJ, Siliciano RF. 2003. Long-term follow-up studies confirm the stability of the latent reservoir for HIV-1 in resting CD4+ T cells. Nat Med 9:727–728. doi: 10.1038/nm880. [DOI] [PubMed] [Google Scholar]
- 7.Buzón MJ, Massanella M, Llibre JM, Esteve A, Dahl V, Puertas MC, Gatell JM, Domingo P, Paredes R, Sharkey M, Palmer S, Stevenson M, Clotet B, Blanco J, Martinez-Picado J. 2010. HIV-1 replication and immune dynamics are affected by raltegravir intensification of HAART-suppressed subjects. Nat Med 16:460–465. doi: 10.1038/nm.2111. [DOI] [PubMed] [Google Scholar]
- 8.Fletcher CV, Staskus K, Wietgrefe SW, Rothenberger M, Reilly C, Chipman JG, Beilman GJ, Khoruts A, Thorkelson A, Schmidt TE, Anderson J, Perkey K, Stevenson M, Perelson AS, Douek DC, Haase AT, Schacker TW. 2014. Persistent HIV-1 replication is associated with lower antiretroviral drug concentrations in lymphatic tissues. Proc Natl Acad Sci U S A 111:2307–2312. doi: 10.1073/pnas.1318249111. [DOI] [PMC free article] [PubMed] [Google Scholar]
- 9.Hatano H, Strain MC, Scherzer R, Bacchetti P, Wentworth D, Hoh R, Martin JN, McCune JM, Neaton JD, Tracy RP, Hsue PY, Richman DD, Deeks SG. 2013. Increase in 2-long terminal repeat circles and decrease in d-dimer after raltegravir intensification in patients with treated HIV infection: a randomized, placebo-controlled trial. J Infect Dis 208:1436–1442. doi: 10.1093/infdis/jit453. [DOI] [PMC free article] [PubMed] [Google Scholar]
- 10.Besson GJ, McMahon D, Maldarelli F, Mellors JW. 2012. Short-course raltegravir intensification does not increase 2 long terminal repeat episomal HIV-1 DNA in patients on effective antiretroviral therapy. Clin Infect Dis 54:451–453. doi: 10.1093/cid/cir721. [DOI] [PMC free article] [PubMed] [Google Scholar]
- 11.Kearney MF, Spindler J, Shao W, Yu S, Anderson EM, O’Shea A, Rehm C, Poethke C, Kovacs N, Mellors JW, Coffin JM, Maldarelli F. 2014. Lack of detectable HIV-1 molecular evolution during suppressive antiretroviral therapy. PLoS Pathog 10:e1004010. doi: 10.1371/journal.ppat.1004010. [DOI] [PMC free article] [PubMed] [Google Scholar]
- 12.Deeks SG, Lewin SR, Havlir DV. 2013. The end of AIDS: HIV infection as a chronic disease. Lancet 382:1525–1533. doi: 10.1016/S0140-6736(13)61809-7. [DOI] [PMC free article] [PubMed] [Google Scholar]
- 13.Dinoso JB, Kim SY, Wiegand AM, Palmer SE, Gange SJ, Cranmer L, O’Shea A, Callender M, Spivak A, Brennan T, Kearney MF, Proschan MA, Mican JM, Rehm CA, Coffin JM, Mellors JW, Siliciano RF, Maldarelli F. 2009. Treatment intensification does not reduce residual HIV-1 viremia in patients on highly active antiretroviral therapy. Proc Natl Acad Sci U S A 106:9403–9408. doi: 10.1073/pnas.0903107106. [DOI] [PMC free article] [PubMed] [Google Scholar]
- 14.Gandhi RT, Zheng L, Bosch RJ, Chan ES, Margolis DM, Read S, Kallungal B, Palmer S, Medvik K, Lederman MM, Alatrakchi N, Jacobson JM, Wiegand A, Kearney M, Coffin JM, Mellors JW, Eron JJ, AIDS Clinical Trials Group A5244 Team . 2010. The effect of raltegravir intensification on low-level residual viremia in HIV-infected patients on antiretroviral therapy: a randomized controlled trial. PLoS Med 7:e1000321. doi: 10.1371/journal.pmed.1000321. [DOI] [PMC free article] [PubMed] [Google Scholar]
- 15.Okamoto T, Wong-Staal F. 1986. Demonstration of virus-specific transcriptional activator(s) in cells infected with HTLV-III by an in vitro cell-free system. Cell 47:29–35. doi: 10.1016/0092-8674(86)90363-6. [DOI] [PubMed] [Google Scholar]
- 16.Selby MJ, Bain ES, Luciw PA, Peterlin BM. 1989. Structure, sequence, and position of the stem-loop in TAR determine transcriptional elongation by tat through the HIV-1 long terminal repeat. Genes Dev 3:547–558. doi: 10.1101/gad.3.4.547. [DOI] [PubMed] [Google Scholar]
- 17.Laspia MF, Rice AP, Mathews MB. 1989. HIV-1 Tat protein increases transcriptional initiation and stabilizes elongation. Cell 59:283–292. doi: 10.1016/0092-8674(89)90290-0. [DOI] [PubMed] [Google Scholar]
- 18.Mancebo HS, Lee G, Flygare J, Tomassini J, Luu P, Zhu Y, Peng J, Blau C, Hazuda D, Price D, Flores O. 1997. P-TEFb kinase is required for HIV Tat transcriptional activation in vivo and in vitro. Genes Dev 11:2633–2644. doi: 10.1101/gad.11.20.2633. [DOI] [PMC free article] [PubMed] [Google Scholar]
- 19.Wei P, Garber ME, Fang SM, Fischer WH, Jones KA. 1998. A novel CDK9-associated C-type cyclin interacts directly with HIV-1 Tat and mediates its high-affinity, loop-specific binding to TAR RNA. Cell 92:451–462. doi: 10.1016/S0092-8674(00)80939-3. [DOI] [PubMed] [Google Scholar]
- 20.Karn J. 2011. The molecular biology of HIV latency: breaking and restoring the Tat-dependent transcriptional circuit. Curr Opin HIV AIDS 6:4–11. doi: 10.1097/COH.0b013e328340ffbb. [DOI] [PMC free article] [PubMed] [Google Scholar]
- 21.Ott M, Geyer M, Zhou Q. 2011. The control of HIV transcription: keeping RNA polymerase II on track. Cell Host Microbe 10:426–435. doi: 10.1016/j.chom.2011.11.002. [DOI] [PMC free article] [PubMed] [Google Scholar]
- 22.Ghose R, Liou LY, Herrmann CH, Rice AP. 2001. Induction of TAK (cyclin T1/P-TEFb) in purified resting CD4(+) T lymphocytes by combination of cytokines. J Virol 75:11336–11343. doi: 10.1128/JVI.75.23.11336-11343.2001. [DOI] [PMC free article] [PubMed] [Google Scholar]
- 23.Kinoshita S, Chen BK, Kaneshima H, Nolan GP. 1998. Host control of HIV-1 parasitism in T cells by the nuclear factor of activated T cells. Cell 95:595–604. doi: 10.1016/S0092-8674(00)81630-X. [DOI] [PubMed] [Google Scholar]
- 24.Nabel G, Baltimore D. 1987. An inducible transcription factor activates expression of human immunodeficiency virus in T cells. Nature 326:711–713. doi: 10.1038/326711a0. [DOI] [PubMed] [Google Scholar]
- 25.Tyagi M, Karn J. 2007. CBF-1 promotes transcriptional silencing during the establishment of HIV-1 latency. EMBO J 26:4985–4995. doi: 10.1038/sj.emboj.7601928. [DOI] [PMC free article] [PubMed] [Google Scholar]
- 26.He G, Margolis DM. 2002. Counterregulation of chromatin deacetylation and histone deacetylase occupancy at the integrated promoter of human immunodeficiency virus type 1 (HIV-1) by the HIV-1 repressor YY1 and HIV-1 activator Tat. Mol Cell Biol 22:2965–2973. doi: 10.1128/MCB.22.9.2965-2973.2002. [DOI] [PMC free article] [PubMed] [Google Scholar]
- 27.Baldauf HM, Pan X, Erikson E, Schmidt S, Daddacha W, Burggraf M, Schenkova K, Ambiel I, Wabnitz G, Gramberg T, Panitz S, Flory E, Landau NR, Sertel S, Rutsch F, Lasitschka F, Kim B, König R, Fackler OT, Keppler OT. 2012. SAMHD1 restricts HIV-1 infection in resting CD4(+) T cells. Nat Med 18:1682–1687. doi: 10.1038/nm.2964. [DOI] [PMC free article] [PubMed] [Google Scholar]
- 28.Gao WY, Cara A, Gallo RC, Lori F. 1993. Low levels of deoxynucleotides in peripheral blood lymphocytes: a strategy to inhibit human immunodeficiency virus type 1 replication. Proc Natl Acad Sci U S A 90:8925–8928. doi: 10.1073/pnas.90.19.8925. [DOI] [PMC free article] [PubMed] [Google Scholar]
- 29.Lenasi T, Contreras X, Peterlin BM. 2008. Transcriptional interference antagonizes proviral gene expression to promote HIV latency. Cell Host Microbe 4:123–133. doi: 10.1016/j.chom.2008.05.016. [DOI] [PMC free article] [PubMed] [Google Scholar]
- 30.Van Lint C. 2000. Role of chromatin in HIV-1 transcriptional regulation. Adv Pharmacol 48:121–160. doi: 10.1016/S1054-3589(00)48005-1. [DOI] [PubMed] [Google Scholar]
- 31.Van Lint C, Emiliani S, Ott M, Verdin E. 1996. Transcriptional activation and chromatin remodeling of the HIV-1 promoter in response to histone acetylation. EMBO J 15:1112–1120. [PMC free article] [PubMed] [Google Scholar]
- 32.Lusic M, Giacca M. 2015. Regulation of HIV-1 latency by chromatin structure and nuclear architecture. J Mol Biol 427:688–694. doi: 10.1016/j.jmb.2014.07.022. [DOI] [PubMed] [Google Scholar]
- 33.Blazkova J, Trejbalova K, Gondois-Rey F, Halfon P, Philibert P, Guiguen A, Verdin E, Olive D, Van Lint C, Hejnar J, Hirsch I. 2009. CpG methylation controls reactivation of HIV from latency. PLoS Pathog 5:e1000554. doi: 10.1371/journal.ppat.1000554. [DOI] [PMC free article] [PubMed] [Google Scholar]
- 34.Blazkova J, Murray D, Justement JS, Funk EK, Nelson AK, Moir S, Chun TW, Fauci AS. 2012. Paucity of HIV DNA methylation in latently infected, resting CD4+ T cells from infected individuals receiving antiretroviral therapy. J Virol 86:5390–5392. doi: 10.1128/JVI.00040-12. [DOI] [PMC free article] [PubMed] [Google Scholar]
- 35.Ho Y-C, Shan L, Hosmane NN, Wang J, Laskey SB, Rosenbloom DI, Lai J, Blankson JN, Siliciano JD, Siliciano RF. 2013. Replication-competent noninduced proviruses in the latent reservoir increase barrier to HIV-1 cure. Cell 155:540–551. doi: 10.1016/j.cell.2013.09.020. [DOI] [PMC free article] [PubMed] [Google Scholar]
- 36.Mahmoudi T, Parra M, Vries RG, Kauder SE, Verrijzer CP, Ott M, Verdin E. 2006. The SWI/SNF chromatin-remodeling complex is a cofactor for Tat transactivation of the HIV promoter. J Biol Chem 281:19960–19968. doi: 10.1074/jbc.M603336200. [DOI] [PubMed] [Google Scholar]
- 37.Tréand C, du Chéné I, Brès V, Kiernan R, Benarous R, Benkirane M, Emiliani S. 2006. Requirement for SWI/SNF chromatin-remodeling complex in Tat-mediated activation of the HIV-1 promoter. EMBO J 25:1690–1699. doi: 10.1038/sj.emboj.7601074. [DOI] [PMC free article] [PubMed] [Google Scholar]
- 38.Gerritsen ME, Williams AJ, Neish AS, Moore S, Shi Y, Collins T. 1997. CREB-binding protein/p300 are transcriptional coactivators of p65. Proc Natl Acad Sci U S A 94:2927–2932. doi: 10.1073/pnas.94.7.2927. [DOI] [PMC free article] [PubMed] [Google Scholar]
- 39.Agbottah E, Deng L, Dannenberg LO, Pumfery A, Kashanchi F. 2006. Effect of SWI/SNF chromatin remodeling complex on HIV-1 Tat activated transcription. Retrovirology 3:48. doi: 10.1186/1742-4690-3-48. [DOI] [PMC free article] [PubMed] [Google Scholar]
- 40.Benkirane M, Chun RF, Xiao H, Ogryzko VV, Howard BH, Nakatani Y, Jeang KT. 1998. Activation of integrated provirus requires histone acetyltransferase. p300 and P/CAF are coactivators for HIV-1 Tat. J Biol Chem 273:24898–24905. doi: 10.1074/jbc.273.38.24898. [DOI] [PubMed] [Google Scholar]
- 41.Col E, Caron C, Seigneurin-Berny D, Gracia J, Favier A, Khochbin S. 2001. The histone acetyltransferase, hGCN5, interacts with and acetylates the HIV transactivator, Tat. J Biol Chem 276:28179–28184. doi: 10.1074/jbc.M101385200. [DOI] [PubMed] [Google Scholar]
- 42.Hottiger MO, Nabel GJ. 1998. Interaction of human immunodeficiency virus type 1 Tat with the transcriptional coactivators p300 and CREB binding protein. J Virol 72:8252–8256. [DOI] [PMC free article] [PubMed] [Google Scholar]
- 43.Marzio G, Tyagi M, Gutierrez MI, Giacca M. 1998. HIV-1 tat transactivator recruits p300 and CREB-binding protein histone acetyltransferases to the viral promoter. Proc Natl Acad Sci U S A 95:13519–13524. doi: 10.1073/pnas.95.23.13519. [DOI] [PMC free article] [PubMed] [Google Scholar]
- 44.Demarchi F, Gutierrez MI, Giacca M. 1999. Human immunodeficiency virus type 1 tat protein activates transcription factor NF-κB through the cellular interferon-inducible, double-stranded RNA-dependent protein kinase, PKR. J Virol 73:7080–7086. [DOI] [PMC free article] [PubMed] [Google Scholar]
- 45.Razooky BS, Pai A, Aull K, Rouzine IM, Weinberger LS. 2015. A hardwired HIV latency program. Cell 160:990–1001. doi: 10.1016/j.cell.2015.02.009. [DOI] [PMC free article] [PubMed] [Google Scholar]
- 46.Yukl S, Pillai S, Li P, Chang K, Pasutti W, Ahlgren C, Havlir D, Strain M, Günthard H, Richman D, Rice AP, Daar E, Little S, Wong JK. 2009. Latently infected CD4+ T cells are enriched for HIV-1 Tat variants with impaired transactivation activity. Virology 387:98–108. doi: 10.1016/j.virol.2009.01.013. [DOI] [PMC free article] [PubMed] [Google Scholar]
- 47.Mousseau G, Mediouni S, Valente ST. 2015. Targeting HIV transcription: the quest for a functional cure. Curr Top Microbiol Immunol 389:121–145 doi: 10.1007/82_2015_435. [DOI] [PMC free article] [PubMed] [Google Scholar]
- 48.Mousseau G, Clementz MA, Bakeman WN, Nagarsheth N, Cameron M, Shi J, Baran P, Fromentin R, Chomont N, Valente ST. 2012. An analog of the natural steroidal alkaloid cortistatin A potently suppresses Tat-dependent HIV transcription. Cell Host Microbe 12:97–108. doi: 10.1016/j.chom.2012.05.016. [DOI] [PMC free article] [PubMed] [Google Scholar]
- 49.Pasternak AO, Adema KW, Bakker M, Jurriaans S, Berkhout B, Cornelissen M, Lukashov VV. 2008. Highly sensitive methods based on seminested real-time reverse transcription-PCR for quantitation of human immunodeficiency virus type 1 unspliced and multiply spliced RNA and proviral DNA. J Clin Microbiol 46:2206–2211. doi: 10.1128/JCM.00055-08. [DOI] [PMC free article] [PubMed] [Google Scholar]
- 50.Chun TW, Engel D, Mizell SB, Ehler LA, Fauci AS. 1998. Induction of HIV-1 replication in latently infected CD4+ T cells using a combination of cytokines. J Exp Med 188:83–91. doi: 10.1084/jem.188.1.83. [DOI] [PMC free article] [PubMed] [Google Scholar]
- 51.Scripture-Adams DD, Brooks DG, Korin YD, Zack JA. 2002. Interleukin-7 induces expression of latent human immunodeficiency virus type 1 with minimal effects on T-cell phenotype. J Virol 76:13077–13082. doi: 10.1128/JVI.76.24.13077-13082.2002. [DOI] [PMC free article] [PubMed] [Google Scholar]
- 52.Wang FX, Xu Y, Sullivan J, Souder E, Argyris EG, Acheampong EA, Fisher J, Sierra M, Thomson MM, Najera R, Frank I, Kulkosky J, Pomerantz RJ, Nunnari G. 2005. IL-7 is a potent and proviral strain-specific inducer of latent HIV-1 cellular reservoirs of infected individuals on virally suppressive HAART. J Clin Invest 115:128–137. doi: 10.1172/JCI22574. [DOI] [PMC free article] [PubMed] [Google Scholar]
- 53.Chan JK, Greene WC. 2012. Dynamic roles for NF-κB in HTLV-I and HIV-1 retroviral pathogenesis. Immunol Rev 246:286–310. doi: 10.1111/j.1600-065X.2012.01094.x. [DOI] [PubMed] [Google Scholar]
- 54.Pessler F, Cron RQ. 2004. Reciprocal regulation of the nuclear factor of activated T cells and HIV-1. Genes Immun 5:158–167. doi: 10.1038/sj.gene.6364047. [DOI] [PubMed] [Google Scholar]
- 55.Spina CA, Anderson J, Archin NM, Bosque A, Chan J, Famiglietti M, Greene WC, Kashuba A, Lewin SR, Margolis DM, Mau M, Ruelas D, Saleh S, Shirakawa K, Siliciano RF, Singhania A, Soto PC, Terry VH, Verdin E, Woelk C, Wooden S, Xing S, Planelles V. 2013. An in-depth comparison of latent HIV-1 reactivation in multiple cell model systems and resting CD4+ T cells from aviremic patients. PLoS Pathog 9:e1003834. doi: 10.1371/journal.ppat.1003834. [DOI] [PMC free article] [PubMed] [Google Scholar]
- 56.Mbonye U, Karn J. 2011. Control of HIV latency by epigenetic and non-epigenetic mechanisms. Curr HIV Res 9:554–567. doi: 10.2174/157016211798998736. [DOI] [PMC free article] [PubMed] [Google Scholar]
- 57.Weinberger LS, Burnett JC, Toettcher JE, Arkin AP, Schaffer DV. 2005. Stochastic gene expression in a lentiviral positive-feedback loop: HIV-1 Tat fluctuations drive phenotypic diversity. Cell 122:169–182. doi: 10.1016/j.cell.2005.06.006. [DOI] [PubMed] [Google Scholar]
- 58.Hocqueloux L, Prazuck T, Avettand-Fenoel V, Lafeuillade A, Cardon B, Viard JP, Rouzioux C. 2010. Long-term immunovirologic control following antiretroviral therapy interruption in patients treated at the time of primary HIV-1 infection. AIDS 24:1598–1601. doi: 10.1097/QAD.0b013e32833b61ba. [DOI] [PubMed] [Google Scholar]
- 59.Butera ST, Perez VL, Wu BY, Nabel GJ, Folks TM. 1991. Oscillation of the human immunodeficiency virus surface receptor is regulated by the state of viral activation in a CD4+ cell model of chronic infection. J Virol 65:4645–4653. [DOI] [PMC free article] [PubMed] [Google Scholar]
- 60.Jordan A, Bisgrove D, Verdin E. 2003. HIV reproducibly establishes a latent infection after acute infection of T cells in vitro. EMBO J 22:1868–1877. doi: 10.1093/emboj/cdg188. [DOI] [PMC free article] [PubMed] [Google Scholar]
- 61.Chávez L, Kauder S, Verdin E. 2011. In vivo, in vitro, and in silico analysis of methylation of the HIV-1 provirus. Methods 53:47–53. doi: 10.1016/j.ymeth.2010.05.009. [DOI] [PMC free article] [PubMed] [Google Scholar]
- 62.Kauder SE, Bosque A, Lindqvist A, Planelles V, Verdin E. 2009. Epigenetic regulation of HIV-1 latency by cytosine methylation. PLoS Pathog 5:e1000495. doi: 10.1371/journal.ppat.1000495. [DOI] [PMC free article] [PubMed] [Google Scholar]
- 63.Chatila T, Silverman L, Miller R, Geha R. 1989. Mechanisms of T cell activation by the calcium ionophore ionomycin. J Immunol 143:1283–1289. [PubMed] [Google Scholar]
- 64.Siekevitz M, Josephs SF, Dukovich M, Peffer N, Wong-Staal F, Greene WC. 1987. Activation of the HIV-1 LTR by T cell mitogens and the trans-activator protein of HTLV-I. Science 238:1575–1578. doi: 10.1126/science.2825351. [DOI] [PubMed] [Google Scholar]
- 65.Hiscott J, Marois J, Garoufalis J, D’Addario M, Roulston A, Kwan I, Pepin N, Lacoste J, Nguyen H, Bensi G, et al. 1993. Characterization of a functional NF-kappa B site in the human interleukin 1β promoter: evidence for a positive autoregulatory loop. Mol Cell Biol 13:6231–6240. [DOI] [PMC free article] [PubMed] [Google Scholar]
- 66.Kolch W, Heidecker G, Kochs G, Hummel R, Vahidi H, Mischak H, Finkenzeller G, Marmé D, Rapp UR. 1993. Protein kinase C alpha activates RAF-1 by direct phosphorylation. Nature 364:249–252. doi: 10.1038/364249a0. [DOI] [PubMed] [Google Scholar]
- 67.Schneidewind A, Brockman MA, Yang R, Adam RI, Li B, Le Gall S, Rinaldo CR, Craggs SL, Allgaier RL, Power KA, Kuntzen T, Tung CS, LaBute MX, Mueller SM, Harrer T, McMichael AJ, Goulder PJ, Aiken C, Brander C, Kelleher AD, Allen TM. 2007. Escape from the dominant HLA-B27-restricted cytotoxic T-lymphocyte response in gag is associated with a dramatic reduction in human immunodeficiency virus type 1 replication. J Virol 81:12382–12393. doi: 10.1128/JVI.01543-07. [DOI] [PMC free article] [PubMed] [Google Scholar]
- 68.McKernan LN, Momjian D, Kulkosky J. 2012. Protein kinase C: one pathway towards the eradication of latent HIV-1 reservoirs. Adv Virol 2012:805347. doi: 10.1155/2012/805347. [DOI] [PMC free article] [PubMed] [Google Scholar]
- 69.Williams SA, Chen LF, Kwon H, Fenard D, Bisgrove D, Verdin E, Greene WC. 2004. Prostratin antagonizes HIV latency by activating NF-κB. J Biol Chem 279:42008–42017. doi: 10.1074/jbc.M402124200. [DOI] [PubMed] [Google Scholar]
- 70.Archin NM, Espeseth A, Parker D, Cheema M, Hazuda D, Margolis DM. 2009. Expression of latent HIV induced by the potent HDAC inhibitor suberoylanilide hydroxamic acid. AIDS Res Hum Retroviruses 25:207–212. doi: 10.1089/aid.2008.0191. [DOI] [PMC free article] [PubMed] [Google Scholar]
- 71.Clouse KA, Powell D, Washington I, Poli G, Strebel K, Farrar W, Barstad P, Kovacs J, Fauci AS, Folks TM. 1989. Monokine regulation of human immunodeficiency virus-1 expression in a chronically infected human T cell clone. J Immunol 142:431–438. [PubMed] [Google Scholar]
- 72.Folks TM, Clouse KA, Justement J, Rabson A, Duh E, Kehrl JH, Fauci AS. 1989. Tumor necrosis factor alpha induces expression of human immunodeficiency virus in a chronically infected T-cell clone. Proc Natl Acad Sci U S A 86:2365–2368. doi: 10.1073/pnas.86.7.2365. [DOI] [PMC free article] [PubMed] [Google Scholar]
- 73.Folks TM, Justement J, Kinter A, Dinarello CA, Fauci AS. 1987. Cytokine-induced expression of HIV-1 in a chronically infected promonocyte cell line. Science 238:800–802. doi: 10.1126/science.3313729. [DOI] [PubMed] [Google Scholar]
- 74.Cannon P, Kim SH, Ulich C, Kim S. 1994. Analysis of Tat function in human immunodeficiency virus type 1-infected low-level-expression cell lines U1 and ACH-2. J Virol 68:1993–1997. [DOI] [PMC free article] [PubMed] [Google Scholar]
- 75.Emiliani S, Van Lint C, Fischle W, Paras P Jr., Ott M, Brady J, Verdin E. 1996. A point mutation in the HIV-1 Tat responsive element is associated with postintegration latency. Proc Natl Acad Sci U S A 93:6377–6381. doi: 10.1073/pnas.93.13.6377. [DOI] [PMC free article] [PubMed] [Google Scholar]
- 76.Emiliani S, Fischle W, Ott M, Van Lint C, Amella CA, Verdin E. 1998. Mutations in the tat gene are responsible for human immunodeficiency virus type 1 postintegration latency in the U1 cell line. J Virol 72:1666–1670. [DOI] [PMC free article] [PubMed] [Google Scholar]
- 77.Reza SM, Rosetti M, Mathews MB, Pe’ery T. 2003. Differential activation of Tat variants in mitogen-stimulated cells: implications for HIV-1 postintegration latency. Virology 310:141–156. doi: 10.1016/S0042-6822(03)00106-5. [DOI] [PubMed] [Google Scholar]
- 78.Adams M, Sharmeen L, Kimpton J, Romeo JM, Garcia JV, Peterlin BM, Groudine M, Emerman M. 1994. Cellular latency in human immunodeficiency virus-infected individuals with high CD4 levels can be detected by the presence of promoter-proximal transcripts. Proc Natl Acad Sci U S A 91:3862–3866. doi: 10.1073/pnas.91.9.3862. [DOI] [PMC free article] [PubMed] [Google Scholar]
- 79.Adams M, Wong C, Wang D, Romeo J. 1999. Limitation of Tat-associated transcriptional processivity in HIV-infected PBMC. Virology 257:397–405. doi: 10.1006/viro.1999.9647. [DOI] [PubMed] [Google Scholar]
- 80.Ambrosino C, Ruocco MR, Chen X, Mallardo M, Baudi F, Trematerra S, Quinto I, Venuta S, Scala G. 1997. HIV-1 Tat induces the expression of the interleukin-6 (IL6) gene by binding to the IL6 leader RNA and by interacting with CAAT enhancer-binding protein beta (NF-IL6) transcription factors. J Biol Chem 272:14883–14892. doi: 10.1074/jbc.272.23.14883. [DOI] [PubMed] [Google Scholar]
- 81.Chen R, Liu M, Li H, Xue Y, Ramey WN, He N, Ai N, Luo H, Zhu Y, Zhou N, Zhou Q. 2008. PP2B and PP1α cooperatively disrupt 7SK snRNP to release P-TEFb for transcription in response to Ca2+ signaling. Genes Dev 22:1356–1368. doi: 10.1101/gad.1636008. [DOI] [PMC free article] [PubMed] [Google Scholar]
- 82.Chun RF, Semmes OJ, Neuveut C, Jeang KT. 1998. Modulation of Sp1 phosphorylation by human immunodeficiency virus type 1 Tat. J Virol 72:2615–2629. [DOI] [PMC free article] [PubMed] [Google Scholar]
- 83.Verhoef K, Koper M, Berkhout B. 1997. Determination of the minimal amount of Tat activity required for human immunodeficiency virus type 1 replication. Virology 237:228–236. doi: 10.1006/viro.1997.8786. [DOI] [PubMed] [Google Scholar]
- 84.Meyerhans A, Cheynier R, Albert J, Seth M, Kwok S, Sninsky J, Morfeldt-Månson L, Asjö B, Wain-Hobson S. 1989. Temporal fluctuations in HIV quasispecies in vivo are not reflected by sequential HIV isolations. Cell 58:901–910. doi: 10.1016/0092-8674(89)90942-2. [DOI] [PubMed] [Google Scholar]
- 85.Sabino E, Cheng-Mayer C, Mayer A. 1993. An individual with a high prevalence of a tat-defective provirus in peripheral blood. AIDS Res Hum Retroviruses 9:1265–1268. doi: 10.1089/aid.1993.9.1265. [DOI] [PubMed] [Google Scholar]
- 86.Donahue DA, Kuhl BD, Sloan RD, Wainberg MA. 2012. The viral protein Tat can inhibit the establishment of HIV-1 latency. J Virol 86:3253–3263. doi: 10.1128/JVI.06648-11. [DOI] [PMC free article] [PubMed] [Google Scholar]
- 87.Archin NM, Liberty AL, Kashuba AD, Choudhary SK, Kuruc JD, Crooks AM, Parker DC, Anderson EM, Kearney MF, Strain MC, Richman DD, Hudgens MG, Bosch RJ, Coffin JM, Eron JJ, Hazuda DJ, Margolis DM. 2012. Administration of vorinostat disrupts HIV-1 latency in patients on antiretroviral therapy. Nature 487:482–485. doi: 10.1038/nature11286. [DOI] [PMC free article] [PubMed] [Google Scholar]
- 88.Deeks SG. 2012. HIV: shock and kill. Nature 487:439–440. doi: 10.1038/487439a. [DOI] [PubMed] [Google Scholar]
- 89.Shan L, Deng K, Shroff NS, Durand CM, Rabi SA, Yang HC, Zhang H, Margolick JB, Blankson JN, Siliciano RF. 2012. Stimulation of HIV-1-specific cytolytic T lymphocytes facilitates elimination of latent viral reservoir after virus reactivation. Immunity 36:491–501. doi: 10.1016/j.immuni.2012.01.014. [DOI] [PMC free article] [PubMed] [Google Scholar]
- 90.Elliott JH, Wightman F, Solomon A, Ghneim K, Ahlers J, Cameron MJ, Smith MZ, Spelman T, McMahon J, Velayudham P, Brown G, Roney J, Watson J, Prince MH, Hoy JF, Chomont N, Fromentin R, Procopio FA, Zeidan J, Palmer S, Odevall L, Johnstone RW, Martin BP, Sinclair E, Deeks SG, Hazuda DJ, Cameron PU, Sekaly RP, Lewin SR. 2014. Activation of HIV transcription with short-course vorinostat in HIV-infected patients on suppressive antiretroviral therapy. PLoS Pathog 10:e1004473. doi: 10.1371/journal.ppat.1004473. [DOI] [PMC free article] [PubMed] [Google Scholar]
- 91.Ramratnam B, Mittler JE, Zhang L, Boden D, Hurley A, Fang F, Macken CA, Perelson AS, Markowitz M, Ho DD. 2000. The decay of the latent reservoir of replication-competent HIV-1 is inversely correlated with the extent of residual viral replication during prolonged anti-retroviral therapy. Nat Med 6:82–85. doi: 10.1038/71577. [DOI] [PubMed] [Google Scholar]
Associated Data
This section collects any data citations, data availability statements, or supplementary materials included in this article.
Supplementary Materials
Effect of dCA on latently infected HeLa-CD4 cells. (A) dCA inhibits HIV replication in chronically infected HeLa-CD4 cells. Chronically infected HeLa-CD4 cells were treated for 6 days with DMSO, ARVs (raltegravir at 200 nM, lamivudine at 200 nM, efavirenz at 100 nM) or dCA at 10 nM. Supernatants were analyzed in a p24 ELISA at day 6. (B) Effect of dCA on HeLa-CD4 cell number. The number of cells was determined along with the experiments depicted in Fig. 2A. Cells were treated with DMSO or dCA at the indicated concentrations. Data are representative of two independent experiments. (C) dCA does not accumulate in HeLa-CD4 cells. Pellets of 12 × 106 cells were collected from cells continuously treated with DMSO or dCA at 10 nM, or treatment was stopped and cultures were split 3 or 11 times before collection. After lysis of the cells in 33% water–66% acetonitrile, the supernatant was analyzed by liquid chromatography-mass spectrometry. Limit of detection, 4.3 fmol/106 cells. ND, nondetectable; TS, treatment stop. (D) Integration events upon treatment in HeLa-CD4 cells. gDNA extracted at the indicated days (see Fig. 2A) was amplified by Alu-PCR followed by a nested qPCR. Integration events are reported as the fold change compared to DMSO controls. qPCR data are presented as means ± SD. HI, heat inactivated. Download
Effect of dCA on latently infected OM-10.1 and J-Lat cell lines. (A) Integration events upon dCA treatment in OM-10.1 cells. gDNA extracted at day 202 (from OM-10.1 cells [see Fig. 2B]) was amplified by Alu-PCR followed by a nested qPCR. Integration events are reported as the fold change compared to the DMSO control. Data are representative of four analyses at days 9, 49, 99, and 202. qPCR data are presented as means ± SD. (B) Effect of dCA on cell number in the indicated cell lines. Cell number was determined along with the experiments depicted in Fig. 2B to D. Data are presented as means ± SD of two or three independent experiments for J-Lat 10.6 (n = 3) and J-Lat 6.3 (n = 2) clones. (C) Toxicity of dCA was assessed in the indicated cell lines in an MTT assay. A total of 25,000 cells per well were treated for 48 h with DMSO or 0.1 nM to 10,000 nM dCA, and cell proliferation was assessed in the MTT assay. Data are presented as means ± SD of three independent experiments (n = 9) for OM-10.1 cells and two independent experiments (n = 6) for J-Lat clones. Download
TNF-α activation of latently infected HeLa-CD4 cells. Activation for 72 h by TNF-α (10 ng/ml) of latently infected and DMSO-treated HeLa-CD4 cells at day 180 (see Fig. 2A). Supernatant at day 183 was analyzed in a p24 ELISA. Download
CpG hypermethylation does not maintain a state of transcriptional repression during normal or dCA-induced latency in HeLa-CD4 infected cells. At day 178, gDNAs of latent, dCA-induced latent, and acutely infected HeLa-CD4 cells were converted with the bisulfite method (see Fig. 2A). After amplification by nested PCR, the converted DNA was TOPO cloned. Nine clones were sequenced per condition. Non-CpG cytosine bisulfite conversion ranged from 95 to 100% for each clone. Data are representative of two independent experiments. Download
Long-term-treated HeLa-CD4 cells are equally susceptible to PMA-iono activation, and dCA-induced latent viruses are replication competent. (A) Susceptibility to PMA activation. Uninfected cells and long-term-cultured HeLa-CD4 cells treated with DMSO (latency) or with dCA at 10 nM (dCA-induced latency) were activated for 24 h. IL-1β mRNA production was quantified from cDNAs prepared from total RNA extracted at day 154. Results were normalized as mRNA copies per GAPDH mRNA copy. Viral mRNA generated in nonactivated (NA) controls was set to 1. Data are presented as means ± SD of two biological duplicates. (B) Susceptibility to PMA activation. The same cells grown for 140 days (see Fig. 2A) were activated for 30 min with PMA and iono. As a control, uninfected HeLa-CD4 cells were activated similarly. Western blot analysis was performed with the indicated antibodies. The results are representative of two independent experiments performed at days 140 and 145. (C) Latent and dCA-induced latent viruses are replication competent and can be inhibited by dCA in newly infected cells. Viruses produced after Tat transfection of latent and dCA-induced latent cells at day 178 were used to infect naive HeLa-CD4 cells (see Fig. 4B). After passaging the cells within a month, a state of chronicity was observed. Chronic cells were treated for 72 h with DMSO or 10 nM dCA before the supernatant was analyzed in a p24 ELISA. (D) Unique mutations of the sequenced gDNA from dCA-induced latent virus at day 178. Download
Toxicity and cytostatic effects were assessed in ACH-2 and U1 cells. (A) Effect of dCA on cell number. Cell numbers from the indicated cell lines were determined along with the experiments depicted in Fig. 6. Cells were treated with DMSO or dCA at the indicated concentrations. Data are presented as means ± SD of three independent experiments (n = 3). (B) Toxicity of dCA was assessed for the indicated cell lines by MTT assay. A total of 25,000 cells per well were treated for 48 h with DMSO or 0.1 nM to 10,000 nM dCA, cell proliferation was assessed in an MTT assay. Data are presented as means ± SD of three independent experiments (n = 9). Download
Expanded CD4+ T-cell HIV production and viability. (A) HIV production from expanded CD4+ T cells. CD4+ T cells were expanded for 35 days and monitored for viral production weekly. HIV RNA viral production was below detection at 22 days postexpansion. (B) Viability of expanded CD4+ T cells. Cell viability was monitored weekly using trypan blue dye exclusion staining. Cells maintained greater than 90% viability. Download
List of primers and oligos.