

Abstract
The nutritional status of pregnant women is vital for healthy outcomes and is a concern for a large proportion of the world's population. The role of the microbiota in pregnancy and nutrition is a promising new area of study with potential health ramifications. In many African countries, maternal and infant death and morbidity are associated with malnutrition. Here, we assess the influence of probiotic yogurt containing Lactobacillus rhamnosus GR-1, supplemented with Moringa plant as a source of micronutrients, on the health and oral, gut, vaginal, and milk microbiotas of 56 pregnant women in Tanzania. In an open-label study design, 26 subjects received yogurt daily, and 30 were untreated during the last two trimesters and for 1 month after birth. Samples were analyzed using 16S rRNA gene sequencing, and dietary recalls were recorded. Women initially categorized as nourished or undernourished consumed similar calories and macronutrients, which may explain why there was no difference in the microbiota at any body site. Consumption of yogurt increased the relative abundance of Bifidobacterium and decreased Enterobacteriaceae in the newborn feces but had no effect on the mother's microbiota at any body site. The microbiota of the oral cavity and GI tract remained stable over pregnancy, but the vaginal microbiota showed a significant increase in diversity leading up to and after birth. In summary, daily micronutrient-supplemented probiotic yogurt provides a safe, affordable food for pregnant women in rural Tanzania, and the resultant improvement in the gut microbial profile of infants is worthy of further study.
INTRODUCTION
The United Nations estimates that 805 million people are chronically undernourished throughout the world (1). Malnutrition is an additional challenge for pregnant women in many developing countries, along with access to medical care, exposure to malaria and HIV, and financial burden. Limited food accessibility, food with poor nutritional value, and cultural traditions result in deficiencies in essential nutrients. Micronutrients are dietary components, often referred to as vitamins and minerals. Iron, iodine, vitamin A, folate, and zinc are recommended during pregnancy (2), although unfortunately not all women are recipients. In many developing countries, including Tanzania, maternal and newborn death and morbidity are major issues, often propagated by malnourishment (3, 4). Efforts to reduce infant mortality by supplementation with vitamin A have failed (5). Fermented foods, including dairy products, have long been part of tradition in many parts of the African continent. In Tanzania (6), while milk consumption is high (per capita milk consumption of 39 kg/annum), commercial yogurt is not affordable to many, and no health-promoting probiotic yogurt is sold in traditional retail outlets. The establishment of community kitchens in Mwanza in 2004 (7) has provided affordable probiotic yogurt to around 4,000 people each day, with some measurable benefits to immunity and gut health (8, 9).
There is a clear link between the gut microbiota and nutrient uptake (10), and while the gut microbiota has been reported to be relatively stable in nonpregnant healthy individuals (11), changes have been reported in pregnant American and European women, where Firmicutes, along with Bacteroides dominate. However, during the first and third trimesters, proteobacteria and actinobacteria increase, while richness decreases (12–14). Given the role of diet on shaping the microbiota (15, 16) and the potential additional nutritional stresses within impoverished African rural settings, we sought to assess the gut microbiotas of Tanzanian pregnant women. Also, since vaginal and oral microbiomes are suspected to influence pregnancy outcomes (17), and longitudinal studies seldom have included sampling after birth, we aimed to better characterize these microbiotas longitudinally.
Few studies have been undertaken on the human milk microbiota of African women, even though the transfer of these organisms to infants is critical to development, immunity, risk of disease later in life, and cognitive function (18, 19). In a Mozambique study, human milk was found to contain mostly lactic acid bacteria, but proportions were altered by HIV infection (20).
The probiotic Lactobacillus rhamnosus GR-1 was selected for use as an intervention in the present study since it has a safe history of use (8, 9, 21) and was already produced in Mwanza, Tanzania, as part of the Western Heads East network of microenterprise community-run kitchens (22). For the purposes of the present study, the yogurt was further supplemented with dried ground Moringa oleifera (Moringa), a readily available plant, rich in vitamin A, proteins, carbohydrate, fiber, minerals, calcium, magnesium, phosphorus, potassium, copper, iron, zinc, and manganese (23) and used commonly in the management of malnutrition (24). An open-label study was conducted to test a Moringa-supplemented probiotic yogurt and to determine whether it altered the oral, vaginal, gut, or breast milk microbiotas and had an impact on gestation and health parameters in newborns.
MATERIALS AND METHODS
Study design and participants.
The study protocol was approved and received ethical clearance from both the Medical Research Coordinating Committee of the National Institute for Medical Research (Mwanza, Tanzania), as well as from the Health Sciences Research Ethics Board at Western University (London, Canada). The study was registered with clinicaltrials.gov (NCT02021799). Participants provided written consent, and in the case where they could not write, a thumbprint was obtained before sample collection and subsequent analysis.
Women who were attending the antenatal clinic at Nyerere Dispensary in Buswelu, district of Ilemela, Mwanza Region, Tanzania, were recruited into the study if they were between the ages of 18 and 40, as well as between the gestational ages of 12 and 24 weeks. Gestational age was determined by last menstrual period as identified in the participant's clinic records. To confirm, or if last menstrual period was unavailable, approximation of gestational age was based upon measurement of fundal height. Originally, participants were further grouped into states of nutritional status (nourished or undernourished) based upon having a mid-upper-arm circumference (MUAC) of <235 mm if undernourished, and deviations from expected weight for gestational age (25). Since this was a pilot study, sample size was based on participant availability.
Probiotic yogurt.
Subjects were randomly assigned (using a random number generator) to the intervention group (produced fresh daily yogurt containing ∼1010 CFU Lactobacillus rhamnosus GR-1 per 250 g unit confirmed by regular quality control tests, and 4.3 g of dried ground Moringa oleifera leaves), or control group (no intervention). Administration of the yogurt amounted to 13% required daily intake of protein (9.95 g), 39% calcium (385 mg), 35% vitamin A (269 retinol activity equivalents), 81% vitamin B2 (1.1 mg), and 4% iron (1.2 mg). The probiotic group received 250 g of yogurt 6 days a week from the time of recruitment until exiting the study, which occurred 1 week to 1 month postpartum. Due to a lack of cold storage available to most participants, yogurt was delivered daily by a study employee who observed and recorded compliance. Participants in the probiotic group consumed yogurt for an average of 88 days ± 31 the standard deviation (SD), while the control group had no form of intervention.
Assessment and sample collection.
At the initial and monthly follow-up visits from recruitment until birth, which occurred between August 2012 and April 2013, weight was measured to the nearest 0.1 kg using an analogue scale, and the MUAC was measured to 1 mm using a tape measure. A physical examination was also performed at these visits, which included measurement of blood pressure, heart rate, and general medical history. Two vaginal swabs were collected at the midpoint of the vagina using CultureSwab polyester-tipped swabs (BD Biosciences, Mississauga, Ontario, Canada); one was used for evaluation of bacterial vaginosis (BV) by Nugent Scoring (26), while the second was used for microbial DNA extraction. Fecal samples and saliva samples were also collected in sterile collection containers and frozen at −80 C until analysis. A midstream urine sample was analyzed for urinary tract infection using a multitest dipstick system (Rapid Response Urine Dipstick; BTNX Urinalysis, Laja Pharmacy, Mwanza, Tanzania). Hemoglobin levels were determined using a HemoCue Hb 201+ analyser (HemoCue, Ängelholm, Sweden).
Blood samples were collected from all participants at the first, middle, and final visits in Vacutainer tubes containing potassium EDTA (BD Biosciences, Mississauga, Ontario, Canada). Plasma was separated from the samples before being frozen at −80°C until analysis. Vitamin A levels were determined by high-pressure liquid chromatography, while the total plasma protein levels were determined by a colorimetric biuret assay by the London Health Sciences Laboratory Services Group (London, Ontario, Canada).
The first postpartum visits occurred at 3 days after birth, and the final visit occurred 1 week to 1 month after the first postpartum visit. The same information and samples were collected as during the follow-up visits; however, a human milk sample was collected in sterile collection containers from the mother and stored at −80°C until analysis. Anthropometric data were collected from the infant, including weight, as measured on an analogue baby scale to the nearest 0.1 kg, whereas head circumference, length, and MUAC were measured using a tape measure to the nearest 0.1 cm. In addition, the sex of the infant, the place of birth, and whether the baby was born vaginally or by caesarean section were recorded. Fecal samples were collected from the infant's diaper, and infant saliva samples were collected using a BBL CultureSwab (BD Diagnostics, Mississauga, Ontario, Canada) and stored at −80°C until analysis.
Dietary recall analysis.
Forty-eight-hour dietary recall interviews were conducted by a trained study translator at each visit. Information from these interviews was analyzed for nutritional content and caloric intake using the ESHA Food Processor SQL (v9.8), which provides access to an extensive database of comprehensive nutrition information to allow evaluation of a subject's diet and fitness. Although this program utilizes North American food composition tables, nutritional data for local Tanzanian foods and recipes were inputted into the software from Tanzanian food composition tables prepared by Muhimbli University of Health and Allied Sciences, the Tanzania Food and Nutrition Center, and the Harvard School of Public Health (27). In addition, when serving sizes per se, or sizes of specific food items were not clearly stated in the interview, the average portion quantity, as outlined by the Tanzanian Food Composition Tables, was used. Nutritional data for Moringa were obtained (M. Broin, unpublished data) and put into ESHA. The average intake of calories, protein, fat, carbohydrates, saturated fatty acids, monounsaturated fatty acids, polyunsaturated fatty acids, calcium, vitamin A, folate, and zinc were calculated over the 48-h period to determine daily consumption. The same was done for the 48-h dietary recalls collected at the first postpartum and final visits to obtain a value representing the daily average intake of the above-listed nutrients postpartum.
Microbial DNA extraction and sequencing.
DNA was extracted from all samples using the PowerSoil-htp 96 Well Soil DNA isolation kit from MoBio (Carlsbad, CA) according to the manufacturer's protocol, with modifications as outlined by the Earth Microbiome Project (version 4_13). Approximately 250 mg of fecal sample, 500 μl of saliva and 500 μl of breast milk were used for the extractions. Samples were sequenced by amplifying the V4 hypervariable region of the 16S rRNA gene using the bacterial/archaeal primers 515F and 806R according to previously described methods (28) and modified for the Illumina MiSeq platform.
Microbial community analysis.
Obtained reads were quality filtered and demultiplexed using the open-source software QIIME (split_libraries_fast.py with default parameters for Illumina sequencing) (29). A total of 974 samples were sequenced, yielding 15,596,127 sequences total with an average of 16,012 sequences ± 11,840 SD per sample. Samples that generated fewer than 1,000 sequences after quality filtering were discarded. The remaining sequences were then binned into operational taxonomic units (OTUs) using closed-reference OTU picking based on 97% identity using the May 2013 build from the Greengenes reference database (30). Demultiplexed reads and associated metadata were deposited in the Qiita and EBI databases available through study ID 2024 (http://qiita.ucsd.edu).
Statistical analysis.
All statistical analyses were carried out in R using unpaired Welch's t tests with Benjamini Hochberg's false discovery rate (FDR) method with a q < 0.05 cutoff unless otherwise indicated. Analysis of alpha (Shannon diversity index) and beta diversity (weighted UniFrac and Bray Curtis) were performed in QIIME. All plotting was carried out in R with OTUs summarized to genus level and filtered to only include organisms which composed >1% of the total data set (vaginal heat map [see Fig. 6C]) or >0.01% (entire data set [see Fig. 3]). For association of individual genera with yogurt/control treatment in infant fecal samples, the data set was filtered to include only infant fecal samples, summarized to the genus level and genera were only kept if they represented a minimum 0.1% of the total reads. Significantly differentially abundant genera were determined by comparing groups using ALDEx2 (v0.99.2) (31, 32) by Wilcoxon rank-sum test with FDR correction of centered log-ratio transformed data using 1,000 Monte-Carlo instances drawn from the Dirichlet distribution with a minimally informative uniform prior of 0.5. Taxa that had zero counts in all samples were removed. This approach accurately estimates the range of technical variation inherent in microbiome data sets for all taxa, including those where some samples contained a zero, and some where they contained a positive count (31, 32).
FIG 6.

(A) Time series of vaginal samples shows increasing diversity and leading up to and after birth. Nugent score based on microscopy (wherein 0 to 3 is considered normal, 4 to 6 intermediate, and 7 to 10 is a state of microbial dysbiosis referred to as BV) is also displayed. (B) Comparison of Shannon's diversity shows an increase within 10 days after birth. (C) Heat map of genera composing >1% of vaginal organisms shows a loss of lactobacilli and an increase in BV-associated organisms such as Prevotella.
FIG 3.

Heat map of all samples (n = 974) at the genus level. Samples were UPGMA (unweighted pair-group method with arithmetic averages) clustered be weighted UniFrac distances showing strong clustering of samples by body site (as indicated in the lower heat map).
Human milk analysis.
The breast milk samples collected at the final visit for all women in the study were analyzed for fat, protein, and lactose content. From the calculated lactose amount, the total carbohydrates were estimated. A total of 12 milk samples were excluded from this analysis due to the provider being HIV positive. Data were obtained for nine participants from the control group and six participants from the probiotic yogurt group. Samples were homogenized for 10 s prior to the removal of a 500-μl aliquot for DNA extraction using a sonicator (VCX 130; Chemical Instruments AB, Sollentuna, Sweden). The remaining sample (approximately 500 μl to 1 ml) was used for nutrient analysis. The lactose content was measured as described by Fusch et al. (33). Fat was extracted from the milk using Mojonnier ether extraction and then gravimetrically analyzed to get the total fat content (34). The protein content of the breast milk was determined as per the methods of Choi et al. (34). The true protein content was determined by subtracting the nonprotein nitrogen from the total nitrogen and multiplying this by 6.25 (35).
RESULTS
Clinical outcomes.
The women were enrolled from a 20-km area around the Nyerere Dispensary on the outskirts of Mwanza. No verbal or written complaints or side effects were reported from consumption of the yogurt. Figure 1 shows a CONSORT-compliant study flow chart. Baseline demographic data for the nourished, undernourished, probiotic, and control groups are presented in Table 1 and showed no differences between groups, except for weight related metrics between the nourished and undernourished groups. For interpretative purposes, a blood level for vitamin A of 0.9 mmol/liter equals 25.8 mg/dl just below the normal range of 30 to 65 μg/dl.
FIG 1.
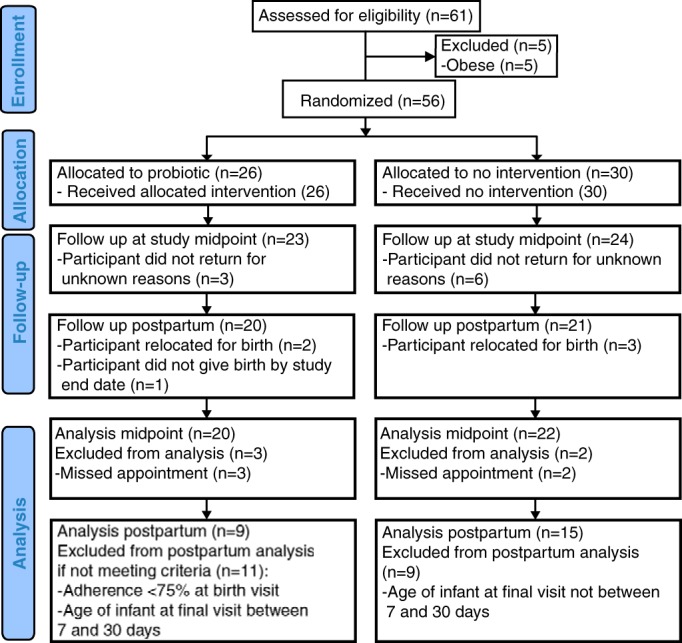
CONSORT study flow diagram.
TABLE 1.
Enrollment demographics for probiotic, control, undernourished and nourished groupsa
| Parameter | Probiotic vs control |
Undernourished vs nourished |
||||
|---|---|---|---|---|---|---|
| Probiotic (n = 23) | Control (n = 24) | q value | Undernourished (n = 29) | Nourished (n = 18) | q value | |
| Gestational age (wk) | 21 ± 3 | 20 ± 5 | 0.915 | 21 ± 4 | 21 ± 4 | 0.976 |
| Age (yr) | 23.30 ± 4.42 | 24.38 ± 5.01 | 0.915 | 24.31 ± 5.47 | 23.11 ± 3.12 | 0.958 |
| Ht (m) | 1.60 ± 0.07 | 1.62 ± 0.06 | 0.915 | 1.61 ± 0.06 | 1.62 ± 0.07 | 0.976 |
| Wt (kg) | 54.8 ± 5.8 | 57.5 ± 7.4 | 0.915 | 52.6 ± 4.3 | 62.0 ± 5.9 | 3.11E–05 |
| % Deviationb | 72.71 ± 10.14 | 96.75 ± 6.58 | 2.19E–11 | |||
| MUACc (mm) | 261 ± 22 | 262 ± 22 | 0.965 | 256 ± 22 | 271 ± 19 | 0.109 |
| Hemoglobin (g/liter) | 110.48 ± 13.68 | 103.38 ± 17.21 | 0.915 | 107.34 ± 16.70 | 106.06 ± 14.75 | 0.976 |
| HIV (n) | 2 | 3 | 3 | 2 | ||
| Malaria (n) | 3 | 4 | 4 | 3 | ||
| Syphilis (n) | 2 | 2 | 4 | 0 | ||
| Previous pregnancies (n) | 2.09 ± 2.07 | 2.00 ± 1.48 | 0.965 | 2.29 ± 1.94 | 1.67 ± 1.46 | 0.935 |
| Age of first pregnancy | 18.06 ± 9.54 | 18.88 ± 9.20 | 0.965 | 18.19 ± 1.86 | 19.00 ± 1.97 | 0.976 |
| Calories (kcal/day) | 1,695 ± 752 | 1,759 ± 781 | 0.965 | 1,719 ± 754 | 1,742 ± 789 | 0.976 |
| Protein (g/day) | 57 ± 23 | 58 ± 21 | 0.965 | 57 ± 21 | 58 ± 25 | 0.976 |
| Carbohydrates (g/day) | 278 ± 118 | 276 ± 121 | 0.965 | 277 ± 122 | 277 ± 116 | 0.997 |
| Fat (g/day) | 46 ± 33 | 52 ± 33 | 0.915 | 48 ± 32 | 51 ± 35 | 0.976 |
| Vitamin B12 (μg/day) | 0.69 ± 0.62 | 0.88 ± 0.81 | 0.915 | 0.80 ± 0.76 | 0.77 ± 0.69 | 0.976 |
| Thiamine (mg/day) | 0.78 ± 0.39 | 0.90 ± 0.44 | 0.915 | 0.86 ± 0.39 | 0.82 ± 0.46 | 0.976 |
| Calcium (mg/day) | 187 ± 119 | 236 ± 175 | 0.915 | 199 ± 168 | 233 ± 120 | 0.976 |
| Vitamin A (RAE/day, median [IQR])d | 316 (70–869) | 546 (123–1,019) | 0.915 | 261 (98–846) | 636 (170–1,018) | 0.958 |
| Folate (μg/day) | 249 ± 212 | 294 ± 199 | 0.915 | 269 ± 206 | 276 ± 208 | 0.976 |
| Iron (mg/day) | 49 ± 51 | 40 ± 41 | 0.915 | 41 ± 45 | 50 ± 48 | 0.976 |
| Zinc (mg/day) | 5.4 ± 2.7 | 5.9 ± 2.4 | 0.915 | 5.8 ± 2.5 | 5.5 ± 2.6 | 0.976 |
| Blood vitamin A (mmol/liter) | 0.90 ± 0.27 | 1.02 ± 0.43 | 0.915 | 1.00 ± 0.31 | 0.88 ± 0.44 | 0.958 |
| Blood protein (g/liter) | 64.4 ± 8.9 | 63.5 ± 6.9 | 0.965 | 65.8 ± 4.7 | 60.9 ± 10.7 | 0.398 |
Values represent means ± the standard deviations unless indicated otherwise in column 1.
The percent deviation was calculated based on the participant's gestational age (calculated from participant recall of the last menstrual period) and height as measured at baseline. These were used to determine the ideal weight of the participants as outlined by Gueri et al. (25). The weight of the participants measured at baseline was then used to calculate the percent deviation from the ideal weight.
MUAC, mid-upper-arm circumference.
RAE, retinol activity equivalents; IQR, interquartile range.
Using 48-h dietary recalls, women in both groups who were initially categorized as nourished or undernourished were found to have consumed similar calories and macronutrients. In comparison to reference dietary intake (RDI) values for Canadian pregnant women, the Tanzanian women only met the requirements for carbohydrates and iron throughout pregnancy; all other micro- and macronutrients were below 90% of the Canadian RDI, including folate. However, only three babies (5%) were delivered preterm, while all other births occurred without adverse events, and overall, babies examined by the local physician were deemed to be healthy. It was noted at the study midpoint whereby there was increased calorie, carbohydrate, thiamine, folate, and zinc intake in the probiotic group while blood protein levels were also higher; however, these were not statistically supported after multiple testing corrections (Table 2). We noted that the calcium levels in the probiotic group were significantly higher than for all others (Tables 2 and 3). The fat, carbohydrate, and protein content of the breast milk and the hemoglobin, blood retinol, or blood protein concentrations were not altered by yogurt intake, nor was gestational weight gain or newborn weight at the final visit (Table 3).
TABLE 2.
Comparison of probiotic and control groups at the study midpointa
| Parameter | Probiotic (n = 20) | Control (n = 22) | q valued |
|---|---|---|---|
| Gestational age (wk) | 32 ± 2 | 30 ± 4 | 0.582 |
| Age (yr) | 23.5 ± 4.7 | 24.6 ± 5.1 | 0.582 |
| Ht (m) | 1.59 ± 0.06 | 1.62 ± 0.06 | 0.304 |
| Wt (kg) | 58.5 ± 5.9 | 60.1 ± 7.8 | 0.582 |
| MUACb (mm) | 260 ± 23 | 263 ± 24 | 0.682 |
| Hemoglobin (g/liter) | 102 ± 16 | 106 ± 24 | 0.619 |
| Malaria (n) | 2 | 1 | |
| Calories (kcal/day) | 2,065 ± 656 | 1,701 ± 486 | 0.160* |
| Protein (g/day) | 67 ± 12 | 63 ± 19 | 0.582 |
| Carbohydrates (g/day) | 326 ± 96 | 264 ± 96 | 0.160* |
| Fat (g/day) | 60 ± 35 | 49 ± 19 | 0.386 |
| Vitamin B12 (μg/day) | 1.47 ± 0.83 | 1.41 ± 1.48 | 0.851 |
| Thiamine (mg/day) | 1.00 ± 0.28 | 0.82 ± 0.19 | 0.141* |
| Calcium (mg/day) | 488 ± 148 | 190 ± 92 | 1.77E–7* |
| Vitamin A (RAE/day, median [IQR])c | 353 (129–985) | 155 (102–268) | 0.336 |
| Folate (μg/day) | 301 ± 160 | 224 ± 106 | 0.211* |
| Iron (mg/day) | 44 ± 34 | 30 ± 22 | 0.304 |
| Zinc (mg/day) | 6.4 ± 2.3 | 5.1 ± 1.0 | 0.142* |
| Blood vitamin A (μmol/liter) | 0.82 ± 0.25 | 0.88 ± 0.31 | 0.607 |
| Blood protein (g/liter) | 62.3 ± 8.6 | 54.8 ± 12.45 | 0.142* |
Values are expressed as averages and standard deviations unless indicated otherwise in column 1.
MUAC, mid-upper-arm circumference.
RAE, retinol activity equivalents; IQR, interquartile range.
*, uncorrected P value of <0.05.
TABLE 3.
Demographics and birth data for participants in the probiotic and control groups at the final visita
| Parameter | Probiotic (n = 9) | Control (n = 15) | q value |
|---|---|---|---|
| General data | |||
| Gestational age at birth (wk) | 40 ± 1 | 40 ± 2 | 0.976 |
| Age (yr) | 24.9 ± 3.4 | 26.0 ± 5.6 | 0.787 |
| Ht (m) | 1.58 ± 0.05 | 1.62 ± 0.05 | 0.598 |
| Wt (kg) | 56.2 ± 2.9 | 55.5 ± 6.7 | 0.973 |
| MUACb (mm) | 267 ± 19 | 260 ± 23 | 0.787 |
| Hemoglobin (g/liter) | 107 ± 12 | 111 ± 18 | 0.787 |
| No. of twin sets | 2 | 0 | |
| Infant | |||
| Male | 5 | 6 | |
| Female | 6 | 9 | |
| Age (days) | 13 ± 3 | 12 ± 2 | 0.787 |
| Wt (kg) | 3.5 ± 0.5 | 3.4 ± 0.4 | 0.787 |
| Length (cm) | 50.7 ± 2.9 | 48.7 ± 4.0 | 0.598 |
| Head circumference (cm) | 35.9 ± 1.3 | 35.3 ± 1.2 | 0.598 |
| MUAC (mm) | 11 ± 1 | 11 ± 1 | 0.787 |
| Diet | |||
| Calories (kcal/day) | 1,775 ± 565 | 2,068 ± 383 | 0.646 |
| Protein (g/day) | 83 ± 38 | 61 ± 18 | 0.598 |
| Carbohydrates (g/day) | 283 ± 131 | 363 ± 53 | 0.598 |
| Fat (g/day) | 44 ± 14 | 49 ± 24 | 0.787 |
| Vitamin B12 (μg/day) | 1.36 ± 1.14 | 0.51 ± 0.66 | 0.598 |
| Thiamine (mg/day) | 0.85 ± 0.25 | 1.00 ± 0.29 | 0.598 |
| Calcium (mg/day) | 394 ± 139 | 109 ± 11 = 2 | 0.003 |
| Vitamin A (RAE/day, median [IQR])c | 190 (107–252) | 85 (31–302) | 0.899 |
| Folate (μg/day) | 137 ± 66 | 157 ± 65 | 0.787 |
| Iron (mg/day) | 67 ± 38 | 56 ± 46 | 0.787 |
| Zinc (mg/day) | 5.1 ± 2.1 | 6.4 ± 1.6 | 0.141 |
| Blood | |||
| Blood vitamin A (μmol/liter) | 1.29 ± 0.34 | 1.58 ± 0.59 | 0.598 |
| Blood protein (g/liter) | 62.13 ± 9.09 | 62.73 ± 12.22 | 0.598 |
| Breast milk | |||
| Fat (g/dl) | 2.54 ± 0.26 | 2.80 ± 0.46 | 0.598 |
| Carbohydrates (g/dl) | 5.75 ± 0.18 | 5.78 ± 0.16 | 0.787 |
| Protein (g/dl) | 1.09 ± 0.06 | 1.14 ± 0.15 | 0.787 |
Values represent means and standard deviations unless indicated otherwise in column 1.
MUAC, mid-upper-arm circumference.
RAE, retinol activity equivalents; IQR, interquartile range.
Microbiome findings.
Nutritional status did not correlate with a difference in microbiota profiles between groups at any body site both by diversity indices (Fig. 2) or individual taxa (data not shown; determined by analysis with ALDEx2, which determines differential abundances for taxa that are robust to technical replication and that pass a stringent false discovery rate cutoff [31, 32]). It can be noted there was a nonsignificant trend of increased microbial diversity in undernourished mother's breast milk and their infants oral cavities; this was not significant after multiple testing correction. After initial analysis of the dietary data, blood protein, and vitamin A (Table 1) and the bacterial communities, the classification based on nutritional status was rejected, and participants were grouped as those receiving Moringa-enriched probiotic supplementation (n = 23, 14 undernourished) or those who did not (n = 24, 7 undernourished).
FIG 2.

PCoAs of weighted UniFrac distances (A) and Shannon's diversity index of samples taken at enrollment and birth (B) show no effect of nourishment-status (N, nourished; UN, undernourished) on the microbiota at studied body sites.
The mothers' gut microbiotas were generally dominated by Prevotella (Fig. 3) but the L. rhamnosus probiotic is not visible since it comprises a near-undetectable fraction of the fecal microbiota. For the oral microbiota, Streptococcus, Prevotella, Fusobacterium, Porphyromonas, and other known oral commensals and pathogens were detected, while the vaginal profiles were predominantly dominated by Lactobacillus (Fig. 3). Clear clustering by body site was observed in PCoA using the Bray-Curtis dissimilarity measure, with the observation that the infants' oral and fecal microbiota seemed most closely related to breast milk (Fig. 4A). At both 0 to 10 days after birth and 10 to 25 days after birth, there was more similarity between the infant's oral microbiota and their mother's breast milk microbiota, than between the infant's feces and their mother's milk (Fig. 4B, P < 0.0001, FDR-corrected Welch's t test).
FIG 4.

(A) PCoA of Bray-Curtis dissimilarities shows distinct clustering of samples based on body site. The infant's oral and fecal microbiomes cluster most closely with the breast milk. (B) Analysis of weighted UniFrac distances shows that the oral sample of a baby is more similar to their own mother than their fecal sample. At both 0 to 10 days after birth and 10 to 25 days after birth, there was more similarity between the infant's oral sample and their mother's breast milk (n = 22, 0 to 10 days; n = 27, 10 to 25 days) than between the infant's fecal sample (n = 25, 0 to 10 days; n = 29, 10 to 25 days) to their mother's breast milk (Fig. 2B, P < 0.0001 [FDR-corrected Welch's t test]). There is also a nonsignificant trend that an infant's oral microbiota is more similar to their own mother's breast milk microbiota than that of other mothers.
To determine the effect of probiotic administration, differences in the microbiota of each group at each body site were examined chronologically relative to enrollment using weighted UniFrac distances (Fig. 5A), and no clear trend was detected comparing probiotic to control groups. When the infants of mothers in the probiotic and control groups are compared by PCoA of weighted UniFrac distances, weak clustering by treatment group was observed (Fig. 5B). The OTUs were summarized to genus level which revealed a 3-fold increase in relative abundance of Bifidobacterium and a 16.8-fold decrease in unclassified Enterobacteriaceae in the feces of infants whose mothers consumed the yogurt (P < 0.05 [FDR-corrected Wilcoxon rank-sum], Fig. 5C). This trend was not observed in the breast milk, nor was the primary macronutrient composition of the milk altered by yogurt intake (Table 3).
FIG 5.

(A) Microbiota analysis by weighted UniFrac distances comparing samples to enrollment show that Moringa-supplemented probiotic yogurt does not affect the microbiota structure and that the oral and fecal microbiotas remain stable over pregnancy. The vaginal microbiota appears to be significantly altered at birth regardless of consumption of yogurt. (B) The fecal microbiota of infants aged 10 to 25 days who consumed the yogurt weakly clusters separately from controls by PCoA of weighted UniFrac distances (red = control, blue = probiotic). (C) There is in an increase in the relative abundance of Bifidobacterium (Bifido) and decrease in Enterobacteraceae (Entero) (FDR-corrected Wilcoxon rank-sum test < 0.05) in the feces of the infants whose mother's received probiotic yogurt intervention (n = 10) compared to controls (n = 12). This difference was not present in the breast milk (P > 0.05).
The vaginal microbiota showed a distinct change in beta diversity over gestational time irrespective of treatment group while the oral and fecal microbiotas did not (Fig. 5A). To analyze this finding further, Shannon diversity index was considered over time (Fig. 6A) showing a significant increase in alpha diversity in the 10 days after birth to a predominantly BV-type communities as indicated by Nugent score (Fig. 6B, P < 0.001 [Welch's t test]). In the postnatal period, there was a decrease in Lactobacillus with an increase in BV-associated organisms such as Prevotella, Veillonella, Poryphromonas, and Megasphaera (Fig. 6C, n = 32 participants, P < 0.05 [FDR-corrected paired Wilcoxon test]).
DISCUSSION
This study reports the oral, gut, vaginal, and breast milk microbiotas of pregnant Tanzanian women and assesses the effects of consumption of micronutrient-supplemented probiotic yogurt. None of the mothers or infants died during labor. This finding, plus the low incidence of preterm labor, no underweight births, and no serious malnutrition, suggested that this particular rural population did not typify the Tanzanian situation as a whole, where the maternal mortality rate is 38.3 times higher than in Canada and the infant mortality under 1 year of age is 7.6 times higher (3). Sample size aside, according to the UNICEF statistics, we would expect two infant deaths in a cohort of this size. There is an association between an aberrant urogenital microbiota and preterm labor (36), but the incidence of the latter was low in this patient group (32%) and similar to that found in London, Canada (M. Mottola, M. Enos, and G. Reid, unpublished data). Likewise, periodontal disease with poor oral hygiene has been linked with preterm labor (37), but the Tanzanian women studied here did not present with acute periodontal disease as identified during their examinations, and their oral microbiotas showed no obvious abnormality. Thus, with two risk factors for preterm delivery being absent, it was not surprising to find such a low rate of premature births. Nevertheless, this is all the more laudable since many subjects had poor caloric intake. In Tanzania, normally only ca. 50% women have a skilled attendant at birthing according to UNICEF, and many women have poor access to obstetrical care. The provision of the latter in our study may have reduced the preterm labor rate and improved maternal outcome, albeit the majority of the women delivered at home.
In these settings, access to Moringa and cow's milk is good, making it feasible to have the yogurt produced locally. Although the yogurt was provided here free of charge, the community kitchen continues to operate and sell the product at a price (around $0.15) affordable to members of the community. This is important for sustainability.
We had expected that the daily Moringa yogurt consumption would have improved nutritional parameters in women presenting with a MUAC of <235 mm (undernourished group), since this food provided a good portion of the required daily intake of calcium, vitamins, and proteins. However, the baseline levels of hemoglobin, blood retinol, and protein concentrations suggested they were not actually overtly malnourished. It is highly probable that our study suffered from a lack of power and that with an increased sample size, we may have been able to conclusively demonstrate clinical outcomes as a result of the Moringa-supplemented yogurt consumption. A previous study in Mwanza, Tanzania, using a different combination of micronutrients supplemented in yogurt showed benefits to HIV-positive subjects (9). Given the previously reported protective effect of probiotic yogurt supplemented with L. rhamnosus GR-1 and Moringa on increasing blood levels of mercury and arsenic (38), it is important to note that no difference in hemoglobin was found, suggesting that probiotic consumption did not negatively affect absorption of necessary trace elements such as iron.
The mothers' gut microbiotas were generally dominated by Prevotella, in agreement with previous reports on children from Burkina Faso, Malawi, and Tanzania (15, 38, 39) and adults (40). Potentially, this reflects a high-carbohydrate diet, which was noted in the dietary recalls.
The vaginal profiles were dominated by Lactobacillus species, similar to previous findings for American and Brazilian nonpregnant women (41–45) and for pregnant Canadian women (Mottola et al., unpublished). It has long been believed that the vaginal tract is seeded from the rectum (44), and thus pathogens ascend and colonize. One would therefore expect that significantly different fecal microbiota patterns would result in differences among vaginal bacterial profiles. However, this is not the case here or in other studies, suggesting that the reproductive tract has evolved receptivity to certain constituents of the gut, mainly lactobacilli, and an ability to repel others. This niche adaptation warrants further investigation.
Rapid development of an aberrant vaginal microbiota immediately after birth is also an interesting finding. A similar discovery was recently reported by Huang et al. (46); however, that study was limited in the following ways: (i) it was a cross-sectional design as opposed to longitudinal in the present study, (ii) postpartum samples were an average of 7 weeks after birth as opposed to 0 to 10 days in the present study, and (iii) the sample size of postpartum individuals was only 5. Since our study showed stability in the fecal microbiota from the second trimester until after birth, this adds to previous findings of the microbiome across pregnancy in Finish women (12), where the first and third trimesters showed dramatic community shifts. A strength of the present study is that, unlike previous reports, we examined all three communities (fecal, oral, and vaginal) simultaneously.
The significant increase in the relative abundance of Bifidobacterium spp. and a decrease in Enterobacteriaceae in the newborn gut of babies born to mothers who had received the yogurt is noteworthy. All of the mothers breast-fed, so, since glycans in the milk promote bifidobacterial growth (47), it is not clear why only the milk from probiotic-treated mothers further increased relative abundances of these organisms. We found no significant differences in milk microbiotas and fat, carbohydrate, or protein concentrations between the two groups of women. Given the complex cocktail of bifidogenic glycans and bioactive compounds in breast milk, it will be necessary to apply further glycomic, proteomic and metabonomic approaches to study the mechanisms through which micronutrient and probiotic supplementation may affect breast milk composition and the infant's microbiota. Perhaps specific milk oligosaccharides increase following micronutrient/probiotic supplemented yogurt consumption.
The milk clearly supported a diverse range of organisms, which then colonized the newborn's intestine and oral cavity. Unlike North American society, where caesarian delivery and use of infant formula is widespread, the women in this Mwanza community almost all deliver vaginally and breast-feed their babies. With inflammatory bowel disease and allergies increasing in Canadian children, potentially linked to environmental factors, including caesarian section and formula feeding (48, 49), other lessons may be learned from studying pregnant women in eastern Africa.
In summary, daily ingestion of yogurt supplemented with probiotic L. rhamnosus GR-1 and locally sourced micronutrient-rich Moringa-supplemented probiotic yogurt provided a safe, inexpensive food for pregnant women in rural Tanzania, without adversely changing gut or oral microbial diversity. The baseline nutritional deficiencies illustrated the problems faced by pregnant women in this region; however, no effects of yogurt supplementation were observed in the clinical parameters. The resultant improvement in the gut microbial profile of infants suggests consumption of this yogurt could be beneficial in this and other developing world settings but requires further work to understand the mechanism of action.
ACKNOWLEDGMENTS
We thank the Lab Scientists at NIMR Mwanza for providing access to their facility and the African Probiotic Yogurt Network for logistical support and the Buswelu yogurt kitchen for producing the probiotic yogurts.
J.E.B. and M.E. are recipients of NSERC Canada Graduate Scholarships. Funding was received from the Bill and Melinda Gates Foundation. The funding sources for this work were not involved in the collection, analysis, or decision to publish this work.
J.E.B., M.K.E., G.P., J.P.B., and G.R. designed the study. J.E.B., M.K.E., G.P., and S.S. collected the samples and oversaw the field studies. J.E.B., M.K.E., G.P., S.S., J.M.M., S.C., D.W., R.K., C.F., G.F., G.B.G., and G.R. analyzed and interpreted the results. J.E.B., M.E., and G.R. prepared the manuscript. G.R. had primary responsibility for final content of the manuscript. All authors read and approved the final manuscript.
REFERENCES
- 1.FAO. 2014. State of food insecurity in the world. Food and Agriculture Organization of the United Nations, Rome, Italy: http://www.fao.org/publications/sofi/2014/en/. [Google Scholar]
- 2.Centers for Disease Control and Prevention. 2014. ImmPaCt: International micronutrient malnutrition prevention and control program. Centers for Disease Control and Prevention, Atlanta, GA: http://www.cdc.gov/immpact/micronutrients/. [Google Scholar]
- 3.UNICEF. 2013. Statistics: United Republic of Tanzania. UNICEF, New York, NY: http://www.unicef.org/infobycountry/tanzania_statistics.html. [Google Scholar]
- 4.Tanzania National Bureau of Statistics. 2011. Measure DHS. Tanzania 2010 DHS final report. National Bureau of Statistics, Dar es Salaam, Tanzania. [Google Scholar]
- 5.Masanja H, Smith ER, Muhihi A, Briegleb C, Mshamu S, Ruben J, Noor RA, Khudyakov P, Yoshida S, Martines J, Bahl R, Fawzi WW, Neovita Tanzania Study Group. 2014. Effect of neonatal vitamin A supplementation on mortality in infants in Tanzania (Neovita): a randomised, double-blind, placebo-controlled trial. Lancet 385:1324–1332. doi: 10.1016/S0140-6736(14)61731-1. [DOI] [PMC free article] [PubMed] [Google Scholar]
- 6.Franz CMAP, Huch M, Mathara JM, Abriouel H, Benomar N, Reid G, Gálvez A, Holzapfel WH. 2014. African fermented foods and probiotics. Int J Food Microbiol 190:84–96. doi: 10.1016/j.ijfoodmicro.2014.08.033. [DOI] [PubMed] [Google Scholar]
- 7.Reid MKE, Gough R, Enos M, Reid G. 2013. Social businesses in Tanzania tackling health issues of the Millennium Development Goals, one community kitchen at a time. J Soc Bus 3:24–39. [Google Scholar]
- 8.Irvine SL, Hummelen R, Hekmat S, Looman CW, Habbema JD, Reid G. 2010. Probiotic yogurt consumption is associated with an increase of CD4 count among people living with HIV/AIDS. J Clin Gastroenterol 44:e201–e205. doi: 10.1097/MCG.0b013e3181d8fba8. [DOI] [PubMed] [Google Scholar]
- 9.Hummelen R, Hemsworth J, Changalucha J, Butamanya NL, Hekmat S, Habbema JD, Reid G. 2011. Effect of micronutrient and probiotic fortified yogurt on immune-function of anti-retroviral therapy naive HIV patients. Nutrients 3:897–909. doi: 10.3390/nu3100897. [DOI] [PMC free article] [PubMed] [Google Scholar]
- 10.Hullar MA, Lampe JW. 2012. The gut microbiome and obesity. Nestle Nutr Inst Workshop Ser 73:67–79. doi: 10.1159/000341288. [DOI] [PubMed] [Google Scholar]
- 11.Roager HM, Licht TR, Poulsen SK, Larsen TM, Bahl MI. 2014. Microbial enterotypes, inferred by the Prevotella-to-Bacteroides ratio, remained stable during a 6-month randomized controlled diet intervention with the new Nordic diet. Appl Environ Microbiol 80:1142–1149. doi: 10.1128/AEM.03549-13. [DOI] [PMC free article] [PubMed] [Google Scholar]
- 12.Collado MC, Isolauri E, Laitinen K, Salminen S. 2008. Distinct composition of gut microbiota during pregnancy in overweight and normal-weight women. Am J Clin Nutr 88:894–899. [DOI] [PubMed] [Google Scholar]
- 13.Koren O, Goodrich JK, Cullender TC, Spor A, Laitinen K, Bäckhed HK, Gonzalez A, Werner JJ, Angenent LT, Knight R, Bäckhed F, Isolauri E, Salminen S, Ley RE. 2012. Host remodeling of the gut microbiome and metabolic changes during pregnancy. Cell 150:470–480. doi: 10.1016/j.cell.2012.07.008. [DOI] [PMC free article] [PubMed] [Google Scholar]
- 14.Jost T, Lacroix C, Braegger C, Chassard C. 2014. Stability of the maternal gut microbiota during late pregnancy and early lactation. Curr Microbiol 68:419–427. doi: 10.1007/s00284-013-0491-6. [DOI] [PubMed] [Google Scholar]
- 15.De Filippo C, Cavalieri D, Di Paola M, Ramazzotti M, Poullet JB, Massart S, Collini S, Pieraccini G, Lionetti P. 2010. Impact of diet in shaping gut microbiota revealed by a comparative study in children from Europe and rural Africa. Proc Natl Acad Sci U S A 107:14691–14696. doi: 10.1073/pnas.1005963107. [DOI] [PMC free article] [PubMed] [Google Scholar]
- 16.Cotillard A, Kennedy SP, Kong LC, Prifti E, Pons N, Le Chatelier E, Almeida M, Quinquis B, Levenez F, Galleron N, Gougis S, Rizkalla S, Batto J-M, Renault P, ANR MicroObes consortium, Doré J, Zucker J-D, Clément K, Ehrlich SD, Blottière H, Leclerc M, Juste C, de Wouters T, Lepage P, Fouqueray C, Basdevant A, Henegar C, Godard C, Fondacci M, Rohia A, Hajduch F, Weissenbach J, Pelletier E, Le Paslier D, Gauchi J-P, Gibrat J-F, Loux V, Carré W, Maguin E, van de Guchte M, Jamet A, Boumezbeur F, Layec S. 2013. Dietary intervention impact on gut microbial gene richness. Nature 500:585–588. doi: 10.1038/nature12480. [DOI] [PubMed] [Google Scholar]
- 17.Mysorekar IU, Cao B. 2014. Microbiome in parturition and preterm birth. Semin Reprod Med 32:50–55. doi: 10.1055/s-0033-1361830. [DOI] [PubMed] [Google Scholar]
- 18.Gruszfeld D, Socha P. 2013. Early nutrition and health: short- and long-term outcomes. World Rev Nutr Diet 108:32–39. doi: 10.1159/000351482. [DOI] [PubMed] [Google Scholar]
- 19.O'Sullivan A, He X, McNiven EMS, Haggarty NW, Lönnerdal B, Slupsky CM. 2013. Early diet impacts infant rhesus gut microbiome, immunity, and metabolism. J Proteome Res 12:2833–2845. doi: 10.1021/pr4001702. [DOI] [PubMed] [Google Scholar]
- 20.González R, Maldonado A, Martín V, Mandomando I, Fumadó V, Metzner KJ, Sacoor C, Fernández L, Macete E, Alonso PL, Rodríguez JM, Menendez C. 2013. Breast milk and gut microbiota in African mothers and infants from an area of high HIV prevalence. PLoS One 8:e80299. doi: 10.1371/journal.pone.0080299. [DOI] [PMC free article] [PubMed] [Google Scholar]
- 21.Martinez RCR, Franceschini SA, Patta MC, Quintana SM, Gomes BC, De Martinis ECP, Reid G. 2009. Improved cure of bacterial vaginosis with single dose of tinidazole (2g), Lactobacillus rhamnosus GR-1, and Lactobacillus reuteri RC-14: a randomized, double-blind, placebo-controlled trial. Can J Microbiol 55:133–138. doi: 10.1139/W08-102. [DOI] [PubMed] [Google Scholar]
- 22.Wenner M. 2009. A cultured response to HIV. Nat Med 15:594–597. doi: 10.1038/nm0609-594. [DOI] [PubMed] [Google Scholar]
- 23.Van Tienen A, Hullegie YM, Hummelen R, Hemsworth J, Changalucha J, Reid G. 2011. Development of a locally sustainable functional food for people living with HIV in Sub-Saharan Africa: laboratory testing and sensory evaluation. Benef Microbes 2:193–198. doi: 10.3920/BM2011.0024. [DOI] [PubMed] [Google Scholar]
- 24.Thurber MD, Fahey JW. 2009. Adoption of Moringa oleifera to combat under-nutrition viewed through the lens of the “Diffusion of Innovations” theory. Ecol Food Nutr 48:212–225. doi: 10.1080/03670240902794598. [DOI] [PMC free article] [PubMed] [Google Scholar]
- 25.Gueri M, Jutsum P, Sorhaindo B. 1982. Anthropometric assessment of nutritional status in pregnant women: a reference table of weight-for-height by week of pregnancy. Am J Clin Nutr 35:609–616. [DOI] [PubMed] [Google Scholar]
- 26.Nugent RP, Krohn MA, Hillier SL. 1991. Reliability of diagnosing bacterial vaginosis is improved by a standardized method of Gram stain interpretation. J Clin Microbiol 29:297–301. [DOI] [PMC free article] [PubMed] [Google Scholar]
- 27.Lukmanji Z, Hertznark E (ed). 2008. Tanzania food composition tables. MUHAS/TNFC, Dar Es Salaam, Tanzania, and HSPH, Boston, MA: http://cdn1.sph.harvard.edu/wp-content/uploads/sites/30/2012/10/tanzania-food-composition-tables.pdf. [Google Scholar]
- 28.Caporaso JG, Lauber CL, Walters WA, Berg-Lyons D, Huntley J, Fierer N, Owens SM, Betley J, Fraser L, Bauer M, Gormley N, Gilbert JA, Smith G, Knight R. 2012. Ultra-high-throughput microbial community analysis on the Illumina HiSeq and MiSeq platforms. ISME J 6:1621–1624. doi: 10.1038/ismej.2012.8. [DOI] [PMC free article] [PubMed] [Google Scholar]
- 29.Caporaso JG, Kuczynski J, Stombaugh J, Bittinger K, Bushman FD, Costello EK, Fierer N, Peña AG, Goodrich JK, Gordon JI, Huttley GA, Kelley ST, Knights D, Koenig JE, Ley RE, Lozupone CA, McDonald D, Muegge BD, Pirrung M, Reeder J, Sevinsky JR, Turnbaugh PJ, Walters WA, Widmann J, Yatsunenko T, Zaneveld J, Knight R. 2010. QIIME allows analysis of high-throughput community sequencing data. Nat Methods 7:335–336. doi: 10.1038/nmeth.f.303. [DOI] [PMC free article] [PubMed] [Google Scholar]
- 30.McDonald D, Price MN, Goodrich J, Nawrocki EP, DeSantis TZ, Probst A, Andersen GL, Knight R, Hugenholtz P. 2012. An improved Greengenes taxonomy with explicit ranks for ecological and evolutionary analysis of bacteria and archaeal. ISME J 6:610–618. doi: 10.1038/ismej.2011.139. [DOI] [PMC free article] [PubMed] [Google Scholar]
- 31.Fernandes AD, Macklaim JM, Linn TG, Reid G, Gloor GB. 2013. ANOVA-Like Differential Expression (ALDEx) analysis for mixed population RNA-Seq. PLoS One 8:e67019. doi: 10.1371/journal.pone.0067019. [DOI] [PMC free article] [PubMed] [Google Scholar]
- 32.Fernandes AD, Reid JNS, Macklaim JM, McMurrough TA, Edgell DR, Gloor GB. 2014. Unifying the analysis of high-throughput sequencing datasets: characterizing RNA-seq, 16S rRNA gene sequencing and selective growth experiments by compositional data analysis. Microbiome 2:15. doi: 10.1186/2049-2618-2-15. [DOI] [PMC free article] [PubMed] [Google Scholar]
- 33.Fusch G, Choi A, Rochow N, Fusch C. 2011. Quantification of lactose content in human and cow's milk using UPLC-tandem mass spectrometry. J Chromatogr B Analyt Technol Biomed Life Sci 879:3759–3762. doi: 10.1016/j.jchromb.2011.09.053. [DOI] [PubMed] [Google Scholar]
- 34.Choi A, Fusch G, Rochow N, Sheikh N, Fusch C. 2013. Establishment of micromethods for macronutrient contents analysis in breast milk. Matern Child Nutr doi: 10.1111/mcn.12053. [DOI] [PMC free article] [PubMed] [Google Scholar]
- 35.Lönnerdal B, Smith C, Keen CL. 1984. Analysis of breast milk: current methodologies and future needs. J Pediatr Gastroenterol Nutr 3:290–295. doi: 10.1097/00005176-198403000-00023. [DOI] [PubMed] [Google Scholar]
- 36.Giraldo PC, Araújo ED, Junior JE, do Amaral RLG, Passos MRL, Gonçalves AK. 2012 The prevalence of urogenital infections in pregnant women experiencing preterm and full-term labor. Infect Dis Obstet Gynecol 2012:878241. doi: 10.1155/2012/878241. [DOI] [PMC free article] [PubMed] [Google Scholar]
- 37.Macedo JF, Ribeiro RA, Machado FC, Assis NMSP, Alves RT, Oliveira AS, Ribeiro LC. 2014. Periodontal disease and oral health-related behavior as factors associated with preterm birth: a case-control study in south-eastern Brazil. J Periodont Res 49:458–464. doi: 10.1111/jre.12124. [DOI] [PubMed] [Google Scholar]
- 38.Bisanz JE, Enos MK, Mwanga JR, Changalucha J, Burton JP, Gloor GB, Reid G. 2014. Randomized open-label pilot study of the influence of probiotics and the gut microbiome on toxic metal levels in Tanzanian pregnant women and school children. mBio 5:e01580-14. doi: 10.1128/mBio.01580-14. [DOI] [PMC free article] [PubMed] [Google Scholar]
- 39.Smith MI, Yatsunenko T, Manary MJ, Trehan I, Mkakosya R, Cheng J, Kau AL, Rich SS, Concannon P, Mychaleckyj JC, Liu J, Houpt E, Li JV, Holmes E, Nicholson J, Knights D, Ursell LK, Knight R, Gordon JI. 2013. Gut microbiomes of Malawian twin pairs discordant for Kwashiorkor. Science 339:548–554. doi: 10.1126/science.1229000. [DOI] [PMC free article] [PubMed] [Google Scholar]
- 40.Yatsunenko T, Rey FE, Manary MJ, Trehan I, Dominguez-Bello MG, Contreras M, Magris M, Hidalgo G, Baldassano RN, Anokhin AP, Heath AC, Warner B, Reeder J, Kuczynski J, Caporaso JG, Lozupone CA, Lauber C, Clemente JC, Knights D, Knight R, Gordon JI. 2012. Human gut microbiome viewed across age and geography. Nature 486:222–227. doi: 10.1038/nature11053. [DOI] [PMC free article] [PubMed] [Google Scholar]
- 41.Romero R, Hassan SS, Gajer P, Tarca AL, Fadrosh DW, Nikita L, Galuppi M, Lamont RF, Chaemsaithong P, Miranda J, Chaiworapongsa T, Ravel J. 2014. The composition and stability of the vaginal microbiota of normal pregnant women is different from that of non-pregnant women. Microbiome 2:4. doi: 10.1186/2049-2618-2-4. [DOI] [PMC free article] [PubMed] [Google Scholar]
- 42.Aagaard K, Riehle K, Ma J, Segata N, Mistretta T-A, Coarfa C, Raza S, Rosenbaum S, Van den Veyver I, Milosavljevic A, Gevers D, Huttenhower C, Petrosino J, Versalovic J. 2012. A metagenomic approach to characterization of the vaginal microbiome signature in pregnancy. PLoS One 7:e36466. doi: 10.1371/journal.pone.0036466. [DOI] [PMC free article] [PubMed] [Google Scholar]
- 43.Gajer P, Brotman RM, Bai G, Sakamoto J, Schütte UME, Zhong X, Koenig SSK, Fu L, Ma ZS, Zhou X, Abdo Z, Forney LJ, Ravel J. 2012. Temporal dynamics of the human vaginal microbiota. Sci Transl Med 4:132ra52. [DOI] [PMC free article] [PubMed] [Google Scholar]
- 44.Reid G. 2008. Probiotic lactobacilli for urogenital health in women. J Clin Gastroenterol 42(Suppl 3, Pt 2):S234–S236. doi: 10.1097/MCG.0b013e31817f1298. [DOI] [PubMed] [Google Scholar]
- 45.Martinez RCR, Franceschini SA, Patta MC, Quintana SM, Nunes AC, Moreira JLS, Anukam KC, Reid G, De Martinis ECP. 2008. Analysis of vaginal lactobacilli from healthy and infected Brazilian women. Appl Environ Microbiol 74:4539–4542. doi: 10.1128/AEM.00284-08. [DOI] [PMC free article] [PubMed] [Google Scholar]
- 46.Huang Y-E, Wang Y, He Y, Ji Y, Wang L-P, Sheng H-F, Zhang M, Huang Q-T, Zhang D-J, Wu J-J, Zhong M, Zhou H-W. 2014. Homogeneity of the vaginal microbiome at the cervix, posterior fornix, and vaginal canal in pregnant Chinese women. Microb Ecol 69:407–414. doi: 10.1007/s00248-014-0487-1. [DOI] [PubMed] [Google Scholar]
- 47.Sela DA, Mills DA. 2014. The marriage of nutrigenomics with the microbiome: the case of infant-associated bifidobacteria and milk. Am J Clin Nutr 99:697S–703S. doi: 10.3945/ajcn.113.071795. [DOI] [PMC free article] [PubMed] [Google Scholar]
- 48.Benchimol EI, Manuel DG, Guttmann A, Nguyen GC, Mojaverian N, Quach P, Mack DR. 2014. Changing age demographics of inflammatory bowel disease in Ontario, Canada: a population-based cohort study of epidemiology trends. Inflamm Bowel Dis 20:1761–1769. doi: 10.1097/MIB.0000000000000103. [DOI] [PubMed] [Google Scholar]
- 49.El-Matary W, Moroz SP, Bernstein CN. 2014. Inflammatory bowel disease in children of Manitoba: 30 years' experience of a tertiary center. J Pediatr Gastroenterol Nutr 59:763–766. doi: 10.1097/MPG.0000000000000525. [DOI] [PubMed] [Google Scholar]