

Abstract
Cortical reorganization occurring in multiple sclerosis (MS) patients is thought to play a key role in limiting the effect of structural tissue damage. Conversely, its exhaustion may contribute to the irreversible disability that accumulates with disease progression. Several aspects of MS-related cortical reorganization, including the overall functional effect and likely modulation by therapies, still remain to be elucidated. The aim of this work was to assess the extent of functional cortical reorganization and its brain structural/pathological correlates in Dark Agouti rats with experimental autoimmune encephalomyelitis (EAE), a widely accepted preclinical model of chronic MS. Morphological and functional MRI (fMRI) were performed before disease induction and during the relapsing and chronic phases of EAE. During somatosensory stimulation of the right forepaw, fMRI demonstrated that cortical reorganization occurs in both relapsing and chronic phases of EAE with increased activated volume and decreased laterality index versus baseline values. Voxel-based morphometry demonstrated gray matter (GM) atrophy in the cerebral cortex, and both GM and white matter atrophy were assessed by ex vivo pathology of the sensorimotor cortex and corpus callosum. Neuroinflammation persisted in the relapsing and chronic phases, with dendritic spine density in the layer IV sensory neurons inversely correlating with the number of cluster of differentiation 45-positive inflammatory lesions. Our work provides an innovative experimental platform that may be pivotal for the comprehension of key mechanisms responsible for the accumulation of irreversible brain damage and for the development of innovative therapies to reduce disability in EAE/MS.
SIGNIFICANCE STATEMENT Since the early 2000s, functional MRI (fMRI) has demonstrated profound modifications in the recruitment of cortical areas during motor, cognitive, and sensory tasks in multiple sclerosis (MS) patients. Experimental autoimmune encephalomyelitis (EAE) represents a reliable model of the chronic-progressive variant of MS. fMRI studies in EAE have not been performed extensively up to now. This paper reports fMRI studies in a rat model of MS with somatosensory stimulation of the forepaw. We demonstrated modifications in the recruitment of cortical areas consistent with data from MS patients. To the best of our knowledge, this is the first report of cortical remodeling in a preclinical in vivo model of MS.
Keywords: brain plasticity, cortical reorganization, experimental autoimmune encephalomyelitis, functional magnetic resonance imaging, multiple sclerosis, neuroimmunology
Introduction
Since the early 2000s, functional MRI (fMRI) studies have demonstrated profound modifications in the recruitment of cortical areas during motor, cognitive, and sensory tasks in multiple sclerosis (MS) patients (Reddy et al., 2000; Pantano et al., 2002; Comi et al., 2004). However, several aspects of cortical reorganization, including its functional effect and likely modulation by therapies, still remain to be elucidated (Schoonheim and Filippi, 2012). As such, the development of surrogate markers assessing cortical reorganization and underlying molecular/cellular mechanisms is still a key requirement for the improvement and refinement of therapeutic strategies in MS.
Unfortunately, the interpretation of fMRI human studies can be sometimes misleading, because some of the observed changes might be distorted by confounders that include the subjective ability in performing a given task, the amount of CNS inflammation, the age and gender, and ongoing treatments (Filippi and Rocca, 2004). Possible approaches to overcome some of these limitations include the recruitment of patients with no overt clinical symptomatology of the investigated functional system, the use of passive paradigms, or, more recently, the analysis of brain function at rest (Filippi and Rocca, 2013; Tona et al., 2014).
Nevertheless, the correlation of fMRI data to concurrent neuropathology is very difficult to achieve in MS patients, thus hindering any defined hypothesis on the involvement of specific pathophysiological mechanisms. In this respect, fMRI studies in laboratory animals with experimental autoimmune encephalomyelitis (EAE), a well established model of human MS, allow (1) reducing interindividual variability, (2) selecting the most appropriated experimental paradigms, and (3) performing correlative ex vivo CNS histopathology. Despite their potential relevance, experimental fMRI studies in EAE have not been performed extensively up to now (Nathoo et al., 2014).
Herein we have investigated disease-induced alterations of brain function and morphology by structural MRI and fMRI and neuropathology in Dark Agouti (DA) EAE rats. fMRI and morphological MRI experiments were performed before disease induction (baseline) and during the relapsing and chronic phases of EAE. During somatosensory stimulation of the right forepaw in EAE rats, we detected (1) significant increase of the activated cortical volume, (2) decrease of the laterality index, and (3) recruitment of additional areas (e.g., the thalamus and visual or secondary somatosensory regions) versus baseline. These findings are consistent with previously reported data from MS patients (Reddy et al., 2002). The observed functional modifications in EAE rats were paralleled by persistent brain inflammation, gray matter (GM) and white matter (WM) atrophy, and alterations in the dendritic tree and synaptic structure in the layer IV sensory neurons, as measured by ex vivo CNS histopathology.
To the best of our knowledge, this is the first report of cortical remodeling in a preclinical in vivo model of MS, thus providing a clinically relevant experimental platform that may be pivotal for the elucidation of key mechanisms of accumulation of irreversible disability and the development/testing of innovative therapies for MS.
Materials and Methods
Animals and EAE induction.
Male (8 weeks old) DA rats were purchased from Janvier and housed with access to water and food ad libitum, under controlled environmental parameters and veterinarian control in the animal facility of the University of Verona. All efforts were made to minimize the number of rats used and to avoid their suffering. EAE was induced in isoflurane-anesthetized rats by subcutaneous hindlimb footpad injection of 100 mg of syngenic spinal cord homogenate resuspended in 400 μl of incomplete Freund's adjuvant (IFA).
High-resolution T2-weighted (T2w) images for voxel-based morphometry (VBM) analysis were acquired serially in a group of 18 rats before EAE induction (baseline), then 30 d postinduction (dpi), and then 60 dpi. fMRI data were acquired serially in a separate group of an additional 10 rats before and after EAE induction, as above. To rule out a long-lasting effect of adjuvant oil injection on brain remodeling, fMRI studies were also performed in an additional four rats that were injected only with equivalent volumes of IFA. Ex vivo pathology was performed on a “satellite group” of eight EAE rats killed at 30 or 60 dpi (n = 4 each) and four control (CTRL) rats. Rats belonging to this satellite group were also examined by fMRI before being killed.
EAE clinical scores (0, healthy animals with no defective tail tonicity; 1, limp tail; 2, mild to moderate paraparesis of the hindlimbs; 3, paraplegia of the hindlimbs; 4, quadriplegia; 5, moribund or dead) were recorded daily, up to 60 dpi. Disease severity was quantified by determining the cumulative disease index (CDI) that was obtained by calculating the area under the curve of the clinical score over time for each subject, as described previously (Badovinac et al., 1998; MacKenzie-Graham et al., 2012).
The experimental plan received authorization from the Italian Ministry of Health (approval numbers 95/2012-B and 243/2013-B) and was approved by the local ethical committee. Animal work was conducted following Italian law (DL 1992 and subsequent modifications) and the European Union (2010/63/EU) directive.
Preparation of rats for MRI and fMRI.
MRI images were acquired using a Biospec Tomograph operating at 4.7 T, equipped with a Bruker BGA9 self-shielded gradient insert capable of providing maximum gradient intensity of 40 G/cm (Bruker). A double-coil configuration was used: the excitation radio frequency pulses were applied through a 7.2 cm bird cage volume coil, whereas the signal was received through a four-channel phased-array surface coil optimized for the rat brain (Bruker).
For morphological T2w MRI acquisitions, rats were pre-anesthetized with 2% isoflurane and anesthetized with 0.5–1% isoflurane in a mixture of 30% O2/70% N2. The experimental protocol for fMRI was adapted from the studies by Van Camp et al. (2006b) and Weber et al. (2006). Rats were pre-anesthetized with 2% isoflurane (in a mixture of 30% O2/70% N2) and placed in a heated animal bed with plastic retainers for the teeth and ears (Bruker). The respiratory rate and body temperature were monitored using a PC-SAM Small Animal Monitor (SA Instruments). Body temperature was maintained at 37–38°C through the heated animal bed. CO2 concentration in the blood was monitored using a TCM4 Transcutaneous Blood Gas Analyzer (Radiometer), and PCO2 remained within the physiological range (PCO2 of ∼40 mmHg). A needle was implanted subcutaneously in the abdominal region of the animals to intraperitoneally deliver 1 mg/ml medetomidine (Domitor; Janssen Animal Health) diluted 1:4 in saline and infused continuously at a rate of 1 μl · g−1 · h−1 by using a Harvard Apparatus infusion pump. After 30 min of Domitor infusion, isoflurane was interrupted gradually. To increase the sensitivity of the fMRI experiment, namely the contrast/noise ratio between activated and non-activated pixels, a superparamagnetic iron-oxide blood pool contrast agent (Endorem; Guerbet) was administered through the tail vein at a dosage of 3.75 μl/g (Van Camp et al., 2005).
Electrical right forepaw stimulation (Grass Electrical Stimulator; Grass Technologies) was delivered through needle electrodes inserted between digits 1–2 and 3–4 of the right forepaw. Based on preliminary tests performed in normal DA rats aimed at optimizing stimulation frequency and pulse width to elicit reproducible functional responses in animals, the stimulus was shaped as a squared pulse with 7 Hz frequency, 2 mA current, and 0.5 ms duration. Physiological parameters (body temperature, respiration rate, and PCO2) remained stable during the entire stimulation period. Because no blood pressure changes were reported under similar experimental conditions and up to 12 Hz and 10 ms width (Van Camp et al., 2006a), blood pressure was not monitored during this study, thereby avoiding the need of invasive artery catheterization surgery. The block design stimulation paradigm consisted of a rest period (60 s), followed by a stimulation period (20 s); during a single stimulation paradigm, 30 images were acquired under rest condition and 10 images under stimulation with a time resolution of 2 s. This paradigm was repeated six times for a total of 240 images acquired in 8 min (single session). The stimulation was applied four times in each subject with a time interval of ∼10 min. At the end of MRI experiments, medetomidine was antagonized by intraperitoneal injection of 5 mg/ml atipamezole (Antisedan; Pfizer) at a volume equal to four times the total volume of diluted medetomidine administered.
Image acquisition.
After a scout image acquired to position the rat brain in the magnet isocenter, T2w, transversal images were acquired by using a rapid acquisition with relaxation enhancement (RARE) sequence with the following parameters: TR, 5500 ms; TE, 76 ms; FOV, 3.5 × 3.5 cm2; matrix size, 128 × 128 (or 256 × 256 for high-resolution morphological images); slice thickness, 1 mm; and 25 contiguous slices acquired. After localized shimming procedure, performed by using the FASTMAP method of ParaVision (version 5.1; Bruker), fMRI images were acquired using multishot segmented gradient-echo echoplanar imaging (EPI) sequences with the following parameters: TR, 250 ms; TE, 5.9 ms; eight shots; FOV, 4.0 × 4.0 cm2; matrix size, 128 × 64. Ten transversal 2-mm-thick slices were acquired starting 2 mm from the rhinal fissure in the caudal direction to cover the forebrain and midbrain. Multishot segmentation was used to reduce distortion introduced by EPI sequences, and navigator echoes were used to suppress motion artifacts. Acquisition of fMRI started ∼30 min after isoflurane was discontinued and 20 min after contrast agent administration to have a plateau in the brain signal (Schwarz et al., 2006).
Analysis of fMRI data.
fMRI data were analyzed by using the FSL [Functional MRI of the Brain (FMRIB) Software Library] software package (http://fsl.fmrib.ox.ac.uk/fsl/fslwiki/). EPI images were converted into NIFTI file format to preserve the original scanner orientation but with a 10× scale factor on the voxel size to be FSL compliant for subsequent processing. Before functional analysis, each volume of data was coregistered by FSL/FLIRT (FMRIB Linear Image Registration Tool; Smith et al., 2004) with a 12 degrees of freedom (df) linear registration algorithm and trilinear interpolation to a high-resolution rat brain template (Schwarz et al., 2006; Tambalo et al., 2009). The structures outside the brain (skull, muscles, and surrounding tissues) were then excluded using an intracranial binary mask extracted from the rat brain template. Motion correction was applied to reduce artifacts caused by physiological and uncontrolled movement of the rat inside the scanner during the acquisition; for this purpose, the FSL/MCFLIRT (FMRIB Linear Image Registration Tool with Motion Correction) tool (Smith et al., 2004) was used by applying 6 df (three translations and three rotations) rigid-body registration to the first volume acquired in every subject, used as reference. Slice timing correction was performed by sinc interpolation to shift the acquisition time of each slice by an appropriate fraction of TR. A spatial smoothing step with FWHM set to 3 mm (corresponding to 0.3 mm on the original voxel size) was introduced to reduce noise without affecting the sensitivity to small areas of activation.
To reduce hardware noise and low-frequency signal drifts, data were finally high-pass filtered in time by using a cutoff frequency of 0.0125 Hz that was chosen according to FSL specifications and taking into account the time dependence of the stimulation paradigm. Single-subject general linear model (GLM) analysis was performed (at the session level) to convolve the stimulation paradigm with a gamma-variate standard HRF function. To detect positive and negative changes in blood volume, fMR images were analyzed by considering the time dependence of the inverted [increased cerebral blood volume (CBV)] or uninverted (decreased CBV) stimulus. Different sessions were then combined with a fixed-effect estimation of the variance. Z-score maps on the single subject were threshold at Z > 2.3 with a cluster-corrected significance of p < 0.01. Individual activation maps were then used to obtain a group-level estimation of the functional response. The last analysis was performed in FSL/FEAT ((FMRIB fMRI Expert Analysis Tool; Smith et al., 2004) by setting FLAME 1 (FMRIB Local Analysis of Mixed Effects 1; Bayesian local analysis of mixed effect) to model the cross-subjects variance and to estimate the statistical maps at the group level with Z > 5.6 and p < 0.01 (corrected).
The abovementioned high-resolution rat brain template (Schwarz et al., 2006; Tambalo et al., 2009), coregistered to a digital version of the anatomical rat brain atlas (Paxinos and Watson, 1998), was used to map activated voxels on the different brain regions. Some quantitative indices were then extracted: (1) the total number of activated voxels (proportional to the total activated volume); (2) the laterality index (LI) defined as the ratio (C − I)/(C + I), where C represented the number of activated voxels in the contralateral hemisphere and I that in the ipsilateral one to the stimulated forelimb (Dijkhuizen et al., 2001); and (3) the number of activated voxels included in a given anatomical region divided by the total number of activated voxels. This ratio, named Act%, provides a quantitative index of the anatomical distribution of activated volumes. Such an index was considered for those brain regions in which its value was above 1% in one of the investigated time points. Group activation maps were used for display purposes, whereas numerical values of the evaluated parameters were obtained by averaging data from single animals. Of note, the parameter Act% was not calculated on the cerebellum because the slice coverage in fMRI experiments was limited to the forebrain and midbrain.
VBM.
T2w RARE images, acquired at high resolution, were analyzed by VBM to investigate voxelwise differences in local GM volume. Baseline images versus EAE at 30 dpi and baseline versus EAE at 60 dpi were investigated separately. Automated VBM analysis was performed using FSL (Smith et al., 2004). Bias-field-corrected brain images were used to remove extracranial tissue using FSL BET (FMRIB Brain Extraction Tool). The resulting images were then segmented into GM, WM, and CSF using FSL FAST4 (FMRIB Automated Segmentation Tool 4; Smith et al., 2004). Given the lack of information on the probability distribution of different tissue classes in the rat brain, the images were segmented using an intensity-based tissue classification kernel. The kernel was set to classify brain tissue into six classes for a more refined classification of T2w images of the rodent brain (two GM classes, one CSF class, two WM classes, and one extra-brain CSF and residual tissue class; Li et al., 2009; Gozzi et al., 2013). The two GM compartments captured independent portions of GM and were added to constitute the final GM class used for statistical analysis.
In the first step of the analysis, two initial reference GM templates were created by averaging group-balanced GM images (the first template was obtained by averaging baseline rats and 30 dpi rats and the second template by averaging baseline rats and 60 dpi rats) that were registered by affine transformation (Jenkinson et al., 2002) to a representative GM volume (obtained by the rat brain template mentioned above). The linear template thus obtained was then used as reference for an additional round of nonlinear registrations: individual GM volumes were registered to the linear template using the FSL FNIRT (FMRIB Nonlinear Image Registration Tool) algorithm (Schnabel et al., 2003). According to the standard procedure in FSL, the resulting images were averaged, the average image was then flipped along the x-axis, and the two mirror images were re-averaged to obtain the final GM study template with no left–right asymmetry. In the second step of the analysis, individual GM partial volumes images (baseline, n = 18; 30 dpi, n = 18; 60 dpi, n = 18) were registered to the final GM study template and then modulated (to correct for local expansion or contraction) by the Jacobian of the warp field, as described previously (Ashburner and Friston, 2000; Douaud et al., 2007). The modulated segmented images were then smoothed with an isotropic Gaussian kernel with a σ of 2.0 mm (corresponding to 0.2 mm on the original voxel size). Finally, a voxelwise GLM was applied on the registered and modulated partial volume images, using permutation-based nonparametric testing and correcting for multiple comparisons across space (Nichols and Holmes, 2002). The null distribution for the data in the VBM statistics was built over 100,000 permutations.
To quantitatively obtain the GM distribution in different anatomical regions of the brain, a volumetric reconstruction of the digital anatomical rat brain atlas (Paxinos and Watson, 1998) was coregistered with GM images. GM volumes were then extracted for each region of the cerebral cortex, and statistically significant differences were analyzed.
Tissue pathology.
Rats were anesthetized deeply and perfused transcardially with 250 ml of PBS with 0.5 m EDTA, followed by 250 ml of paraformaldehyde (4% in PBS). Brains were dissected carefully, postfixed overnight, and embedded in tissue-freezing medium for cryostat sectioning. Coronal 30-μm-thick sections were then cut serially for stereological analyses.
Quantification of active inflammatory load.
Immunohistochemistry for quantification of inflammation was performed using rabbit anti-ionized calcium-binding adapter molecule 1 (Iba1; 1:250; Wako), rat anti-cluster of differentiation (CD45; 1:100; BD Biosciences), and chicken anti-microtubule associated protein-2 (MAP2; 1:500; Abcam) as primary antibodies. Appropriate anti-rat, anti-rabbit, and anti-chicken fluorophore (Alexa Fluor 488, 546, and 633; Invitrogen)-conjugated secondary antibodies were used. Nuclei were counterlabeled with 4′-6-diamidino-2-phenylindole (DAPI; Roche). Immunofluorescence staining was evaluated with a CCD camera (DC 480; Leica) under a fluorescence microscope (BX51; Olympus). Photographs of CD45-positive (CD45+) inflammatory lesions on a 10× objective lens were collected on an average of 10 equally spaced sections per rat. Lesions were marked with NIH ImageJ and expressed as the number of inflammatory infiltrates and mean CD45+ area (mm2) per brain section ± SEM. Representative reconstructions of lesion load were obtained with the Neurolucida software (MicroBrightField).
Quantification of sensorimotor cortex and striatal volumes.
Immunohistochemistry for quantification of cortical thickness was performed using a mouse anti-neuronal nuclei (NeuN) primary antibody (1:250; Millipore) with a biotinylated goat anti-mouse secondary antibody (Vector Laboratories). Endogenous peroxidase activity was blocked with an avidin/biotin blocking kit (Vector Laboratories), and sections were stained with the VectastainABC kit (Vector Laboratories), followed by the liquid DAB+ substrate (Dako). Nuclei were counterstained with hematoxylin. The sensorimotor cortex and the striatum of both hemispheres were outlined using the Neurolucida software, and descriptive 3D reconstructions were obtained for nine equally spaced sections (from the frontal pole to bregma −3 mm). Data were averaged between the two hemispheres and expressed as total volume (cubic millimeters) ± SEM.
Measurement of the corpus callosum.
The thickness of the corpus callosum (CC) was evaluated on three adjacent coronal brain sections (at the level of bregma) stained with Luxol fast blue/periodic-acid Schiff staining. Photographs were taken at 4× magnification, and quantification was performed by outlining the area covered by the CC from the midline up to 1 mm lateral to midline with NIH ImageJ as described previously (Bacigaluppi et al., 2009). Data from the two hemispheres were averaged and expressed as mean area (square millimeters) ± SEM.
Analysis of dendritic arborizations.
We focused on the forepaw sensorimotor cortex (between bregma 1.6 mm and −2.1 mm) and the sensory ventroposterior (VP) thalamic nucleus (between bregma −2.1 mm and −4.5 mm). Three adjacent coronal brain sections were stained with a chicken anti-MAP2 (1:500; Abcam) primary antibody, followed by an anti-chicken fluorophore (Alexa Fluor 546)-conjugated secondary antibody. Nuclei were counterlabeled with DAPI. Immunofluorescence stainings were evaluated with a CCD camera under a fluorescence microscope, and photographs of equally distanced regions of interest (ROIs) on a 40× objective lens were collected in the sensorimotor cortex (n = 4 ROIs) and the VP thalamic nucleus (n = 2 ROIs). Photographs were analyzed with NIH ImageJ, and data were expressed as mean fluorescence intensity ± SEM.
Analysis of layer IV spiny neurons.
Layer IV sensory neurons were analyzed by an investigator blinded to the treatment groups in the region between bregma 1 mm and bregma 0 mm. Neurons were selected on the basis of the classic morphology as described previously (Staiger et al., 2004). Criteria for inclusion in the analyses were as follows: (1) the neuron had to be well impregnated; (2) the neuron had to be in full view (namely, neither obscured nor obstructed by overlapping blood vessels, astrocytes, or other dendrites); and (3) the neuron had to have intact dendritic arborizations, visible in the plane of section (Andres et al., 2011). The first three spiny neurons from layer IV of four rats per group that were met the abovementioned criteria were traced following the dendrites and spines through the z-axis on a 100× objective lens (Neurolucida). The length of the dendritic tree was determined using the measuring tool on the Stereo Investigator software (MicroBrightField) and by Sholl analysis and expressed as total length (micrometers) ± SEM. The spine density in the dendritic tree was expressed as the number of spines per micrometer ± SEM.
Statistical analyses.
Statistical analysis of MRI data was performed with MATLAB (version R.2012; MathWorks). When the three time points (baseline, 30 dpi, and 60 dpi) were compared, a one-way ANOVA test was performed at a significance level of p < 0.01. Bonferroni's adjustment was applied to compensate for multiple comparisons. Values reported are expressed as mean values ± SEM.
Statistical analyses of histological data were performed with GraphPad Prism (version 5.00 for Windows; GraphPad Software). When the three groups (CTRL, 30 dpi, and 60 dpi) were compared, histological outcomes were analyzed using the nonparametric Kruskal–Wallis test, followed by a Mann–Whitney–Wilcoxon analysis to test differences between groups. When two groups were compared, a Mann–Whitney–Wilcoxon test was performed directly. To test for differences in dendritic length (Sholl analysis), a two-way ANOVA, followed by Tukey's post hoc test, was performed. Linear correlations between variables were tested using Spearman's test. Values are given as mean ± SEM. p < 0.05 was accepted as significant.
Results
CNS inflammation persists during both relapsing and chronic EAE phases
The EAE score of DA rats during the different phases of disease closely followed the time trend reported previously (Giatti et al., 2013; Fig. 1A). In most rats, the first EAE episode occurred from 9 to 14 dpi, and the peak of EAE was at ∼13–15 dpi. Rats underwent at least one relapse between 20 and 40 dpi, which was followed by incomplete remission and accumulation of mild chronic deficits that persisted up to 60 dpi.
Figure 1.
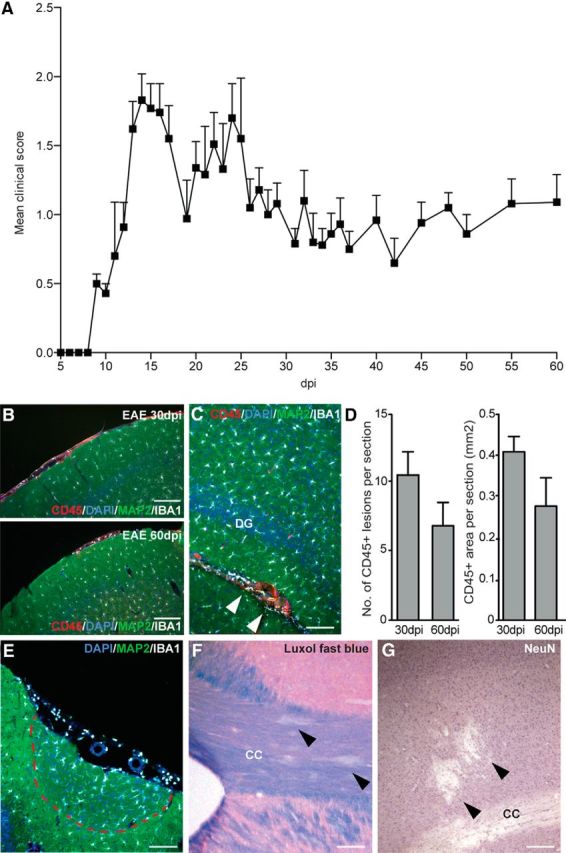
Clinical score recorded along with EAE course and distribution of inflammatory lesions. A, Clinical scores presented as mean ± SEM; at each considered time point, at least 10 male DA rats were evaluated. B, Representative immunofluorescence staining depicting CD45+ infiltrates (red), Iba1+ microglial cells (white), and MAP2+ neurons (green) in the meninges of EAE rats at 30 and 60 dpi. Nuclei are counterstained with DAPI (blue). C, Inflammatory lesions (arrowheads) are also present in the hippocampus. D, Quantification of the number (left) and area (right) of CD45+ inflammatory lesions in EAE. Data are expressed as mean numbers ± SEM from four rats per group. E, Meningeal inflammatory infiltrates are associated with activation of Iba1+ cells (white) and loss of cortical MAP2 expression (green). F, Representative Luxol fast blue staining of the CC. G, Representative immunohistochemistry for NeuN expression in the sensorimotor cortex. Nuclei are counterstained with hematoxylin (purple). Scale bars, 100 μm. DG, Dentate gyrus.
All EAE rats showed diffuse inflammatory infiltrates throughout the brain, consisting of the presence of CD45+ leukocytes and Iba1+ activated (globoid) microglial cells. We found that most of the CD45+ leukocytes were present (1) around veins and venules in the meninges, with dispersion to the parenchyma adjacent to the pia mater (Fig. 1B,E), (2) close to the ventricular system, and (3) in proximity of the CC and (4) the hippocampus (Fig. 1C), as described previously (Storch et al., 1998). Both the number of active inflammatory infiltrates and the total CD45+ area per section did not vary significantly over time (Fig. 1D). Meningeal infiltrates were associated with microglial activation and decreased MAP2+ expression in the underlying cortex (Fig. 1E). Parenchymal focal areas of demyelination (Fig. 1F) and loss of NeuN+ neuronal bodies (Fig. 1G) were also observed. Thus, CNS inflammation persisted during both relapsing and chronic EAE phases but showed a slight tendency toward decreasing severity.
Reduced cortical GM volume during EAE
To investigate the alterations in the GM during the course of EAE, VBM was performed. Statistical maps showed a widespread and robust reduction of GM volume in the cortex at 30 dpi versus baseline (Fig. 2A,F), which further progressed to 60 dpi, extending to the caudate–putamen (CPu) region (Fig. 2B,G). A statistically significant decrease of the whole GM volume with EAE was found at both 30 and 60 dpi versus baseline (baseline, 850.2 ± 4.3 mm3; 30 dpi, 818.3 ± 4.6 mm3; 60 dpi, 816.8 ± 2.5 mm3; p < 0.01; Fig. 2C). The relative GM volume, or GM density, was analyzed in the whole cerebral cortex (Fig. 2D) and in selected cortical regions (Fig. 2E). Interestingly, cortical GM density decreased significantly with time (at both 30 and 60 dpi) in the whole cerebral cortex (baseline, 0.64 ± 0.01; 30 dpi, 0.56 ± 0.01; 60 dpi, 0.56 ± 0.01; p < 0.01) and in the motor, sensory, orbitofrontal, and medial prefrontal regions (motor: baseline, 0.76 ± 0.01; 30 dpi, 0.66 ± 0.02; 60 dpi, 0.64 ± 0.02; sensory: baseline, 0.70 ± 0.01; 30 dpi, 0.65 ± 0.01; 60 dpi, 0.65 ± 0.01; orbitofrontal: baseline, 0.67 ± 0.03; 30 dpi, 0.45 ± 0.03; 60 dpi, 0.48 ± 0.02; medial prefrontal: baseline, 0.81 ± 0.02; 30 dpi, 0.61 ± 0.02; 60 dpi, 0.62 ± 0.01; p < 0.01). In the cingulate, the decrease of GM density was statistically significant only at 60 dpi (baseline, 0.69 ± 0.02; 30 dpi, 0.64 ± 0.01; 60 dpi, 0.61 ± 0.01; p < 0.01 vs 60 dpi only).
Figure 2.

VBM analysis demonstrates cortical atrophy in EAE rats. Color-coded statistical maps of regions exhibiting reduced GM volume in EAE rats versus baseline overlaid to the study specific GM template: A, baseline versus 30 dpi; B, baseline versus 60 dpi. C, GM volume in the whole brain significantly decreases as the disease progresses. D, Mean relative GM volume in the whole cortex. E, Mean relative GM volume in different cortex regions. *p < 0.01. F, G, 3D rendering of the statistical maps of regions exhibiting reduced GM volume in EAE rats at 30 dpi versus baseline (F) and 60 dpi versus baseline (G). Mean relative GM volume in the sensory cortex is correlated with CDI (H). Ent, Entorhinal cortex; M, motor cortex; aI+gI, insular cortex; Cg, cingulate cortex; RSA, retrosplenial cortex; S, sensory cortex; FrA, frontal association; PtA, parietal association; TeA, temporal association; OrF, orbitofrontal cortex; MeF, medial prefrontal cortex.
We also calculated the correlation between cortical GM volume or cortical GM density and the CDI but could not observe any significant finding. We then investigated the correlation between CDI and GM density in those cortical regions showing statistically significant decreases in EAE rats. Interestingly, only the GM density in the sensory cortex was correlated significantly with CDI at 60 dpi (r = −0.76, p < 0.001; Fig. 2H). Therefore, VBM analysis of high-resolution T2w morphological images demonstrated that cortical atrophy occurs in the DA EAE model and that loss of GM density in the sensory cortex is correlated with the disease severity.
EAE rats show a progressive atrophy of the GM and CC
We next investigated whether the observed MRI changes of the cortical ribbon had similar neuropathological correlates. Quantification of the volume of the sensorimotor cortex displayed a significant time effect (H = 6.0; 2 df; p = 0.05), with a statistically significant difference between CTRL (112.1 ± 4.4 mm3) and 60 dpi EAE rats (98.4 ± 2.7 mm3; p ≤ 0.05; Fig. 3A,B). When the striatal volume was analyzed, a concomitant progressive reduction over time was also observed (CTRL, 26.1 ± 2.3 mm3; 30 dpi, 23.3 ± 2.2 mm3; 60 dpi, 21.6 ± 2.1 mm3) that did not reach statistical significance (H = 1.9; 2 df; p = 0.3; Fig. 3A,C). Interestingly, a progressive enlargement of the lateral ventricles (suggesting increased global brain atrophy) was observed in EAE rats over time (Fig. 3D). Quantification of the CC area with Luxol fast blue staining confirmed a significant difference among groups (H = 6.4; 2 df; p ≤ 0.05), with a progressive reduction of CC area between CTRL (0.40 ± 0.01 mm2), EAE at 30 dpi (0.33 ± 0.03 mm2; p = 0.2; NS), and EAE at 60 dpi (0.30 ± 0.02 mm2; p ≤ 0.05; Fig. 3D,E). Thus, the observed MRI changes in the cortical ribbon correlated with progressive atrophy of the sensorimotor cortex and the CC and overall with atrophy of the entire brain, as suggested by the observed ventricular enlargement.
Figure 3.

Atrophy of GM and WM. A, Representative 3D reconstructions of the sensorimotor cortex (gray volumes) and striatum (black volumes) of a CTRL rat, a rat with EAE at 30 dpi, and a rat with EAE at 60 dpi obtained from the serial tissue sections analyzed for stereology. B, C, Quantification of the cortical and striatal volumes. Note the progressive atrophy of the cortical tissue volume, which reaches statistical significance in EAE at 60 dpi. A trend toward reduction of the striatal volume over time is also observed. Data are expressed as mean ± SEM from four rats per group. D, Representative microphotographs of Luxol fast blue-stained brain sections depicting the CC of a CTRL rat, a rat with EAE at 30 dpi, and a rat with EAE at 60 dpi. Note the progressive enlargement of the lateral ventricle suggestive of global brain atrophy associated with EAE over time. Scale bars, 100 μm. E, Quantification of the CC area showing significant atrophy at 60 dpi versus CTRL. *p ≤ 0.05.
In vivo fMRI reveals brain cortex remodeling in the relapsing and chronic phases of EAE
fMRI studies have identified the activation of cortical areas that compensate for neuronal loss and demyelination caused by inflammatory lesions in MS patients (Pantano et al., 2002). Particularly, callosal atrophy has been linked extensively to an interhemispheric dysfunction in relapsing-remitting MS patients (Pelletier et al., 2001).
Therefore, we investigated whether the observed GM atrophy and CC reduction could modify the cortical activation of DA EAE rats by means of fMRI after stimulation of the right forepaw. The group-level analysis of fMRI data before EAE induction demonstrated activation of the contralateral (left) cortex, as described previously (Van Camp et al., 2005), whereas no significant activation was detected outside the cortex or in the cortex ipsilateral to the stimulated limb (Fig. 4A). Quantitatively, the group activation maps showed that most of the activated volume was in the left hemisphere and specifically in the primary somatosensory cortex (S1; 64%), with a relevant percentage in the motor cortex (30%). The activation of the primary motor cortex in response to electrical stimulation of the forepaw in normal rats has been reported previously and could be ascribed to partial volume effects (Weber et al., 2006) or to twitching of the leg in response to the stimulation. Rodents respond to somatosensory stimulation with a complex activation pattern, including a robust response in the S1 cortex and a weaker response in additional brain regions, such as the thalamus, the secondary somatosensory cortex (S2), pons, and cerebellum (Keilholz et al., 2006). This complex activation pattern and its EAE-induced alterations have been characterized by single-subject-level fMRI data analysis as described in the next section.
Figure 4.

Brain cortex remodeling is induced in the relapsing and chronic phases of EAE. Group activation maps showing functional response to electrical stimulation of the right forepaw in baseline rats (A) and EAE rats at 30 dpi (B) or 60 dpi (C). 3D rendering of the activated volume in baseline rats (red) and EAE rats at 30 dpi (blue) and 60 dpi (green) (D). White arrows in C and D indicate activation in the S2. The total activated volume, expressed as the number of pixels, significantly increases at both 30 and 60 dpi versus baseline (E), whereas the LI strongly decreases at 30 and 60 dpi versus baseline, with a slight tendency toward recovery 60 dpi (F). Data are reported as mean ± SEM. Dark gray columns are referred to the cortex, whereas light gray columns are relative to the whole brain. *p < 0.01.
At 30 dpi, the activation pattern was significantly altered compared with baseline, as suggested by the group activation map (Fig. 4B). In fact, the activation was also detected in the ipsilateral cortex and involved cortical regions other than the S1 and motor cortex. Moreover, activated spots were present in extracortical areas (Fig. 4B,D).
At 60 dpi, the group activation map showed that the activated volume in the whole brain and in the cortex further increased (Fig. 4C), with additional activation in the S2 region (Fig. 4C,D, arrow). Contribution from large vessels likely accounts, at least in part, for the strong activation in the region of the sagittal sinus in Figure 4, B and C, although the CBV contrast exploited in fMRI acquisitions is less sensitive to large vessels than standard blood oxygenation level-dependent (BOLD) contrast (Van Camp et al., 2005; Keilholz et al., 2006). The S2 activation here identified in chronic EAE rats is completely novel and will be more deeply analyzed in the next section.
Nevertheless, we found that the total activated cerebral cortex volume, expressed as the number of activated voxels, increased significantly from 523 ± 123 (baseline) to 4548 ± 649 (30 dpi) and up to 8209 ± 1398 (60 dpi; Fig. 4E). Similarly, the activated volume increased when its value was calculated by considering whole-brain voxels. Because group activation maps showed a tendency toward bilateral response to the right forepaw stimulation, the effect was studied in more detail using the LI, a relevant fMRI parameter that indicates the hemispheric dominance during a specific functional response or task execution (Dijkhuizen et al., 2001). Similarly to MS patients, we found that relevant changes in the LI along the course of EAE. In fact, the cerebral cortex LI strongly decreased at 30 dpi (−0.07 ± 0.05) and 60 dpi (0.20 ± 0.12) compared with the baseline value (0.95 ± 0.05; p < 0.01; Fig. 4F). The LI showed a tendency toward recovery at 60 dpi, but its value was not statistically different from that observed at 30 dpi. Similar time-related changes in the LI occurred also when it was calculated in the whole brain. We investigated the correlation between cortical activated volume and CDI, as well as the correlation between the LI and CDI. At 60 dpi, a weak negative correlation was detected between the cortical activated volume and CDI (r = −0.68, p < 0.05), whereas LI was not significantly correlated with CDI.
fMRI data acquired from EAE rats belonging to a satellite ex vivo study group (see Materials and Methods) showed alterations in the functional response before the animals were killed that were similar to those observed in the group of EAE rats used in the longitudinal study. These alterations consisted of increased activated volume with time elapsed after EAE induction and strongly decreased LI versus CTRL. Specifically, the number of cortical activated pixels increased from 452 ± 133 (CTRL) to 4476 ± 1461 (30 dpi) and to 10204 ± 1541 (60 dpi), whereas LI decreased from 0.91 ± 0.09 (CTRL) to −0.09 ± 0.06 (30 dpi) and to 0.05 ± 0.03 (60 dpi). Neither the activated volumes nor the LI values were significantly different from those obtained in the group of animals used for the longitudinal study at corresponding time points.
In animals treated only with the adjuvant (IFA) at 0, 30, and 60 dpi, we observed the typical activation pattern that was observed in EAE animals before induction (baseline). Indeed, group activation maps for IFA-treated rats showed activation in the contralateral S1 and motor cortex and no statistically significant difference in activated volumes or in LI values versus the EAE group at baseline (data not shown). Thus, group-level analysis of fMRI data demonstrated altered functional response to electrical stimulation of the right forepaw, with a strong increase in the cortical activated volume and a strong decrease in the LI.
Activation maps at the single-subject level confirm widespread and bilateral response in the sensory cortex
To better clarify the single area influence on functional brain remodeling, we then analyzed the anatomical distribution of activated areas at the subject level. This step was necessary to detect activations in small regions that could be missed in group-level analysis (as a result of image coregistration) and to estimate intersubject variability. The activation maps obtained in each rat were coregistered with the rat brain template (Schwarz et al., 2006), and the distribution of the activated volume among different brain regions was investigated quantitatively by querying a digital version of the rat brain atlas (Paxinos and Watson, 1998). For clarity, we report the overlay to the atlas of activation maps at the group level: baseline (red), 30 dpi (blue), and 60 dpi (green; Fig. 5A). To obtain a quantitative index for the space distribution of the activated volume, we determined the number of activated voxels included in a given anatomical region divided by the total number of activated voxels, or the Act% ratio. This parameter, calculated for the left and right hemispheres of each animal and averaged over the experimental group, shows that, before EAE induction, the activated volume was restricted mainly to the S1 and the motor cortex of the left hemisphere (Fig. 5B). Activation was also detected in the thalamus, as expected. Nuclei in the thalamus and pons are 300–800 μm, comparable with the pixel size in EPI acquisitions, and, consequently, detection of their activation might have been hampered by small coregistration errors in the group-level analysis of fMRI data. Other small activations (e.g., hippocampus, CC, or mesencephalic regions) detected by the parameter Act% are probably attributable to registration errors or to partial volume effects. Overall, the activation pattern displayed at baseline by the parameter Act% is in agreement with the expected activation of the somatosensory pathway in rats, confirming the reliability of our experimental protocol (Keilholz et al., 2006).
Figure 5.

Changes in activated area along with EAE course. A, Group activation maps overlaid with the Paxinos and Watson rat brain atlas: baseline (red), 30 dpi (blue) and 60 dpi (green). The fraction of activated voxels contained in different brain regions (Act%) before EAE induction (B), on 30 dpi (C), and on 60 dpi (D) is shown. Dark gray columns are referred to the left hemisphere, whereas light gray columns are referred to the right hemisphere. The progressive involvement of the S2 is shown in E in which S2 is depicted in white. In F, the percentage of S2 volume activated at baseline, 30 dpi, and 60 dpi is plotted. Data are reported as mean ± SEM. G, Regions involved in the functional response to noxious electrical stimulation of the forepaw according to Zhao et al. (2012) are reported in white compared with fMRI maps obtained in the present study. M, Motor cortex; Cg, cingulate cortex; RSA, retrosplenial cortex; V, visual cortex; Au, auditory cortex; PtA, parietal association; MeF, medial prefrontal cortex; Hip, hippocampus; Me, mesencephalic region; SC, superior colliculus; Tm, thalamus; PAG, periacqueductal gray.
Data in Figure 5B clearly show a strong lateralization of the activation at baseline. A functional response was still mostly detected in the S1 cortex, motor cortex, and thalamus but with similar values in the left and right hemispheres at both 30 and 60 dpi (Fig. 5C,D). As such, the regions activated at baseline were also activated during EAE but with the remarkable difference that this activation encompassed both hemispheres. Moreover, other regions of the cortex (cingulate, retrosplenial, and medial prefrontal) and the sensory cortex (visual areas) showed activation at 30 and 60 dpi. The recruitment of the S2, marked in white, is clearly detectable in Figure 5E, in which the overlay of activation maps at the group level over the brain template is reported. We have quantitatively analyzed the involvement of the S2 region by calculating the activated volume in S2 normalized over the S2 total volume (S2%). The S2% values at baseline, 30 dpi, and 60 dpi, reported in Figure 5F, demonstrate a progressive and bilateral involvement of S2 in the functional response.
Although the applied electrical stimulation is innocuous in normal control rats, as demonstrated clearly by the observed functional response at baseline, it may activate nociceptive pathways in EAE rats (Ramu et al., 2007). The fMRI features of nociceptive electric stimulation of the forepaw have been investigated extensively (Shih et al., 2011; Zhao et al., 2012, 2014). They are characterized by a typical contralateral response in the S1, a bilateral decrease of CBV in the CPu, accompanied by additional responses in the cortical and subcortical regions. When comparing the activation maps from our model with the regions involved in response to nociceptive stimuli (Fig. 5G, white areas), we can clearly see a distinctive bilateral cortical activation in both S1 and S2 and the absence of CBV changes in the CPu (Fig. 5G). These data suggest that the contribution of pain perception in the functional alterations observed in our experimental paradigm is negligible.
EAE affects neuronal dendrites of the sensorimotor cortex
Cortical atrophy in MS has been associated with a profound reduction in neuronal dendrites and impairment of cortical neuronal connectivity (Wegner et al., 2006). As such, morphological analysis of MAP2+ dendrites in the sensorimotor cortex of EAE rats showed that dendrites lost their smooth shape and appeared as alternating swellings and constrictions (dendritic beading) at both 30 and 60 dpi (Fig. 6A). Accordingly, we observed a significant effect of time (H = 7.4; 2 df; p ≤ 0.05) with a loss of MAP2+ dendrites at 30 dpi (24.981 ± 1.962; p ≤ 0.05) and 60 dpi (24.260 ± 2.764; p ≤ 0.05) versus CTRL (34.988 ± 891; Fig. 6B).
Figure 6.

Dendritic and synaptic reorganization. A, Representative microphotographs of dendrites stained for MAP2 (red) within the sensorimotor cortex of a CTRL rat (left), a rat with EAE at 30 dpi (middle), and a rat with EAE at 60 dpi (right). Nuclei are counterstained with DAPI (blue). Scale bars, 25 μm. B, Quantification of the expression of MAP2 in the sensorimotor cortex. Note the progressive reduction of MAP2 expression in EAE at 30 dpi and retained low in EAE at 60 dpi. C, Sholl analysis of dendritic length with nested concentric spheres centered at the cell soma and with a gradually increasing radius (20 μm) showing cumulative dendritic length in the function of cell soma distance (left graph) and the integrated total dendritic length (right graph) of layer IV cortical spiny neurons. D, EAE induces a significant reduction of the dendritic length at 30 dpi versus CTRL. E, Quantification of spine density in layer IV cortical spiny neurons. Note the significant reduction of spine density in EAE at 30 and 60 dpi versus CTRL. F, Linear correlation analysis of spine density and the number of active CD45+ inflammatory brain lesions showing a statistically significant inverse correlation. G, Descriptive microphotographs and corresponding 3D reconstructions of dendritic spines of layer IV cortical spiny neurons in CTRL, 30 dpi, and 60 dpi rats. Data are expressed as mean numbers ± SEM from four rats per group. *p < 0.05.
We then analyzed layer IV cortical spiny neurons, which are involved in sensory signal processing (Staiger et al., 2004). Sholl analysis on Golgi-stained brain sections confirmed that dendritic length was affected by its distance from the soma (F = 34.8; 11 df; p ≤ 0.0001) and during EAE (F = 4.1; 2 df; p = 0.05; Fig. 6C). Particularly, the total dendritic length was different among groups (H = 6.6; 2 df; p = 0.04), with a significant decrease detectable at 30 dpi (887 ± 93 μm) versus CTRL (1.681 ± 228 μm; p ≤ 0.05; Fig. 6D). This early reduction of dendrites was coupled with a significant decrease of spine density (H = 7.38; 2 df; p ≤ 0.05) at 30 dpi (0.40 ± 0.02/μm; p ≤ 0.05) versus CTRL (0.86 ± 0.10/μm; Fig. 6E). Interestingly, the total dendritic length augmented partially at 60 dpi (1068 μm ± 129), in parallel with an increase of the synaptic density (0.44 ± 0.02/μm; p ≤ 0.05) in layer IV (Fig. 6D,E). Most importantly, we also observed a negative correlation (r2 = −0.66, p ≤ 0.05) between spine density at 30 and 60 dpi and the number of brain inflammatory infiltrates (Fig. 6F,G). Thus, persistent CNS inflammation led to progressive reshuffling of dendritic shape (beading) and reduction of dendritic density and length in the sensorimotor cortex during EAE.
Discussion
A number of adaptive and neuroprotective mechanisms compensate for the neuronal degeneration and neurological decline in MS patients. The activation of cortical areas subsequent to functional loss caused by MS lesions has been described in several fMRI studies, but the mechanisms underlying this phenomenon are not completely understood (Buckle, 2005; Pantano et al., 2006; Loitfelder et al., 2011).
Animal models of human diseases represent useful tools to investigate the dynamics of a given pathological event and to dissect its underlying mechanisms (Marzola and Sbarbati, 2004; Nathoo et al., 2014). EAE induced in DA rats results in a chronic inflammatory neurological disease that recapitulates several aspects of the most common MS course in humans (Stosic-Grujicic et al., 2004; Giatti et al., 2013).
Progressive loss of brain volume is an important feature of MS pathology, especially in the progressive stage of the disease (Filippi et al., 2012). Brain atrophy has various potential pathological substrates, including loss of myelin, oligodendrocytes, contraction of astrocytic volume, and diffuse axonal loss partially attributable to Wallerian degeneration, which are consistent with focal lesions in the WM and cortex (Wegner et al., 2006). In our study, both GM and WM atrophy was detected by in vivo and ex vivo studies. In particular, cortical atrophy was found by VBM analysis as early as 30 dpi, persisted up to 60 dpi, and correlated with disease outcome when evaluated in the sensory cortex. This is in line with previous evidence in MS patients showing that GM atrophy occurs early in the disease (Chard et al., 2002), and it is associated with clinical disability and cognitive deterioration (Sanfilipo et al., 2005; Benedict et al., 2006). Interestingly, we observed that EAE rats show a marked reduction of GM density in the motor and sensory cortices, i.e., the regions involved in functional reorganization in MS patients.
When investigating the functional response to somatosensory stimulation of the forepaw, we found relevant alterations of the functional response in both the relapsing and chronic phases of EAE. Although at baseline the response was restricted mainly to the left S1 cortex, motor cortex, and thalamus, during EAE a substantial increase in the activated volume was detected, with bilateral activation of S1 and S2 cortices, motor cortex, and thalamus, as well as of other cortical (cingulate, retrosplenial, medial prefrontal) and sensorial (e.g., visual areas) regions. This finding is in line with human fMRI studies showing that cortical reorganization occurs in MS patients (Filippi and Rocca, 2009) and that sites for multimodal integration not usually activated by a simple tasks (e.g., visual cortex and thalamus) are recruited to maintain functional capacity in response to tissue damage (Rocca et al., 2005; Cerasa et al., 2006; Ceccarelli et al., 2010). The progressive recruitment of the S2 with disease progression may play a compensatory role counteracting functional loss. Interestingly, we found a negative correlation between the number of activated voxels and the CDI of EAE at 60 dpi, suggesting that adaptive cortical changes might limit the clinical consequences of tissue injury in the course of neuroinflammation.
The LI correlates with greater disability or tissue damage in MS (Reddy et al., 2002). Cortical plasticity in response to somatosensory stimulation has been reported in animal models of stroke, in which the activation pattern is shifted in the contralesional hemisphere with the LI decreasing to strongly negative values (Dijkhuizen et al., 2001). Persistent bilateral activation of sensorimotor structures correlates with poor recovery in stroke and is common in progressive MS (Rocca et al., 2005; Calautti et al., 2007). In our study, we found a strong decrease in the LI at 30 dpi, which showed a tendency toward recovery in the chronic phase.
We also considered the possibility that the electrical stimulation could activate nociceptive pathways in our EAE rats (Ramu et al., 2007). Compared with previously published studies (Shih et al., 2011; Zhao et al., 2012, 2014), the bilateral activation of S1 and S2 and the absence of response in the CPu suggest a limited contribution, if any, of noxious stimuli perception in the observed fMRI pattern.
We then investigated the morphological and pathological correlates of the observed functional alteration. Initially, we focused on MAP2 expression, a well known marker of neuronal somata and dendrites (Johnson and Jope, 1992), in the sensorimotor cortex. We found a strong decrease in MAP2+ immunoreactivity in the sensory motor cortex at both 30 and 60 dpi, which is in line with previous data on the WM of the lumbosacral spinal cord in DA EAE rats (Zhu et al., 2003). Because most synapses are present on neuronal dendrites, we further examined whether the dendritic tree and synaptic structures were damaged specifically in layer IV sensory neurons, which are in receipt of ascending thalamocortical connections. We found that the total dendritic length and spine density were significantly reduced at 30 dpi, whereas a slight increase in both measures could be detected at 60 dpi, as described previously in the EAE spinal cord (Zhu et al., 2003). This increase might indicate a functional reorganization of synapses that could underlie the tendency toward recovery of the LI at 60 dpi.
Both dendritic beading and reduction in synaptic protein immunoreactivity have been correlated with inflammatory cell infiltration in the spinal cords of EAE rats (Zhu et al., 2003). Although inflammatory lesions in this model are located mostly in the spinal cord, we sought to focus on the brain inflammatory load to better address the correlation between brain atrophy and functional deficits reported in MS patients. We found that, during the most active relapsing (30 dpi) and chronic disease (60 dpi) phases, leukocyte infiltrates persist within the meninges and brain parenchyma, although their number decreases over time. We also found that the reduction of spine density in layer IV sensory neurons was strictly dependent on the inflammatory burden, suggesting that modifications of spine and dendritic densities could be the consequence of the accumulation of active meningeal and parenchymal inflammatory lesions.
Spinal cord lesions can affect cortical plasticity, leading to alterations in the functional response of the normal brain cortex. As such, the degree of cortical reorganization is predicted by spinal atrophy and is associated with significant disability (Ghosh et al., 2010; Freund et al., 2011). As stated previously, in DA EAE rats, the greatest effect of disease is seen in the spinal cord; therefore, we cannot exclude that the observed widespread cortical activation can be ascribed also to spinal cord or brainstem damage (Dimitrijević et al., 2007; Foster et al., 2009).
fMRI techniques rely on the measurements of neuronal activity by detecting associated changes in blood hemodynamics. In the clinics, fMRI experiments are performed by exploiting the BOLD contrast, which depends on a combination of changes in cerebral blood flow, CBV, and oxygen consumption resulting from the capillary bed and large vessels (Van Camp et al., 2005). Here we preferred a CBV-weighted fMRI technique over BOLD because the former provides higher contrast/noise at relatively low field intensity and decreased sensitivity to venous artifacts (Van Camp et al., 2005). Several papers have demonstrated that CBV-weighted and BOLD techniques detect activations in the same brain regions during electrical stimulation of the forepaws (Van Camp et al., 2005; Keilholz et al., 2006), thus conferring to our results full translational validity.
In conclusion, our results provide additional support to the validity of the DA EAE rat model for fMRI studies and define an innovative experimental platform that may be pivotal for the comprehension of key mechanisms of the accumulation of irreversible disability and for the development/testing of innovative therapies in EAE/MS research.
Footnotes
This work was supported by National Multiple Sclerosis Society Grant RG-4001-A1 (S.P.), Italian Multiple Sclerosis Foundation Grants RG 2010/R/31 (S.P.) and RG 2011/R/25 (P.Marz.), Italian Ministry of Health Grant GR08/7 (S.P.), European Research Council 2010-StG Grant RG 260511-SEM_SEM (S.P.), European Community 7th Framework Program Grants FP7/2007-2013 and RG 280772-iONE (S.P.), Evelyn Trust Grant RG 69865 (S.P.), Bascule Charitable Trust Grant RG 75149 (S.P.), and Wellcome Trust Research Training Fellowship RRZA/057 (L.P.-J.). We thank Stefano Amadio, Ubaldo Del Carro, and Giulia Longoni for critically discussing this manuscript. We acknowledge Elena Nicolato for technical support in fMRI acquisition and Virginia Rodriguez-Menendez for histological preparation and analysis.
The authors declare no competing financial interests.
References
- Andres RH, Horie N, Slikker W, Keren-Gill H, Zhan K, Sun G, Manley NC, Pereira MP, Sheikh LA, McMillan EL, Schaar BT, Svendsen CN, Bliss TM, Steinberg GK. Human neural stem cells enhance structural plasticity and axonal transport in the ischaemic brain. Brain. 2011;134:1777–1789. doi: 10.1093/brain/awr094. [DOI] [PMC free article] [PubMed] [Google Scholar]
- Ashburner J, Friston KJ. Voxel-based morphometry—the methods. Neuroimage. 2000;11:805–821. doi: 10.1006/nimg.2000.0582. [DOI] [PubMed] [Google Scholar]
- Bacigaluppi M, Pluchino S, Peruzzotti-Jametti L, Kilic E, Kilic U, Salani G, Brambilla E, West MJ, Comi G, Martino G, Hermann DM. Delayed post-ischaemic neuroprotection following systemic neural stem cell transplantation involves multiple mechanisms. Brain. 2009;132:2239–2251. doi: 10.1093/brain/awp174. [DOI] [PubMed] [Google Scholar]
- Badovinac V, Mostarica-Stojković M, Dinarello CA, Stosić-Grujicić S. Interleukin-1 receptor antagonist suppresses experimental autoimmune encephalomyelitis (EAE) in rats by influencing the activation and proliferation of encephalitogenic cells. J Neuroimmunol. 1998;85:87–95. doi: 10.1016/S0165-5728(98)00020-4. [DOI] [PubMed] [Google Scholar]
- Benedict RH, Bruce JM, Dwyer MG, Abdelrahman N, Hussein S, Weinstock-Guttman B, Garg N, Munschauer F, Zivadinov R. Neocortical atrophy, third ventricular width, and cognitive dysfunction in multiple sclerosis. Arch Neurol. 2006;63:1301–1306. doi: 10.1001/archneur.63.9.1301. [DOI] [PubMed] [Google Scholar]
- Buckle GJ. Functional magnetic resonance imaging and multiple sclerosis: the evidence for neuronal plasticity. J Neuroimaging. 2005;15:82S–93S. doi: 10.1177/1051228405284093. [DOI] [PubMed] [Google Scholar]
- Calautti C, Naccarato M, Jones PS, Sharma N, Day DD, Carpenter AT, Bullmore ET, Warburton EA, Baron JC. The relationship between motor deficit and hemisphere activation balance after stroke: a 3T fMRI study. Neuroimage. 2007;34:322–331. doi: 10.1016/j.neuroimage.2006.08.026. [DOI] [PubMed] [Google Scholar]
- Ceccarelli A, Rocca MA, Valsasina P, Rodegher M, Falini A, Comi G, Filippi M. Structural and functional magnetic resonance imaging correlates of motor network dysfunction in primary progressive multiple sclerosis. Eur J Neurosci. 2010;31:1273–1280. doi: 10.1111/j.1460-9568.2010.07147.x. [DOI] [PubMed] [Google Scholar]
- Cerasa A, Fera F, Gioia MC, Liguori M, Passamonti L, Nicoletti G, Vercillo L, Paolillo A, Clodomiro A, Valentino P, Quattrone A. Adaptive cortical changes and the functional correlates of visuo-motor integration in relapsing-remitting multiple sclerosis. Brain Res Bull. 2006;69:597–605. doi: 10.1016/j.brainresbull.2005.11.006. [DOI] [PubMed] [Google Scholar]
- Chard DT, Griffin CM, Parker GJ, Kapoor R, Thompson AJ, Miller DH. Brain atrophy in clinically early relapsing-remitting multiple sclerosis. Brain. 2002;125:327–337. doi: 10.1093/brain/awf025. [DOI] [PubMed] [Google Scholar]
- Comi G, Rocca MA, Filippi M. Brain plasticity in multiple sclerosis. Eur Neurol. 2004;51:189–190. doi: 10.1159/000078483. [DOI] [PubMed] [Google Scholar]
- Dijkhuizen RM, Ren J, Mandeville JB, Wu O, Ozdag FM, Moskowitz MA, Rosen BR, Finklestein SP. Functional magnetic resonance imaging of reorganization in rat brain after stroke. Proc Natl Acad Sci U S A. 2001;98:12766–12771. doi: 10.1073/pnas.231235598. [DOI] [PMC free article] [PubMed] [Google Scholar]
- Dimitrijević M, Rauski A, Radojević K, Kosec D, Stanojević S, Pilipović I, Leposavić G. Beta-adrenoceptor blockade ameliorates the clinical course of experimental allergic encephalomyelitis and diminishes its aggravation in adrenalectomized rats. Eur J Pharmacol. 2007;577:170–182. doi: 10.1016/j.ejphar.2007.08.021. [DOI] [PubMed] [Google Scholar]
- Douaud G, Smith S, Jenkinson M, Behrens T, Johansen-Berg H, Vickers J, James S, Voets N, Watkins K, Matthews PM, James A. Anatomically related grey and white matter abnormalities in adolescent-onset schizophrenia. Brain. 2007;130:2375–2386. doi: 10.1093/brain/awm184. [DOI] [PubMed] [Google Scholar]
- Filippi M, Rocca MA. Cortical reorganisation in patients with MS. J Neurol Neurosurg Psychiatry. 2004;75:1087–1089. doi: 10.1136/jnnp.2004.036020. [DOI] [PMC free article] [PubMed] [Google Scholar]
- Filippi M, Rocca MA. Functional MR imaging in multiple sclerosis. Neuroimaging Clin N Am. 2009;19:59–70. doi: 10.1016/j.nic.2008.08.004. [DOI] [PubMed] [Google Scholar]
- Filippi M, Rocca MA. Multiple sclerosis: linking disability and spinal cord imaging outcomes in MS. Nat Rev Neurol. 2013;9:189–190. doi: 10.1038/nrneurol.2013.40. [DOI] [PubMed] [Google Scholar]
- Filippi M, Rocca MA, Barkhof F, Brück W, Chen JT, Comi G, DeLuca G, De Stefano N, Erickson BJ, Evangelou N, Fazekas F, Geurts JJ, Lucchinetti C, Miller DH, Pelletier D, Popescu BF, Lassmann H Attendees of the Correlation between Pathological MRIfiMSw. Association between pathological and MRI findings in multiple sclerosis. Lancet Neurol. 2012;11:349–360. doi: 10.1016/S1474-4422(12)70003-0. [DOI] [PubMed] [Google Scholar]
- Foster CA, Mechtcheriakova D, Storch MK, Balatoni B, Howard LM, Bornancin F, Wlachos A, Sobanov J, Kinnunen A, Baumruker T. FTY720 rescue therapy in the dark agouti rat model of experimental autoimmune encephalomyelitis: expression of central nervous system genes and reversal of blood-brain-barrier damage. Brain Pathol. 2009;19:254–266. doi: 10.1111/j.1750-3639.2008.00182.x. [DOI] [PMC free article] [PubMed] [Google Scholar]
- Freund P, Weiskopf N, Ward NS, Hutton C, Gall A, Ciccarelli O, Craggs M, Friston K, Thompson AJ. Disability, atrophy and cortical reorganization following spinal cord injury. Brain. 2011;134:1610–1622. doi: 10.1093/brain/awr093. [DOI] [PMC free article] [PubMed] [Google Scholar]
- Ghosh A, Haiss F, Sydekum E, Schneider R, Gullo M, Wyss MT, Mueggler T, Baltes C, Rudin M, Weber B, Schwab ME. Rewiring of hindlimb corticospinal neurons after spinal cord injury. Nat Neurosci. 2010;13:97–104. doi: 10.1038/nn.2448. [DOI] [PubMed] [Google Scholar]
- Giatti S, Boraso M, Abbiati F, Ballarini E, Calabrese D, Santos-Galindo M, Rigolio R, Pesaresi M, Caruso D, Viviani B, Cavaletti G, Garcia-Segura LM, Melcangi RC. Multimodal analysis in acute and chronic experimental autoimmune encephalomyelitis. J Neuroimmune Pharmacol. 2013;8:238–250. doi: 10.1007/s11481-012-9385-9. [DOI] [PubMed] [Google Scholar]
- Gozzi A, Agosta F, Massi M, Ciccocioppo R, Bifone A. Reduced limbic metabolism and fronto-cortical volume in rats vulnerable to alcohol addiction. Neuroimage. 2013;69:112–119. doi: 10.1016/j.neuroimage.2012.12.015. [DOI] [PMC free article] [PubMed] [Google Scholar]
- Jenkinson M, Bannister P, Brady M, Smith S. Improved optimization for the robust and accurate linear registration and motion correction of brain images. Neuroimage. 2002;17:825–841. doi: 10.1006/nimg.2002.1132. [DOI] [PubMed] [Google Scholar]
- Johnson GV, Jope RS. The role of microtubule-associated protein 2 (MAP-2) in neuronal growth, plasticity, and degeneration. J Neurosci Res. 1992;33:505–512. doi: 10.1002/jnr.490330402. [DOI] [PubMed] [Google Scholar]
- Keilholz SD, Silva AC, Raman M, Merkle H, Koretsky AP. BOLD and CBV-weighted functional magnetic resonance imaging of the rat somatosensory system. Magn Reson Med. 2006;55:316–324. doi: 10.1002/mrm.20744. [DOI] [PubMed] [Google Scholar]
- Li Q, Cheung C, Wei R, Hui ES, Feldon J, Meyer U, Chung S, Chua SE, Sham PC, Wu EX, McAlonan GM. Prenatal immune challenge is an environmental risk factor for brain and behavior change relevant to schizophrenia: evidence from MRI in a mouse model. PLoS One. 2009;4:e6354. doi: 10.1371/journal.pone.0006354. [DOI] [PMC free article] [PubMed] [Google Scholar]
- Loitfelder M, Fazekas F, Petrovic K, Fuchs S, Ropele S, Wallner-Blazek M, Jehna M, Aspeck E, Khalil M, Schmidt R, Neuper C, Enzinger C. Reorganization in cognitive networks with progression of multiple sclerosis: insights from fMRI. Neurology. 2011;76:526–533. doi: 10.1212/WNL.0b013e31820b75cf. [DOI] [PubMed] [Google Scholar]
- MacKenzie-Graham A, Rinek GA, Avedisian A, Gold SM, Frew AJ, Aguilar C, Lin DR, Umeda E, Voskuhl RR, Alger JR. Cortical atrophy in experimental autoimmune encephalomyelitis: in vivo imaging. Neuroimage. 2012;60:95–104. doi: 10.1016/j.neuroimage.2011.11.099. [DOI] [PMC free article] [PubMed] [Google Scholar]
- Marzola P, Sbarbati A. Magnetic resonance imaging in animal models of pathologies. Methods Enzymol. 2004;386:177–200. doi: 10.1016/S0076-6879(04)86007-5. [DOI] [PubMed] [Google Scholar]
- Nathoo N, Yong VW, Dunn JF. Using magnetic resonance imaging in animal models to guide drug development in multiple sclerosis. Mult Scler. 2014;20:3–11. doi: 10.1177/1352458513512709. [DOI] [PubMed] [Google Scholar]
- Nichols TE, Holmes AP. Nonparametric permutation tests for functional neuroimaging: a primer with examples. Hum Brain Mapp. 2002;15:1–25. doi: 10.1002/hbm.1058. [DOI] [PMC free article] [PubMed] [Google Scholar]
- Pantano P, Iannetti GD, Caramia F, Mainero C, Di Legge S, Bozzao L, Pozzilli C, Lenzi GL. Cortical motor reorganization after a single clinical attack of multiple sclerosis. Brain. 2002;125:1607–1615. doi: 10.1093/brain/awf164. [DOI] [PubMed] [Google Scholar]
- Pantano P, Mainero C, Caramia F. Functional brain reorganization in multiple sclerosis: evidence from fMRI studies. J Neuroimaging. 2006;16:104–114. doi: 10.1111/j.1552-6569.2006.00029.x. [DOI] [PubMed] [Google Scholar]
- Paxinos G, Watson C. The rat brain in stereotaxic coordinates. San Diego: Academic; 1998. [DOI] [PubMed] [Google Scholar]
- Pelletier J, Suchet L, Witjas T, Habib M, Guttmann CR, Salamon G, Lyon-Caen O, Chérif AA. A longitudinal study of callosal atrophy and interhemispheric dysfunction in relapsing-remitting multiple sclerosis. Arch Neurol. 2001;58:105–111. doi: 10.1001/archneur.58.1.105. [DOI] [PubMed] [Google Scholar]
- Ramu J, Bockhorst KH, Grill RJ, Mogatadakala KV, Narayana PA. Cortical reorganization in NT3-treated experimental spinal cord injury: Functional magnetic resonance imaging. Exp Neurol. 2007;204:58–65. doi: 10.1016/j.expneurol.2006.09.015. [DOI] [PubMed] [Google Scholar]
- Reddy H, Narayanan S, Arnoutelis R, Jenkinson M, Antel J, Matthews PM, Arnold DL. Evidence for adaptive functional changes in the cerebral cortex with axonal injury from multiple sclerosis. Brain. 2000;123:2314–2320. doi: 10.1093/brain/123.11.2314. [DOI] [PubMed] [Google Scholar]
- Reddy H, Narayanan S, Woolrich M, Mitsumori T, Lapierre Y, Arnold DL, Matthews PM. Functional brain reorganization for hand movement in patients with multiple sclerosis: defining distinct effects of injury and disability. Brain. 2002;125:2646–2657. doi: 10.1093/brain/awf283. [DOI] [PubMed] [Google Scholar]
- Rocca MA, Colombo B, Falini A, Ghezzi A, Martinelli V, Scotti G, Comi G, Filippi M. Cortical adaptation in patients with MS: a cross-sectional functional MRI study of disease phenotypes. Lancet Neurol. 2005;4:618–626. doi: 10.1016/S1474-4422(05)70171-X. [DOI] [PubMed] [Google Scholar]
- Sanfilipo MP, Benedict RH, Sharma J, Weinstock-Guttman B, Bakshi R. The relationship between whole brain volume and disability in multiple sclerosis: a comparison of normalized gray vs. white matter with misclassification correction. Neuroimage. 2005;26:1068–1077. doi: 10.1016/j.neuroimage.2005.03.008. [DOI] [PubMed] [Google Scholar]
- Schnabel JA, Tanner C, Castellano-Smith AD, Degenhard A, Leach MO, Hose DR, Hill DL, Hawkes DJ. Validation of nonrigid image registration using finite-element methods: application to breast MR images. IEEE Trans Med Imaging. 2003;22:238–247. doi: 10.1109/TMI.2002.808367. [DOI] [PubMed] [Google Scholar]
- Schoonheim MM, Filippi M. Functional plasticity in MS: friend or foe? Neurology. 2012;79:1418–1419. doi: 10.1212/WNL.0b013e31826d602e. [DOI] [PubMed] [Google Scholar]
- Schwarz AJ, Danckaert A, Reese T, Gozzi A, Paxinos G, Watson C, Merlo-Pich EV, Bifone A. A stereotaxic MRI template set for the rat brain with tissue class distribution maps and co-registered anatomical atlas: application to pharmacological MRI. Neuroimage. 2006;32:538–550. doi: 10.1016/j.neuroimage.2006.04.214. [DOI] [PubMed] [Google Scholar]
- Shih YY, Wey HY, De La Garza BH, Duong TQ. Striatal and cortical BOLD, blood flow, blood volume, oxygen consumption, and glucose consumption changes in noxious forepaw electrical stimulation. J Cereb Blood Flow Metab. 2011;31:832–841. doi: 10.1038/jcbfm.2010.173. [DOI] [PMC free article] [PubMed] [Google Scholar]
- Smith SM, Jenkinson M, Woolrich MW, Beckmann CF, Behrens TE, Johansen-Berg H, Bannister PR, De Luca M, Drobnjak I, Flitney DE, Niazy RK, Saunders J, Vickers J, Zhang Y, De Stefano N, Brady JM, Matthews PM. Advances in functional and structural MR image analysis and implementation as FSL. Neuroimage. 2004;23(Suppl 1):S208–S219. doi: 10.1016/j.neuroimage.2004.07.051. [DOI] [PubMed] [Google Scholar]
- Staiger JF, Flagmeyer I, Schubert D, Zilles K, Kötter R, Luhmann HJ. Functional diversity of layer IV spiny neurons in rat somatosensory cortex: quantitative morphology of electrophysiologically characterized and biocytin labeled cells. Cereb Cortex. 2004;14:690–701. doi: 10.1093/cercor/bhh029. [DOI] [PubMed] [Google Scholar]
- Storch MK, Stefferl A, Brehm U, Weissert R, Wallström E, Kerschensteiner M, Olsson T, Linington C, Lassmann H. Autoimmunity to myelin oligodendrocyte glycoprotein in rats mimics the spectrum of multiple sclerosis pathology. Brain Pathol. 1998;8:681–694. doi: 10.1111/j.1750-3639.1998.tb00194.x. [DOI] [PMC free article] [PubMed] [Google Scholar]
- Stosic-Grujicic S, Ramic Z, Bumbasirevic V, Harhaji L, Mostarica-Stojkovic M. Induction of experimental autoimmune encephalomyelitis in Dark Agouti rats without adjuvant. Clin Exp Immunol. 2004;136:49–55. doi: 10.1111/j.1365-2249.2004.02418.x. [DOI] [PMC free article] [PubMed] [Google Scholar]
- Tambalo S, Daducci A, Fiorini S, Boschi F, Mariani M, Marinone M, Sbarbati A, Marzola P. Experimental protocol for activation-induced manganese-enhanced MRI (AIM-MRI) based on quantitative determination of Mn content in rat brain by fast T1 mapping. Magn Reson Med. 2009;62:1080–1084. doi: 10.1002/mrm.22095. [DOI] [PubMed] [Google Scholar]
- Tona F, Petsas N, Sbardella E, Prosperini L, Carmellini M, Pozzilli C, Pantano P. Multiple sclerosis: altered thalamic resting-state functional connectivity and its effect on cognitive function. Radiology. 2014;271:814–821. doi: 10.1148/radiol.14131688. [DOI] [PubMed] [Google Scholar]
- Van Camp N, Peeters RR, Van der Linden A. A comparison between blood oxygenation level-dependent and cerebral blood volume contrast in the rat cerebral and cerebellar somatosensoric cortex during electrical paw stimulation. J Magn Reson Imaging. 2005;22:483–491. doi: 10.1002/jmri.20417. [DOI] [PubMed] [Google Scholar]
- Van Camp N, Verhoye M, Van der Linden A. Stimulation of the rat somatosensory cortex at different frequencies and pulse widths. NMR Biomed. 2006a;19:10–17. doi: 10.1002/nbm.986. [DOI] [PubMed] [Google Scholar]
- Van Camp N, Verhoye M, De Zeeuw CI, Van der Linden A. Light stimulus frequency dependence of activity in the rat visual system as studied with high-resolution BOLD fMRI. J Neurophysiol. 2006b;95:3164–3170. doi: 10.1152/jn.00400.2005. [DOI] [PubMed] [Google Scholar]
- Weber R, Ramos-Cabrer P, Wiedermann D, van Camp N, Hoehn M. A fully noninvasive and robust experimental protocol for longitudinal fMRI studies in the rat. Neuroimage. 2006;29:1303–1310. doi: 10.1016/j.neuroimage.2005.08.028. [DOI] [PubMed] [Google Scholar]
- Wegner C, Esiri MM, Chance SA, Palace J, Matthews PM. Neocortical neuronal, synaptic, and glial loss in multiple sclerosis. Neurology. 2006;67:960–967. doi: 10.1212/01.wnl.0000237551.26858.39. [DOI] [PubMed] [Google Scholar]
- Zhao F, Welsh D, Williams M, Coimbra A, Urban MO, Hargreaves R, Evelhoch J, Williams DS. fMRI of pain processing in the brain: a within-animal comparative study of BOLD vs. CBV and noxious electrical vs. noxious mechanical stimulation in rat. Neuroimage. 2012;59:1168–1179. doi: 10.1016/j.neuroimage.2011.08.002. [DOI] [PubMed] [Google Scholar]
- Zhao F, Williams M, Bowlby M, Houghton A, Hargreaves R, Evelhoch J, Williams DS. Qualification of fMRI as a biomarker for pain in anesthetized rats by comparison with behavioral response in conscious rats. Neuroimage. 2014;84:724–732. doi: 10.1016/j.neuroimage.2013.09.036. [DOI] [PubMed] [Google Scholar]
- Zhu B, Luo L, Moore GR, Paty DW, Cynader MS. Dendritic and synaptic pathology in experimental autoimmune encephalomyelitis. Am J Pathol. 2003;162:1639–1650. doi: 10.1016/S0002-9440(10)64298-8. [DOI] [PMC free article] [PubMed] [Google Scholar]