

Abstract
High-resolution functional MRI (fMRI) offers unique possibilities for studying human functional neuroanatomy. Although high-resolution fMRI has proven its potential at 7 T, most fMRI studies are still performed at rather low spatial resolution at 3 T. We optimized and compared single-shot two-dimensional echo-planar imaging (EPI) and multishot three-dimensional EPI high-resolution fMRI protocols. We extended image-based physiological noise correction from two-dimensional EPI to multishot three-dimensional EPI. The functional sensitivity of both acquisition schemes was assessed in a visual fMRI experiment. The physiological noise correction increased the sensitivity significantly, can be easily applied, and requires simple recordings of pulse and respiration only. The combination of three-dimensional EPI with physiological noise correction provides exceptional sensitivity for 1.5 mm high-resolution fMRI at 3 T, increasing the temporal signal-to-noise ratio by more than 25% compared to two-dimensional EPI. Magn Reson Med, 2013. © 2012 Wiley Periodicals, Inc.
Keywords: high-resolution, functional MRI, echo-planar imaging, three-dimensional, two-dimensional, physiological noise
INTRODUCTION
High-resolution functional MRI (fMRI) has proven its importance to reveal the functional microstructure of the human brain in cortical and subcortical areas (1–3). Ultrahigh fields (≥7 T) facilitate high-resolution fMRI due to the increased sensitivity to the blood oxygen level-dependent (BOLD) effect and signal-to-noise ratio (SNR) (4–6). However, most neuroimaging studies are still carried out at 3 T due to the limited availability of 7T scanners and practical and technological constraints of 7 T.
Few comparisons of the methods optimal for high-resolution fMRI have yet been conducted at 3 T. Most studies have been performed at 7 T, including the comparison of two-dimensional (2D) echo-planar imaging (EPI) with three-dimensional (3D) EPI (5, 7), 2D EPI with 3D PRESTO EPI (8), 2D EPI with multiplexed 2D EPI (9), 2D EPI with 3D PRESTO EPI and FLASH (10), or variants of 2D EPI implementations (6, 11, 12). One overall conclusion is that 3D EPI outperforms 2D EPI if image noise is dominated by thermal rather than physiological noise.
Physiological noise is a significant limitation of multishot 3D EPI (5, 7), which can be substantially reduced using postprocessing noise correction (6). However, the most complete approach based on an extensive model including regressors for cardiorespiratory and motion effects into the general linear model (GLM) used for statistical analyses has not been extended to 3D EPI yet. A recent study (8) applied only the RETROICOR subset of nuisance covariates to 3D data (13) but did not include regressors modeling motion (14) or respiratory volume effects (15).
Extrapolation from 7T results suggests that 3D EPI should be particularly efficient for high-resolution fMRI at 3 T due to the lower thermal SNR. In the only study comparing high-resolution 3D with 2D EPI at 3 T, the temporal SNR of multishot 3D spiral was increased by about 20% compared to a dual-shot 2D spiral at about 1 mm resolution, however, resulting in a minimal increase of statistical z-scores of about 3% in a visual fMRI experiment (16). Extrapolation of the results to standard fMRI using 2D EPI is complicated by the use of uncommon dual-shot and spiral k-space acquisition combined with a small local radiofrequency (RF) receive coil. Other studies comparing 2D with 3D EPI (17) or 3D PRESTO EPI (18) at 3 T used lower resolution (>3 mm) and cannot be easily extrapolated to high resolution either.
Here, we optimize and compare single-shot 2D EPI and multishot 3D EPI for 1.5 mm isotropic resolution fMRI at 3 T. We adapt to 3D EPI an image-based physiological noise correction previously established for 2D EPI at 7 T (6). Temporal SNR and functional sensitivity in a visual fMRI experiment are compared between 2D and 3D EPI acquisitions. The gain in temporal stability and BOLD sensitivity due to correction of physiological noise are assessed in different brain areas.
METHODS
Data were acquired from six male healthy volunteers (age 38 ± 10) using a 3T whole-body Magnetom TIM Trio system (Siemens Healthcare, Erlangen, Germany), operated with an RF body transmit coil and a 32-channel head receive coil. The study was approved by the local ethics committee and the volunteers gave their written informed consent before the scans.
The fMRI time series were acquired using 2D and 3D EPI sequences with 1.5 mm isotropic image resolution (in-plane matrix size = 128 × 128, field of view = 192 mm × 192 mm). For the 2D EPI acquisitions, RF excitation pulses with nominal flip angle of 90°, duration of 3.2 ms, and bandwidth-time product of 5 were used. For the 3D EPI acquisitions, RF excitation pulses with nominal flip angle 20°, duration of 1.12 ms, and bandwidth-time product of 12 were used. The use of longer RF excitation (due to the larger nominal flip angle value) and gradient prepulses for 2D EPI resulted in an echo time = 36.2 ms and a repetition time (TR) = 84.2 ms compared to echo time = 32.86 ms and TR = 80 ms for 3D EPI. The number of slices was set to 38 and 40 for 2D and 3D EPI, respectively, to achieve a volume TR = 3.2 s for both acquisition types. For the 3D EPI acquisitions, four slices were discarded on either side of the encoding slab to avoid wrap-around artifacts due to imperfect slab excitation. For 2D EPI, an interleaved slice acquisition order (slice thickness = 1.5 mm with no interslice gap) was chosen. For 3D EPI, a linear increment of the partition encoding (slow phase encoding direction) was used and a single partition was acquired per TR.
Parallel imaging was used along the phase encoding direction (acceleration factor 2) for both types of acquisition and images were reconstructed using the vendor's generalized autocalibrating partially parallel acquisitions (GRAPPA) implementation (19). The GRAPPA reconstruction kernel was estimated from a fully sampled volume acquired at the beginning of each fMRI time series using a multishot segmented k-space scheme. An fMRI time series of 400 volumes was acquired for each acquisition scheme, leading to a total acquisition time of about 42 min. For overlay with the individual anatomy and definition of anatomical regions of interest (ROIs), a T1-weighted 3D modified driven equilibrium Fourier transform (MDEFT) with 1 mm isotropic resolution was acquired (20).
The visual paradigm used for detection of BOLD activation is well established and only described briefly here (for details, see (6)). Stimulation consisted of flickering black/white checkerboards covering the left and right visual hemifields in succession, with interspersed rest periods (duration 20 s each). The left-rest-right-rest blocks were repeated 16 times. The acquisition order of 2D and 3D EPI was balanced across the subjects to avoid bias.
Physiological Noise Recording and Modeling
Physiological noise correction was implemented by inserting physiological regressors into the GLM for fMRI analysis. During fMRI acquisition, the cardiac pulse signal and respiration were measured using an MRI compatible pulse oximeter and pneumatic belt (6). The RETROICOR method (13) was used to model the cardiac and respiratory contributions to the fMRI noise in the GLM used for statistical analysis. For each regressor, the physiological signal was sampled at the time of acquisition of the reference EPI slice for each volume. The resulting set of physiological data points was modeled as sine and cosine basis functions of a Fourier series up to the third harmonic (6). Cardiac and respiratory signals therefore led to a set of 12 regressors. A set of six regressors (three translations and three rotations) was also obtained from the realignment of each EPI time series and inserted in the fMRI analysis (14). Changes in respiration and heart rate were also calculated as described in Ref. 15, 21, and 22 yielding another set of two regressors. Altogether the full physiological noise model described in Ref. 6 yielded a set of 20 regressors that were included in the GLM for fMRI data analysis. For 2D EPI acquisitions, the reference slice was selected to lie within the calcarine fissure as the visual cortex (VC) was a primary ROI in this study. As VC and the lateral geniculate nuclei (LGN, another region with expected significant activation in this study) are approximately located in the same axial slice, the choice of the reference slice was also optimal for the LGN.
Extension to 3D EPI
We developed an image-based physiological noise correction method for multishot 3D EPI, which takes into account that data are not acquired slice-wise in real space but partition-wise in k-space. As a simple relation between real space and acquisition time does not exist for 3D EPI, physiological correction might be best applied to the k-space data for optimal timing. However, this requires handling large complex k-space datasets. Furthermore, physiological correction of 3D gradient-echo k-space data is only equally or even less effective than correction of data in real space, as noisy outer k-space partitions allow for only poor estimates of weights of the nuisance regressors (23). As a result, physiological correction methods based on k-space data might not efficiently correct spatially localized physiological effects (e.g., cardiac) (13). Correction methods based on the magnitude of EPI images decrease the amount of data to process by a factor 2 compared to methods based on complex-valued data, can be easily implemented in fMRI analysis, and do not require off-line image reconstruction (unlike k-space methods). A physiological correction method based on the magnitude of the images was therefore also preferred for the 3D EPI data.
As for 2D EPI, the physiological data of 3D EPI time series was sampled at one time point during the acquisition of each volume. Although the choice of a reference slice for 2D EPI time series is straightforward and only affects the robustness of the physiological correction to a small degree, the choice of a reference partition for 3D EPI acquisitions is not clear and needs investigating. We therefore systematically varied the time point at which the physiological data were sampled in each volume from the time of acquisition of the minimal partition to the time of acquisition of the maximal partition. The optimal reference partition, identified as yielding the highest tSNR value (see Fig. 1), was used for all further investigations.
FIG. 1.
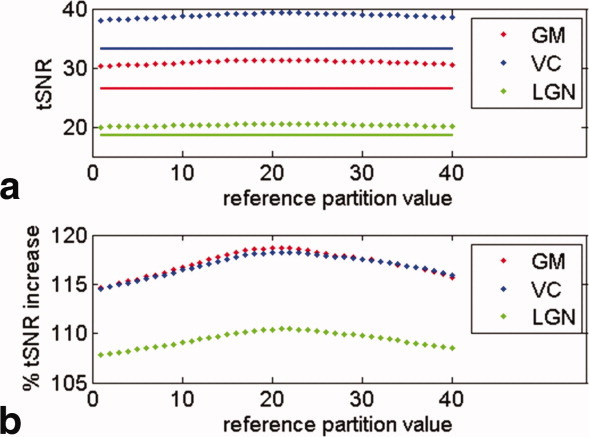
Effect of the reference partition number on tSNR. Solid lines show uncorrected and dotted lines physiological noise corrected data. The tSNR values were averaged across all six subjects and averaged over GM, the VC, and LGN ROIs, respectively. Subfigures (a) shows absolute tSNR values in GM and in the visual ROIs and (b) relative tSNR improvements due to physiological noise correction.
ROIs and fMRI Analysis
All image processing and analysis were implemented using SPM8 (http://www.fil.ion.ucl.ac.uk/spm/). The fMRI time series were realigned but not spatially smoothed to preserve the high spatial resolution. A GLM containing the task indicator for left/right hemispheric stimulation and physiological noise regressors was fitted to the time series after high-pass filtering using a cut-off period of 128 s. Voxel-wise F-tests and T-tests were performed to detect BOLD effects that were greater for flicker presentation than for the blank screen with P < 0.001 (uncorrected). Voxel-wise tSNR values were calculated as the mean signal over the acquired volumes divided by the residual standard deviation of the GLM fit.
To estimate regional tSNR and BOLD sensitivity, three ROIs representative of subcortical and cortical areas were defined. VC and LGN ROIs were determined as described in Ref. 6. In addition, a general gray matter (GM) ROI was defined by segmenting each subject's T1-weighted structural image using unified segmentation (24) and thresholding the GM probability maps at P > 0.8.
The mean tSNR across each ROI was calculated for every subject. As a direct and robust marker of BOLD sensitivity, the average t-score related to visual activation was estimated for the 5% most highly activated voxels in each ROI. The dependence of tSNR and t-scores on the pulse sequence type (2D/3D), physiological noise correction (on/off), and region (GM, V1, and LGN) were assessed by 2 × 2 × 3 factorial repeated measures analysis of variance (ANOVA) (P < 0.05; SPSS 17.0, SPSS Inc., Chicago).
RESULTS
Figure 1 shows the dependence of the 3D EPI tSNR estimates on the partition value used to temporally sample the physiological signal (reference partition). Maximal tSNR was achieved when the reference partition was set to the center partition, and this setting was used for all experimental results presented here. The largest increases in tSNR were obtained in cortical GM, where the contribution of physiological noise to overall image variance is larger due to the larger image SNR.
ANOVA of the tSNR values yielded significant main effects of the sequence type (3D/2D), physiological noise correction (on/off), and scanned region (GM, VC, and LGN) with all P < 0.001 (all F > 276). Furthermore, all two-way and the three-way interactions between sequence type, physiological noise correction, and region were significant (all P < 0.05 and F > 4.2). ANOVA of the t-scores measured in the visual fMRI experiment also indicated significance for all three main effects and all interaction effects (all P < 0.03 and F > 9.0) except for the interaction between region and sequence type (P > 0.1 and F < 4.1). Figure 2 illustrates how the mean tSNR and t-scores depended on the sequence type, physiological noise correction, and brain region. The highest tSNR and t-scores were consistently found for 3D EPI following physiological correction.
FIG. 2.

a: tSNR and (b) t-scores in a visual fMRI experiment shown for the different data acquisition (3D and 2D EPI), physiological noise correction (on/off), and different brain areas (cortical GM = blue; VC = red; lateral geniculate nucleus [LGN] = green). 3D EPI resulted in higher tSNR and t-scores than 2D EPI. Physiological noise correction benefited 3D EPI relatively more than 2D EPI.
Figure 3a and b shows subject-averaged tSNR maps in Montreal Neurological Institute (MNI) space for the 2D and 3D EPI acquisitions following physiological correction. Higher tSNR values were found for 3D EPI over most brain regions and tissue types. Figure 3c and d shows the increase in tSNR due to physiological correction for 2D and 3D EPI. Figure 3e and f shows comparisons of the tSNR obtained from the 2D and 3D EPI acquisitions before and after physiological correction.
FIG. 3.

tSNR maps after physiological correction for the (a) 2D and (b) 3D EPI sequences averaged across subjects. Increase in tSNR due to physiological noise correction for the (c) 2D and (d) 3D EPI acquisition. Increase of tSNR of the 3D EPI sequence over the 2D EPI sequence (e) without and (f) with physiological noise correction. The 3D EPI acquisition resulted in higher tSNR values and also benefited more from physiological noise correction, in particular, in cortical areas (note that green color in figures e and f indicate ∼25% higher tSNR values).
Figure 4 shows representative fMRI statistical parametric activation maps for 3D (a and b) and 2D (c and d) EPI with and without physiological noise correction. Physiological correction increased the extent of the activated regions for 3D EPI. Little effect of the physiological correction was seen on the activation maps obtained from 2D EPI.
FIG. 4.

Statistical F-maps of significantly activated voxels (uncorrected P < 0.001) for one individual subject based on uncorrected (a) 3D EPI and (c) 2D EPI data, and corrected (b) 3D EPI and (d) 2D EPI data. The 3D EPI-based maps show higher F-values and more widely extended activation. Note that data were not spatially smoothed and that the F-value colorbar is scaled differently for each subfigure.
An average tSNR increase of 12% (19%), 13% (18%), and 6% (11%) was found due to physiological correction for the 2D (3D) EPI acquisition in GM, VC, and LGN, respectively. The larger tSNR increase for 3D EPI reflects the higher susceptibility of this technique to physiological instabilities. Consistent with Figs. 2 and 3, higher tSNR for the 3D EPI method (compared to 2D) was found in subcortical regions (i.e., LGN, 164%) than in cortical regions (i.e., VC, 128%) due to the dominating contribution of thermal noise to signal variance in these regions.
For the 3D EPI acquisition, an average increase of 14% and 9% in t-scores was observed for VC and LGN, respectively, due to physiological correction. The 3D EPI acquisition outperformed the 2D acquisition by about 28% and 25% in the LGN and VC, respectively. No significant increase in average t-scores was observed for the 2D EPI acquisitions after physiological noise correction, which may be explained by the rather low baseline tSNR (Fig. 2).
DISCUSSION
We have demonstrated that multishot 3D EPI yields at least a 25% higher BOLD sensitivity than standard single-shot 2D EPI for 1.5 mm high-resolution fMRI at 3 T. 3D EPI performed comparably better in brain regions exhibiting low image SNR, as they were affected mainly by thermal noise. We have developed an image-based physiological noise correction for 3D EPI from methods established for 2D EPI (6). Application of physiological noise correction improved the tSNR by more than 30% and t-scores by more than 10% for 3D EPI.
3D EPI is generally expected to offer a higher image and temporal SNR than 2D EPI (i.e., SNR ∼ 1/sqrt[number of partitions];(5)). The about 28% improvement in image SNR expected theoretically for GM for the acquisition protocols used here (assuming T1 = 1331 ms and T = 47 ms (25)) was corroborated by the 25%–28% increase measured in vivo and was in line with previous comparisons of 2D with 3D EPI at 7 T (5, 7) and 3 T (16). As this improvement depends on the number of partitions and TR, smaller coverage or lower resolution in the partition encoding direction is expected to reduce the benefit of 3D EPI (5). For a realistic assessment, we chose an acquisition protocol providing a good compromise between speed and coverage, resulting in a volume acquisition time of 3.2 s and about 40% brain coverage.
In addition to increased functional sensitivity, the 3D acquisition offers the potential for two-directional parallel imaging and other acceleration techniques such as UNFOLD (26). Parallel imaging along the partition direction might be used to accelerate the acquisition of each 3D EPI volume or to extend the brain coverage at no extra cost in terms of acquisition time. However, the use of 2D parallel imaging might result in significant reductions in tSNR due to the associated decrease in the number of acquired partition steps per volume and increase in the values of the g-factor (27). At the expense of a reduction in tSNR 2D parallel imaging might help to reduce the volume acquisition time by a factor 3–4 compared to the protocol used here, resulting in a volume acquisition time of less than 1 s.
Physiological Noise Correction
3D and 2D EPI acquisitions show different physiological noise characteristics due to different sensitivity to inflow or phase instability (28). We developed an image-based physiological noise correction method for 3D EPI primarily based on Ref. 6 with the important extension that it takes into account that data are not acquired slice-wise in real space but partition-wise in k-space. We demonstrated that the best results were achieved when each regressor's timing was based on the acquisition time of the central k-space partition, which carries the most signal and physiological noise. Recently, Barry et al. (8) compared three different noise correction methods for 2D EPI and 3D PRESTO EPI. Although the highest improvements were obtained using a combination of all three methods, RETROICOR yielded the highest improvements in temporal stability. Phase regression (29) (based on complex data) enables the suppression of the BOLD effect arising from large vessels away from the sites of neural activity. The contribution of the Stockwell Transform method (30) (based on magnitude data) was found comparably small. As a result, and because magnitude-image-based methods offer the possibility of combining physiological correction and fMRI statistical analysis, we developed a correction method based on magnitudes images including RETROICOR and using a standard analysis software (SPM8; (31)). Note that other regressors accounting for residual motion and changes in respiration and heart rate were also included which account for a significant amount of signal variance due to the physiology (6). These contributions to physiological noise were not accounted for in the previous study on 3D EPI noise correction (8). In keeping with the hypothesis that multishot 3D EPI is more susceptible to physiological noise, the results showed that 3D EPI data benefit relatively more from the physiological noise correction than 2D EPI.
A single reference slice was used for correction of cardiac and respiratory phase effects (RETROICOR) for the entire brain volume. Correction of cardiac and respiratory effects using RETROICOR is intrinsically phase-insensitive due to the fitting of sine and cosine Fourier basis functions independently at each voxel, which accounts for any phase shift of the physiological signal across different slices (6, 13). The effectiveness of the correction using a single reference slice is corroborated by Fig. 2a, which shows a comparable effect of physiological correction for GM and VC, although these regions spread over different slices. This was further verified using a different reference slice for extraction of the physiological signal that led to negligible changes in tSNR and statistical scores (data not shown). Among the other types of regressors used here for physiological correction, the residual motion regressors are extracted from the rigid-body realignment of the data and provide one estimate of motion per EPI volume. Clearly, they are therefore insensitive to the choice of the reference slice (14). As a result, only the regressors modeling changes in respiratory and cardiac rates are sensitive to the choice of the reference slice (15, 21). The negligible changes in tSNR that were observed when a different reference slice was used are consistent with the comparably small contribution of the changes in respiratory and cardiac rate regressors to the overall physiological correction observed in Ref. 6. Furthermore, the use of a single reference slice greatly simplifies the implementation in standard analysis packages such as SPM, which do not allow for slice-wise definition of the GLM.
Alternative Approaches for High-Resolution fMRI
Alternative approaches for high-resolution fMRI have been developed, which are not based on 2D or 3D gradient-echo EPI. 2D spin-echo EPI (2) and 3D GRASE (32) were used for fMRI with 1 mm or even higher resolution. However, spin-echo EPI shows a significantly reduced BOLD sensitivity at 3 T compared to gradient-echo EPI (33). Multiplexed 2D EPI is an innovative approach to speeding up acquisition by combining multiband excitation and simultaneous echo refocusing, but it has not been applied to high-resolution fMRI at 3 T (9). Steady-state free precession (SSFP) sequences have also been used, exhibiting high SNR and minimal susceptibility-induced signal loss and geometric distortion (28, 34). However, they suffer from off-resonance banding artifacts and require sophisticated real-time gating and data reacquisition schemes to reduce physiological noise (28). Similarly, FLASH sequences were used for laminar-specific fMRI at 3 T (35), but they are slow, relatively inefficient due to long dead times, and sensitive to physiological noise (28).
Considerations
The 3D and 2D EPI acquisitions are best implemented on a modern MRI scanner offering high SNR and optimal parallel imaging capabilities. If a whole-body gradient coil is used, parallel imaging in the phase encoding direction with a speed up factor of 2 or more is mandatory to achieve an appropriately short echo time and readout time for high BOLD sensitivity and low geometric distortion. At 1.5 mm isotropic resolution, the image SNR is low at 3 T but can effectively be increased by about 30% in the center of the brain and by more than 200% in the cortex using multichannel head coils (36), making fMRI at a temporal SNR of 20–40 possible as shown here.
An interleaved slice ordering was used for the 2D EPI acquisitions to minimize saturation of magnetization due to overlap between adjacent slices. Numerical simulations of the Bloch equations with Matpulse (37) indicated a reduction of 2% in signal due to this overlap for the chosen acquisition parameters (assuming T1 = 1331 ms (25)). Alternatively, RF pulses with a higher bandwidth-time product might be used to achieve a better-defined slice profile and less overlap. However, hardware limitations (e.g., maximum achievable RF power and slice-gradient strength) might require longer RF pulses and therefore longer echo times. This is in part the reason for the longer echo times used here for the 2D EPI acquisitions, which led to a ∼5% reduction in image SNR compared to the 3D EPI sequence (assuming T = 66 ms (38)). Note that RF pulse limitations are less constricting for 3D EPI acquisitions due to the lower nominal flip angle values and thicker slices used there (compared to 2D EPI), which allow for better-defined slab-profiles.
We note that including nuisance regressors in the GLM may not only remove noise variance but also variance of the effect of interest, i.e., true BOLD activation, as the correction is effectively based on correlation analysis. Therefore, spurious correlations between the nuisance regressors and the experimental design should be avoided (for discussion, see Ref. 6).
CONCLUSIONS
The combination of 3D EPI with physiological noise correction provides exceptional sensitivity for 1.5 mm high-resolution fMRI at 3 T, outperforming standard 2D EPI. The physiological noise correction increases the BOLD sensitivity significantly, can be easily applied, and requires simple recordings of pulse and respiration only. Multishot 3D EPI with physiological noise correction constitutes an important method for fMRI studies of the microstructure of the human brain.
Acknowledgments
The authors would like to thank Rebecca P. Lawson and Jonathan P. Roiser (UCL Institute of Cognitive Neuroscience University College London, London, UK) for help with the data acquisition and conducting a pilot study.
REFERENCES
- 1.Haynes JD, Deichmann R, Rees G. Eye-specific effects of binocular rivalry in the human lateral geniculate nucleus. Nature. 2005;438:496–499. doi: 10.1038/nature04169. [DOI] [PMC free article] [PubMed] [Google Scholar]
- 2.Yacoub E, Harel N, Ugurbil K. High-field fMRI unveils orientation columns in humans. Proc Natl Acad Sci USA. 2008;105:10607–10612. doi: 10.1073/pnas.0804110105. [DOI] [PMC free article] [PubMed] [Google Scholar]
- 3.Chadwick MJ, Hassabis D, Weiskopf N, Maguire EA. Decoding individual episodic memory traces in the human hippocampus. Curr Biol. 2010;20:544–547. doi: 10.1016/j.cub.2010.01.053. [DOI] [PMC free article] [PubMed] [Google Scholar]
- 4.Speck O, Stadler J, Zaitsev M. High resolution single-shot EPI at 7T. MAGMA. 2008;21:73–86. doi: 10.1007/s10334-007-0087-x. [DOI] [PubMed] [Google Scholar]
- 5.Poser BA, Koopmans PJ, Witzel T, Wald LL, Barth M. Three dimensional echo-planar imaging at 7 Tesla. Neuroimage. 2010;51:261–266. doi: 10.1016/j.neuroimage.2010.01.108. [DOI] [PMC free article] [PubMed] [Google Scholar]
- 6.Hutton C, Josephs O, Stadler J, Featherstone E, Reid A, Speck O, Bernarding J, Weiskopf N. The impact of physiological noise correction on fMRI at 7 T. Neuroimage. 2011;57:101–112. doi: 10.1016/j.neuroimage.2011.04.018. [DOI] [PMC free article] [PubMed] [Google Scholar]
- 7.van der Zwaag W, Marques JP, Kober T, Glover G, Gruetter R, Krueger G. Temporal SNR characteristics in segmented 3D-EPI at 7T. Magn Reson Med. 2012;67:344–352. doi: 10.1002/mrm.23007. [DOI] [PMC free article] [PubMed] [Google Scholar]
- 8.Barry RL, Strother SC, Gore JC. Complex and magnitude-only preprocessing of 2D and 3D BOLD fMRI data at 7 T. Magn Reson Med. 2012;67:867–871. doi: 10.1002/mrm.23072. [DOI] [PMC free article] [PubMed] [Google Scholar]
- 9.Feinberg DA, Moeller S, Smith SM, Auerbach E, Ramanna S, Gunther M, Glasser MF, Miller KL, Ugurbil K, Yacoub E. Multiplexed echo planar imaging for sub-second whole brain FMRI and fast diffusion imaging. PLoS One. 2010;5:e15710. doi: 10.1371/journal.pone.0015710. [DOI] [PMC free article] [PubMed] [Google Scholar]
- 10.Barry RL, Strother SC, Gatenby JC, Gore JC. Data-driven optimization and evaluation of 2D EPI and 3D PRESTO for BOLD fMRI at 7 Tesla: I. Focal coverage. Neuroimage. 2011;55:1034–1043. doi: 10.1016/j.neuroimage.2010.12.086. [DOI] [PMC free article] [PubMed] [Google Scholar]
- 11.Triantafyllou C, Hoge RD, Krueger G, Wiggins CJ, Potthast A, Wiggins GC, Wald LL. Comparison of physiological noise at 1.5 T, 3 T and 7 T and optimization of fMRI acquisition parameters. Neuroimage. 2005;26:243–250. doi: 10.1016/j.neuroimage.2005.01.007. [DOI] [PubMed] [Google Scholar]
- 12.Triantafyllou C, Polimeni JR, Wald LL. Physiological noise and signal-to-noise ratio in fMRI with multi-channel array coils. Neuroimage. 2011;55:597–606. doi: 10.1016/j.neuroimage.2010.11.084. [DOI] [PMC free article] [PubMed] [Google Scholar]
- 13.Glover GH, Li TQ, Ress D. Image-based method for retrospective correction of physiological motion effects in fMRI: RETROICOR. Magn Reson Med. 2000;44:162–167. doi: 10.1002/1522-2594(200007)44:1<162::aid-mrm23>3.0.co;2-e. [DOI] [PubMed] [Google Scholar]
- 14.Friston KJ, Williams S, Howard R, Frackowiak RS, Turner R. Movement-related effects in fMRI time-series. Magn Reson Med. 1996;35:346–355. doi: 10.1002/mrm.1910350312. [DOI] [PubMed] [Google Scholar]
- 15.Birn RM, Diamond JB, Smith MA, Bandettini PA. Separating respiratory-variation-related fluctuations from neuronal-activity-related fluctuations in fMRI. Neuroimage. 2006;31:1536–1548. doi: 10.1016/j.neuroimage.2006.02.048. [DOI] [PubMed] [Google Scholar]
- 16.Hu Y, Glover GH. Three-dimensional spiral technique for high-resolution functional MRI. Magn Reson Med. 2007;58:947–951. doi: 10.1002/mrm.21328. [DOI] [PubMed] [Google Scholar]
- 17.Goerke U, Moller HE, Norris DG, Schwarzbauer C. A comparison of signal instability in 2D and 3D EPI resting-state fMRI. NMR Biomed. 2005;18:534–542. doi: 10.1002/nbm.987. [DOI] [PubMed] [Google Scholar]
- 18.Neggers SF, Hermans EJ, Ramsey NF. Enhanced sensitivity with fast three-dimensional blood-oxygen-level-dependent functional MRI: comparison of SENSE-PRESTO and 2D-EPI at 3 T. NMR Biomed. 2008;21:663–676. doi: 10.1002/nbm.1235. [DOI] [PubMed] [Google Scholar]
- 19.Griswold MA, Jakob PM, Heidemann RM, Nittka M, Jellus V, Wang J, Kiefer B, Haase A. Generalized autocalibrating partially parallel acquisitions (GRAPPA) Magn Reson Med. 2002;47:1202–1210. doi: 10.1002/mrm.10171. [DOI] [PubMed] [Google Scholar]
- 20.Deichmann R, Schwarzbauer C, Turner R. Optimisation of the 3D MDEFT sequence for anatomical brain imaging: technical implications at 1.5 and 3 T. Neuroimage. 2004;21:757–767. doi: 10.1016/j.neuroimage.2003.09.062. [DOI] [PubMed] [Google Scholar]
- 21.Shmueli K, van GP, de Zwart JA, Horovitz SG, Fukunaga M, Jansma JM, Duyn JH. Low-frequency fluctuations in the cardiac rate as a source of variance in the resting-state fMRI BOLD signal. Neuroimage. 2007;38:306–320. doi: 10.1016/j.neuroimage.2007.07.037. [DOI] [PMC free article] [PubMed] [Google Scholar]
- 22.Chang C, Glover GH. Effects of model-based physiological noise correction on default mode network anti-correlations and correlations. Neuroimage. 2009;47:1448–1459. doi: 10.1016/j.neuroimage.2009.05.012. [DOI] [PMC free article] [PubMed] [Google Scholar]
- 23.Tijssen RH, Miller KL. 2012. Retrospective correction for 3D fMRI: RETROICOR or RETROKCOR? In: Proceedings of the 20th Annual Meeting of ISMRM, Melbourne, Australia, Abstract 2091.
- 24.Ashburner J, Friston KJ. Unified segmentation. Neuroimage. 2005;26:839–851. doi: 10.1016/j.neuroimage.2005.02.018. [DOI] [PubMed] [Google Scholar]
- 25.Wansapura JP, Holland SK, Dunn RS, Ball WS. NMR relaxation times in the human brain at 3.0 Tesla. J Magn Reson Imaging. 1999;9:531–538. doi: 10.1002/(sici)1522-2586(199904)9:4<531::aid-jmri4>3.0.co;2-l. [DOI] [PubMed] [Google Scholar]
- 26.Afacan O, Hoge WS, Janoos F, Brooks DH, Morocz IA. Rapid full-brain fMRI with an accelerated multi shot 3D EPI sequence using both UNFOLD and GRAPPA. Magn Reson Med. 2012;67:1266–1274. doi: 10.1002/mrm.23106. [DOI] [PubMed] [Google Scholar]
- 27.Pruessmann KP, Weiger M, Scheidegger MB, Boesiger P. SENSE: sensitivity encoding for fast MRI. Magn Reson Med. 1999;42:952–962. [PubMed] [Google Scholar]
- 28.Tijssen RH, Okell TW, Miller KL. Real-time cardiac synchronization with fixed volume frame rate for reducing physiological instabilities in 3D FMRI. Neuroimage. 2011;57:1364–1375. doi: 10.1016/j.neuroimage.2011.05.070. [DOI] [PubMed] [Google Scholar]
- 29.Menon RS. Postacquisition suppression of large-vessel BOLD signals in high-resolution fMRI. Magn Reson Med. 2002;47:1–9. doi: 10.1002/mrm.10041. [DOI] [PubMed] [Google Scholar]
- 30.Goodyear BG, Zhu H, Brown RA, Mitchell JR. Removal of phase artifacts from fMRI data using a Stockwell transform filter improves brain activity detection. Magn Reson Med. 2004;51:16–21. doi: 10.1002/mrm.10681. [DOI] [PubMed] [Google Scholar]
- 31.Friston K, Ashburner J, Kiebel S, Nichols T, Penny W. Statistical parametric mapping: the analysis of functional brain images. London: Elsevier; 2007. [Google Scholar]
- 32.Zimmermann J, Goebel R, De MF, Van De Moortele PF, Feinberg D, Adriany G, Chaimow D, Shmuel A, Ugurbil K, Yacoub E. Mapping the organization of axis of motion selective features in human area MT using high-field fMRI. PLoS One. 2011;6:e28716. doi: 10.1371/journal.pone.0028716. [DOI] [PMC free article] [PubMed] [Google Scholar]
- 33.Schwarzbauer C, Mildner T, Heinke W, Brett M, Deichmann R. Dual echo EPI—the method of choice for fMRI in the presence of magnetic field inhomogeneities? Neuroimage. 2010;49:316–326. doi: 10.1016/j.neuroimage.2009.08.032. [DOI] [PubMed] [Google Scholar]
- 34.Miller KL, Smith SM, Jezzard P, Pauly JM. High-resolution FMRI at 1.5T using balanced SSFP. Magn Reson Med. 2006;55:161–170. doi: 10.1002/mrm.20753. [DOI] [PubMed] [Google Scholar]
- 35.Koopmans PJ, Barth M, Norris DG. Layer-specific BOLD activation in human V1. Hum Brain Mapp. 2010;31:1297–1304. doi: 10.1002/hbm.20936. [DOI] [PMC free article] [PubMed] [Google Scholar]
- 36.Wiggins GC, Triantafyllou C, Potthast A, Reykowski A, Nittka M, Wald LL. 32-channel 3 Tesla receive-only phased-array head coil with soccer-ball element geometry. Magn Reson Med. 2006;56:216–223. doi: 10.1002/mrm.20925. [DOI] [PubMed] [Google Scholar]
- 37.Matson GB. An integrated program for amplitude-modulated RF pulse generation and re-mapping with shaped gradients. Magn Reson Imaging. 1994;12:1205–1225. doi: 10.1016/0730-725x(94)90086-7. [DOI] [PubMed] [Google Scholar]
- 38.Gelman N, Gorell JM, Barker PB, Savage RM, Spickler EM, Windham JP, Knight RA. MR imaging of human brain at 3.0 T: preliminary report on transverse relaxation rates and relation to estimated iron content. Radiology. 1999;210:759–767. doi: 10.1148/radiology.210.3.r99fe41759. [DOI] [PubMed] [Google Scholar]