

Abstract.
This study aimed to investigate imaging statistical approaches for classifying three-dimensional (3-D) osteoarthritic morphological variations among 169 temporomandibular joint (TMJ) condyles. Cone-beam computed tomography scans were acquired from 69 subjects with long-term TMJ osteoarthritis (OA), 15 subjects at initial diagnosis of OA, and 7 healthy controls. Three-dimensional surface models of the condyles were constructed and SPHARM-PDM established correspondent points on each model. Multivariate analysis of covariance and direction-projection-permutation (DiProPerm) were used for testing statistical significance of the differences between the groups determined by clinical and radiographic diagnoses. Unsupervised classification using hierarchical agglomerative clustering was then conducted. Compared with healthy controls, OA average condyle was significantly smaller in all dimensions except its anterior surface. Significant flattening of the lateral pole was noticed at initial diagnosis. We observed areas of 3.88-mm bone resorption at the superior surface and 3.10-mm bone apposition at the anterior aspect of the long-term OA average model. DiProPerm supported a significant difference between the healthy control and OA group (). Clinically meaningful unsupervised classification of TMJ condylar morphology determined a preliminary diagnostic index of 3-D osteoarthritic changes, which may be the first step towards a more targeted diagnosis of this condition.
Keywords: temporomandibular joint disorders, osteoarthritis, bone remodeling, three-dimensional imaging, cone-beam computed tomography
1. Introduction
Temporomandibular joint (TMJ) osteoarthritis (OA) has been described as a progressive degenerative joint disorder caused by a pathological imbalance between the dynamic processes of breakdown and repair of the organic tissues.1–5 The complex pathogenesis of the disease has remained unclear,6 and its course challenges experts given the different morphological patterns of progression observed in its various stages.7 It may evolve into repair and morphological adaptation, featuring a functional remodeling.8,9 However, it may present an adverse course characterized by aggressive bone destruction, deformity of related structures, and functional impairment.2,7,8 This unpredictable scenario hampers the development of valid therapies.3,10
The TMJ differs from other joints because it is covered by a layer of fibrocartilage, instead of hyaline cartilage.10 The bone of the mandibular condyles is located just beneath the fibrocartilage, making it particularly vulnerable to inflammatory damage and a valuable model for studying arthritic bony changes. The bone in the TMJ condyle is the site of numerous dynamic morphological transformations, which are an integral part of the initiation/progression of arthritis, not merely secondary manifestations to cartilage degradation. Thus, a strong rationale exists for therapeutic approaches that target bone resorption and formation.11–15
Clinical and pathological presentation of TMJ OA ranges from mild failure of the joint components with disk displacement and degeneration, to loss of articular fibrocartilage, synovitis, and subchondral bone alterations such as sclerosis, flattening, erosions, and bone overgrowth with osteophytes formation.1,5,16 Early diagnosis of such conditions is important to monitor bone destruction, either localized to the TMJ or systemic, before loading the joints with orthodontic/orthopedic forces or undertaking jaw surgery. Therefore, further investigation on the different morphological osteoarthritic patterns, particularly on their initial stages, is necessary in order to better understand the specific features involved in the disease process.
Although magnetic resonance imaging (MRI) of the TMJ has now been used for many years, its diagnostic and therapeutic efficacy remains unclear.17,18 MRIs have provided essential information about disk position, morphology, and integrity. However, the value of this exam for supporting clinicians in their diagnoses and treatment decisions has been questioned given its potential disadvantages in evaluating osseous structures.19 Computed tomography (CT) is generally accepted as the most useful technique for assessing OA changes in the TMJs, being able to provide clinicians and researchers with detailed information on bone remodeling.18,20–26
Cone-beam computed tomography (CBCT) has assumed a prominent role in the diagnosis of condylar remodeling.18 It provides a clear visualization of the hard tissues of the TMJ1,16,18 and markedly reduces radiation and cost compared to multislice spiral computed tomography.16 Through the analysis of different tomographic slices, it becomes possible to identify specific changes in the anatomy of the mandibular condyles with OA. Moreover, new technologies such as the use of three-dimensional (3-D) surface models allow for a comprehensive evaluation of the overall morphological alterations.
Detailed knowledge about osteoarthritic bone changes is fundamental for correctly diagnose the dysfunctions associated with the disease and for adequate treatment planning.27 The 3-D shape correspondence analysis (SPHARM-PDM) has aroused the interest of the medical community due to its accuracy in locating and quantifying morphological changes between healthy and pathological structures.28 This innovative method for diagnosing TMJ OA minimizes the importance of examiner’s experience, reducing intra- and inter-rater-related errors, standardizes findings, allowing new discoveries, and also contributes to the development of new imaging markers for risk factors.1
This study objective was to investigate imaging statistical approaches to classify 3-D osteoarthritic morphological variations, as determined by 1002 correspondent landmarks in the TMJ condylar surface, using CBCT-based models. Specifically, this study proposed to identify differences among the asymptomatic controls and the TMJ OA group by means of supervised classification. Then, the unsupervised classification categorized such complex disease, making it possible the development of a preliminary diagnostic index of TMJ condylar OA.
2. Methods
The study group consisted of 91 individuals initially divided into three groups: 69 subjects () that presented with signs and symptoms of TMJ OA for more than 1 year were assigned into the long-term diagnosis group; 15 subjects () that experienced signs and symptoms of the disease for less than 2 months composed the initial diagnosis group; and 7 subjects () that did not show any sign or symptom of OA formed the healthy control group. Subjects were recruited from the university clinic or through advertisement, and underwent a clinical exam by an orofacial pain specialist using diagnostic criteria guidelines. Following clinical diagnosis of TMJ OA or health, a 20-second CBCT scan was taken on all participants, using the same machine (i-CAT Next Generation, 120 kV, 18.66 mA, Imaging Sciences, Hatfield, Pennsylvania) and a large field of view to include both TMJs. The study was approved by the University of Michigan Institutional Review Board under the protocol IRB00000246 and all subjects consented to the investigation.
The 3-D surface mesh models of the right and left mandibular condyles were constructed by outlining the cortical boundaries of the condylar region using semi-automatic discrimination procedures, that allowed manual editing, checking slice by slice in all three planes of space (ITK-SNAP software v.2.4).29 After generating all 3-D surface models, left condyles were mirrored in the sagittal plane to form right condyles to facilitate comparisons. Twenty-five landmarks were placed on the surface of each condyle by one observer at corresponding (homologous) areas to closely approximate the various anatomic regions of all individuals who present marked morphological variability (Fig. 1). The regional superimposition technique used in the present study for across subject comparisons was validated by Schilling et al.30 After registration, all condylar models were simultaneously cropped to define the condylar region of interest. SPHARM-PDM software (SPHARM-PDM software)31 was used to generate a mesh with 1002 correspondent points, via spherical mapping and spherical parameterization of the input volumes. An average 3-D condylar shape was generated for the TMJ OA groups and control group [Fig. 2(a)] (Linux MeshMath script).31 The core of the ability to compute the group average and group variability is the establishment of correspondence between each of the 1002 points in the condylar surface models across all subjects.
Fig. 1.

(a) Twenty-five points in the ramus and condyle surfaces used for the landmark-based registration, (b) reference condylar model (purple) with the overlay of multiple condyles approximated in the same coordinate system, (c) parameterization of 1002 correspondent surface mesh points for statistical comparisons and detailed morphological characterization.
Fig. 2.

(a) Average condylar morphology, (b) semi-transparent overlays of group average morphologies. At their initial diagnostic appointment, osteoarthritis (OA) subjects already presented marked bone changes that are more severe in the group with long-term OA.
The Linux MeshMath script was then used to calculate 3-D point-wise linear distances between each group’s average morphology [Fig. 2(a)]. Semi-transparent overlays between the average models in 3-D slicer software32 were used to visually compare the different morphologies [Fig. 2(b)]. The computed 1002 vector differences were displayed on the condyle surface, scaled according to the magnitude of the difference and pointing in the direction of the change. The patterns of variation across TMJ OA and control samples were determined through the calculation of signed distances, where the areas of bone resorption were displayed as negative values (blue), no differences (0 mm surface distances, white), or bone proliferation as positive (red) [Fig. 3(a)].
Fig. 3.

(a) Quantitative assessment of condylar morphology is shown in signed distance color-coded maps computed locally at each correspondent surface point: blue areas are indicative of bone resorption and red areas are indicative of bone overgrowth. (b) In the -value map, highly significant differences () are color-coded with red, intermediate significant differences are color-coded with green (), and nonsignificant differences are color-coded with blue ().
The statistical framework for testing morphological variations of the 169 condyles included supervised and unsupervised classifications. A Hotelling test, in a multivariate analysis of covariance (Shape analysis MANCOVA software),33 assessed statistically significant morphological variations between the average condyle models. Direction-projection-permutation (DiProPerm) was used for testing high dimensional hypotheses. The DiProperm method was aimed at rigorous testing of whether lower dimensional visual differences were statistically significant34 through three steps: (1) determining direction by projecting samples onto an appropriate direction; (2) projection by calculating univariate two sample statistics; and (3) permutation by assessing significance using 1000 permutations of group membership. Distance weighted discrimination (DWD)35 calculated a direction vector to classify high dimensional datasets, and their principal components (PCs) were graphically plotted. Given the fact that the control and OA samples have different sample sizes, an appropriately weighted version of DWD, the weighted DWD (wDWD), was used to find a direction vector in the feature space separating the morphology groups. Unsupervised classification using hierarchical agglomerative clustering (HAC) was conducted in order to group unlabeled data into subsets (clusters) that are believed to reflect the underlying structure of the data, based on morphological similarity.
3. Results
Qualitative assessment of the semi-transparent overlays revealed that, even at their initial diagnostic appointment, OA subjects already presented with noticeable morphological bone changes that were more marked in the group with long-term history of TMJ OA [Fig. 2(b)]. Quantitative assessment of group comparisons was reported using signed distance maps locally computed at each correspondent point. Compared to the healthy control group, the long-term OA average model was of smaller size in all dimensions except its anterior surface, and areas of statistically significant differences were observed along the whole condylar surface except at the pterygoid fossa and part of the lateral aspect of the condylar neck (). Considering the comparison between the healthy control and initial diagnosis average models, areas of statistically significant differences were noticed in the superior articular surface of the condyles, particularly in the anterior and superior portions of the lateral pole and also in the medial pole and medial aspect of the condylar neck (). Areas indicating 2.38-mm bone resorption were observed at the superior surface of the initial diagnosis average model and 3.88 mm in the long-term group as compared to the healthy control group. In the anterior surface of the condyle, a small area of 1.86 mm of bone apposition was noted at initial diagnosis and 3.10 mm at the long-term OA average models compared with healthy controls. When the initial diagnosis and long-term OA average models were compared, statistically significant differences indicative of disease progression were also noticed (). Weobserved an area of 1.98-mm bone apposition at the anterior surface and 2.64-mm bone resorption at the superior articular surface of the long-term OA average model [Fig. 3].
Regarding the supervised classification, the DiProPerm test found a statistically significant morphological difference between the healthy control and the OA group (). The projected plots of the healthy control condyles tended to cluster and were clearly separated from the OA groups. Most projected plots of initial diagnosis condyles were located within the bounds of the plots of the long-term diagnosis condyles. The maximal partition of condylar morphology, as established by 1002 points in each individual condyle, was observed in the graphic plots of the PC refined in the wDWD direction. The wDWD direction onto the PC was shown by the angle in the PC analysis score plots [Fig. 4]. The maximum variability in this cohort (both OA and healthy) occurred in condylar head morphology as a whole (PC1), then in the medial pole (PC2), and in the lateral pole (PC3). The projections in the wDWD direction indicated the characteristic condylar remodeling from healthy condyles to OA groups. Figure 5 illustrates the condylar morphology variability considering the first, second, and third PCs of deformation. Links for a 3-D visualization of each deformation are available in the online version of this paper.
Fig. 4.
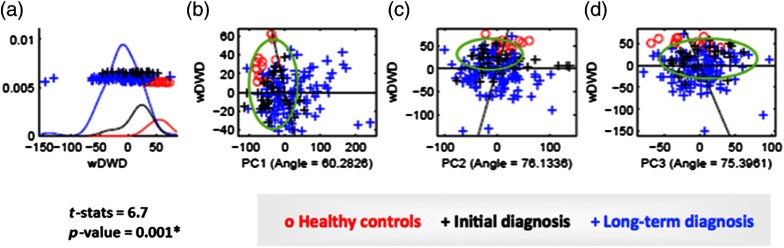
Direction-projection-permutation (DiProPerm) graphic results. The left panel shows the distribution of the data projected onto the wDWD direction, illustrating how well the groups can be separated. The curves in the left panel are smooth histograms, with each color showing the subhistograms for the different groups. The center and right panels show principal component (PC) graphics, where each condyle is plotted in the first, second, and third principal directions. The horizontal -axis is the projected value, and the vertical -axis reflects order in the dataset, to avoid overplotting. (a). wDWD shows the direction that represents the best dissociation among the three classes. This classification includes nonuniform, complex condylar head surface modeling, as well as neck torque, overall condylar morphological variability, considering both the lateral and medial poles. (b) PC1 shows general condylar morphological variability in the wDWD direction. (c) PC2 shows medial pole morphological variability in the wDWD direction. (d) PC3 reports lateral pole morphological variability in the wDWD direction.
Fig. 5.

Clinically meaningful unsupervised classification of condylar morphology was obtained using hierarchical agglomerative clustering. A detailed cluster dendogram classified individual condyles to subgroups that identified distinct condylar morphologies Fig. 6). The -axis of the dendogram is a measure of closeness (i.e., linkage criterion) of linked clusters. The lower linked cluster means that those condyles were morphologically similar as compared with condyles in the next upper cluster or other clusters. The height on the -axis is a distance between connected groups to the next higher cluster. Thus, greater height difference means more morphological difference between clusters. The -axis shows a metric (a measure of distance between pairs of observations) and a Euclidean distance that was used to calculate the distance between pairs. Along with the -axis, clusters with the most similarity are lined up from left to right: a cluster on the very left side will be most different than a cluster on the very right side. In Fig. 6, we can see in detail the condyles that were the most dissimilar. Figure 7 illustrates all the 169 condyles superimposed on the average control following the same sequence exhibited in the dendogram.
Fig. 6.
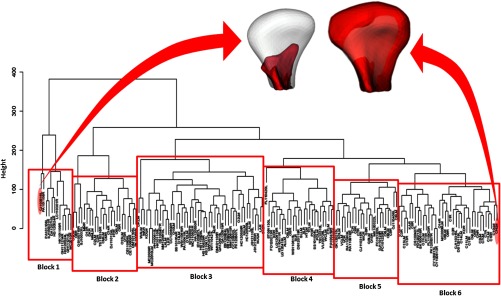
Cluster dendogram with a complete-linkage method of all 169 condyles. Note that in the detail, the greatest different condyles (red) superimposed on the same average control (white) for comparison.
Fig. 7.

The entire sample (169 condyles) divided into six blocks according to the unsupervised classification. All condyles (red) were superimposed on the same average control (white).
4. Discussion
The mandibular condyle is the site of numerous dynamic morphologic transformations in the initiation/progression of OA,36–39 which are not merely secondary manifestations to cartilage degradation. Thus, a strong rationale exists for therapeutic approaches that target bone resorption and formation and take into account the complex cross-talk between all of the joint tissues. The present study showed a new statistical modeling of condylar morphology that revealed specific patterns of bone resorption and repair at the articular surfaces of OA condyles even in early stages. Such approach may allow the development of more targeted classifications of this condition than previously possible.
A proper method for the 3-D registration was essential for the measurement of subtle bony differences in condylar morphology. Considering the great individual morphological variability across subjects, rigid voxel-based approaches were not appropriate to register anatomic structures from different subjects in populational or group average studies. The across subjects registration in this study used an landmark-based approach to approximate all condyles in a common coordinate system, making it possible the automatic computation of 1002 correspondent surface points for all the 169 different condyles.30
DiProPerm offered a rigorous way to statistically assess if differences in lower dimensional projections reflect true differences in the original high dimensional data.34 Through the DiProPerm graphic results [Figs. 4(a)–4(c)], it was possible to observe that most plot projections of initial diagnosis condyles were located within the bounds of the long-term diagnosis group. Even though both groups presented with characteristic osteoarthritic changes, there was a trend of some condyles from initial diagnosis group to shift towards the health control group. It may be explained by the fact that in subjects with diagnosis of OA, the disease progression usually affects one joint first. Therefore, morphological changes may be less evident in the contralateral TMJ.
Characteristic osteoarthritic changes observed in this study consisted of flattening of the superior articular surface of the condyles, particularly in the anterior and superior portions of the lateral pole, and bony projections in the anterior condylar surface, even at initial diagnosis. Significantly more marked flattening of the lateral pole and reduction in size of the condyle as a whole, as well as bone apposition at the anterior and medial poles were important findings observed at long-term diagnosis.
By using different imaging diagnostic approaches, studies observed resorption of the lateral pole of the condyle,40 shrinkage in its horizontal size and reduction in size with advancing stages of TMJ internal derangement (ID).41 Other authors reported flattening of the anterior surface of the condyle23,42 and overgrowth, which was seen primarily as enlargement in the horizontal direction.43 However, most of the literature reports only the presence or absence of osteoarthritic changes without providing details regarding location and amount of change.21,27,44–49
Our results clearly showed that subjects that had experienced long-term history of TMJ OA presented with more marked morphological changes in the mandibular condyle than the ones at initial diagnosis of the disease. Therefore, we may infer that such characteristics are interrelated in a progressive scale, i.e., the longer the subjects presented with signs and symptoms of the disease, the more marked condylar changes may be observed.
The authors have stated that the OA presents with a long “silent” period that is commonly diagnosed in a late stage, when significant joint damage has already occurred.50–52 It is possible that, even though the initial diagnosis group included only subjects with history of TMJ discomfort within the last 2 months, the condition could have been active but asymptomatic long-standing, characterizing different levels of remodeling. However, significant differences between the initial diagnosis and the long-term diagnosis groups were still noticed in the current study.
Controversy exists regarding the association between osteoarthritic morphological changes and clinical signs and symptoms of the disease. Researchers have found that TMJ pain is related to imaging findings of OA,46,53–56 whereas other studies have shown that they are not interrelated.1,21,57–61 Researchers have explained that the nonassociation between pain and imaging findings may be due to the differences in the onset of pain and detectable radiographic bony changes, because radiographs do not depict ongoing processes but the effect of a previous process.61 Furthermore, methods used for assessing pain symptoms in the literature are not well-standardized, which may contribute to the poor associations.
Pain is defined by the International Association for the Study of Pain as a sensory and emotional experience.62 Thus, it is almost impossible to standardize pain reports by rating the intensity level on a verbal rating scale. Different subjects, even presenting the same clinical condition may report it differently due to other emotional aspects that may be involved. Moreover, masticatory muscle pain often accompanies TMJ OA, and subjects are unable to distinguish pain of masticatory origin from pain of TMJ origin owing to the proximity of the structures.61
Future studies should utilize multidimensional instruments to measure pain including the cognitive, motivational, and evaluative components instead of just the sensory discriminative aspect.61,63 In the current study, all subjects underwent a complete clinical exam by an orofacial pain specialist using diagnostic criteria guidelines.64 Whereas pain is an important clinical symptom, joint bone destruction may progress asymptomatically, and bone degeneration may be detected only in later stages of the disease and after marked structural damage has already occurred.52 Rather than to correlate symptoms with the amount of bone destruction, it was the goal of this study to propose a method to evaluate condylar morphology, since researches have stated that knowledge about these bone changes is fundamental for correctly diagnosing the dysfunctions associated with the disease and for adequate treatment planning.27
After observing significant differences among the groups during supervised classification procedures, an unsupervised clustering was conducted, using a complete-linkage method, in order to automatically group the condyles considering specific morphological characteristics. This procedure allowed the development of a preliminary diagnostic index of 3-D osteoarthritic changes in TMJ condylar morphology. Figure 7 exhibits different image blocks grouped according to peculiar characteristics automatically detected through unsupervised statistical calculations. It was noticed consistently from the method given a progression in the disease process that went from Block 6 (large condyles; included the healthy controls) to Block 3. Block 1, the leftmost block, showed the most severe cases (small condyles due to huge resorptions) and Block 2 was characterized by condylar deformation with considerable proliferation changes, which constitutes a specific morphological variation of the disease.
Even though the ability to predict progression is not properly addressable in a cross-sectional study design, the present findings can be reasonable surrogate biomarkers of tissue destruction and/or repair overtime. By using such a standardized method for identifying detailed 3-D overall changes in the condylar morphology, future studies may be able to establish correlations with other clinical signs and symptoms of the disease, and therefore determine different treatment approaches for each particular case.
Wadhwa and Kapila stated that all current approaches to treatments of TMJ diseases are largely palliative. A definitive and rational diagnoses or treatments can only be achieved through a comprehensive understanding of the etiologies, predisposing factors, and pathogenesis of TMJ diseases.10
Much work remains to be done in this field to better understand the mechanisms involved in the disease process.10 As we continue to increase the control and OA sample sizes, our results may allow statistical description of combinatorial biomarker assessments such as receiver operating characteristic curves on disease versus health, as well as classification-based schemes for computer-aided diagnosis of TMJ OA.
5. Conclusions
The OA condyles presented evident reduction in size, with bone resorption at the superior articular surface, particularly at the lateral pole, and reparative bone apposition at the anterior surface and medial pole. Supervised classification revealed that subjects who had experienced long-term history of TMJ OA presented with more marked morphological changes in the mandibular condyle than the ones at initial diagnosis of the disease. Unsupervised classification provided a preliminary diagnostic index of 3-D osteoarthritic changes in TMJ condylar morphology, which may be the first step towards a more targeted diagnosis of this condition.
Acknowledgments
This work was supported by the National Institute of Dental an Craniofacial Research of the National Institutes of Health under Award No. R01DE024450, and by the Sao Paulo Research Foundation (FAPESP, Brazil, Grant No. 2013/22417-0). The content is solely the responsibility of the authors and does not necessarily represent the official views of the National Institutes of Health and FAPESP. This is an original work that has not been submitted for publication or presentation elsewhere. All authors had no financial and personal relationships with other people or organizations that could inappropriately influence (bias) their work.
Biographies
Liliane R. Gomes is a PhD student in the Department of Orthodontics and Pediatric Dentistry, Faculdade de Odontologia de Araraquara, UNESP Univ Estadual Paulista, Araraquara, Sao Paulo, Brazil. Currently she is conducting a research fellowship program at the Orthodontics Imaging Laboratory at the University of Michigan, Ann Arbor, Michigan, United States. Her research interests include orthodontics, ortho-surgical treatment, dentofacial deformities, three-dimensional (3-D) image analysis, and temporomandibular joint pathologies.
Marcelo Gomes has a private practice in Salvador, Bahia, Brazil. Currently, he has been working as a volunteer researcher at the Orthodontics Imaging Laboratory at the University of Michigan, Ann Arbor, Michigan, USA. His research interests include 3-D image analysis, cranial, and condylar morphology changes.
Bryan Jung received his BA and MS degrees in statistics. He has been working on statistical analysis in medical imaging data and health information security, and has contributed to several papers in the area of orthodontics, software engineering, computer science, and statistics.
Beatriz Paniagua is a research assistant professor in the Departments of Psychiatry, Computer Science (adjunct), and Orthodontics (adjunct) at the University of North Carolina at Chapel Hill. Since starting her PhD degree in image processing, she has always been interested in how computational sciences can be used to address biological questions. Statistical shape analysis applied to brain morphometry and cranio-facial morphology, deformable registration, machine learning, and image processing are among her research interests.
Antonio C. Ruellas is an associate professor in the Department of Pediatric Dentistry and Orthodontics at Federal University of Rio de Janeiro. He has received grants from Brazilian agencies of funding for research (Faperj and CNPq), and he is a National Council for Scientific and Technological Development of Brazil (CNPq) researcher. He is interested in clinical research related to prevention, diagnosis, and treatment in orthodontics.
Joao Roberto Goncalves is an associate professor at the Department of Orthodontics and Pediatric Dentistry, Faculdade de Odontologia de Araraquara, UNESP Univ Estadual Paulista, Araraquara, Sao Paulo, Brazil. He is a former fellow of oral and maxillofacial surgery at Baylor Medical Center, Dallas, Texas, USA. His main research interests include ortho-surgical treatment, temporomandibular joint pathologies, and dentofacial deformities.
Martin A. Styner is an associate professor in the Departments of Psychiatry and Computer Science of the University of North Carolina at Chapel Hill, with research in diffusion tensor imaging, anatomical structure and tissue segmentation, brain morphometry, deformable registration, and atlas building with application to human, nonhuman primate, canine, and rodent MRI studies. He has co-authored over 200 papers in peer-reviewed journals and conferences and is on the editorial board of Medical Image Analysis.
Larry Wolford is a clinical professor in the Departments of Oral and Maxillofacial Surgery and Orthodontics at Texas A&M Health Science Center, Baylor College of Dentistry, and in full-time private practice at Baylor University Medical Center, Dallas, Texas. He has co-written two text books, written 35 other book chapters, more than 190 other publications, and over 150 published scientific abstracts. He has received several awards for major contributions to his specialty.
Lucia Cevidanes is an assistant professor in the Department of Orthodontics and Pediatric Dentistry, University of Michigan. She has published over 70 manuscripts, received research grants from the National Institute of Dental and Craniofacial Research, and awards by the American Association of Orthodontists (Graber Award, Dewel Award, and Hellman Award) and by the American Academy of Oral and Maxillofacial (Wuehrmann Award). Her research interests include understanding treatment outcomes for arthritis, craniofacial anomalies, and dentofacial deformities.
References
- 1.Cevidanes L. H., et al. , “Quantification of condylar resorption in temporomandibular joint osteoarthritis,” Oral Surg. Oral Med. Oral Pathol. Oral Radiol. Endod. 110, 110–7 (2010).http://dx.doi.org/10.1016/j.tripleo.2010.01.008 [DOI] [PMC free article] [PubMed] [Google Scholar]
- 2.Tanaka E., Detamore M. S., Mercuri L. G., “Degenerative disorders of the temporomandibular joint: etiology, diagnosis, and treatment,” J. Dent. Res. 87(4), 296–307 (2008).http://dx.doi.org/10.1177/154405910808700406 [DOI] [PubMed] [Google Scholar]
- 3.Hunter D. J., Le Graverand-Gastineau M. P. H., “How close are we to having structure-modifying drugs available?,” Med. Clin. N Am. 93(1), 223–234 (2009).http://dx.doi.org/10.1016/j.mcna.2008.07.011 [DOI] [PubMed] [Google Scholar]
- 4.Rousseau J. C., Delmas P. D., “Biological markers in osteoarthritis,” Nat. Clin. Pract. Rheumatol. 3(6), 346–356 (2007).http://dx.doi.org/10.1038/ncprheum0508 [DOI] [PubMed] [Google Scholar]
- 5.van Spil W. E., et al. , “Serum and urinary biochemical markers for knee and hip-osteoarthritis: a systematic review applying the consensus BIPED criteria,” Osteoarthritis Cartilage/OARS, Osteoarthritis Res. Soc. 18(5), 605–612 (2010).http://dx.doi.org/10.1016/j.joca.2010.01.012 [DOI] [PubMed] [Google Scholar]
- 6.Wang X. D., et al. , “Current understanding of pathogenesis and treatment of TMJ osteoarthritis,” J. Dent. Res. (2015).http://dx.doi.org/10.1177/0022034515574770 [DOI] [PubMed] [Google Scholar]
- 7.Samuels J., Krasnokutsky S., Abramson S. B., “Osteoarthritis: a tale of three tissues,” Bull. NYU Hosp. Jt. Dis. 66(3), 244–250 (2008). [PubMed] [Google Scholar]
- 8.Arnett G. W., Milam S. B., Gottesman L., “Progressive mandibular retrusion-idiopathic condylar resorption. Part II,” Am. J. Orthod. Dentofacial. Orthop. 110(2), 117–27 (1996).http://dx.doi.org/10.1016/S0889-5406(96)70099-9 [DOI] [PubMed] [Google Scholar]
- 9.Bland J. H., “The reversibility of osteoarthritis: a review,” Am. J. Med. 74(6A), 16–26 (1983).http://dx.doi.org/10.1016/0002-9343(83)90524-7 [DOI] [PubMed] [Google Scholar]
- 10.Wadhwa S., Kapila S., “TMJ disorders: Future innovations in diagnostics and therapeutics,” J. Dent. Edu. 72(8), 930–947 (2008). [PMC free article] [PubMed] [Google Scholar]
- 11.Abramson S. B., Attur M., “Developments in the scientific understanding of osteoarthritis,” Arthritis. Res. Ther. 11, 227 (2009).http://dx.doi.org/10.1186/ar2655 [DOI] [PMC free article] [PubMed] [Google Scholar]
- 12.Bauer D. C., et al. “Classification of osteoarthritis biomarkers: a proposed approach,” Osteoarthritis Cartilage 14, 723–727 (2006).http://dx.doi.org/10.1016/j.joca.2006.04.001 [DOI] [PubMed] [Google Scholar]
- 13.Hayami T., et al. , “The role of subchondral bone remodeling in osteoarthritis: reduction of cartilage degeneration and prevention of osteophyte formation by alendronate in the rat anterior cruciate ligament transection model,” Arthritis Rheum. 50, 1193–206 (2004).http://dx.doi.org/10.1002/art.20124 [DOI] [PubMed] [Google Scholar]
- 14.Hunter D. J., et al. , “Imaging biomarker validation and qualification report: 6th OARSI workshop on imaging in osteoarthritis combined with 3rd OA biomarkers workshop,” Osteoarthritis and Cartilage, 21(7), pp. 939–942 (2013).http://dx.doi.org/10.1016/j.joca.2013.04.014 [DOI] [PMC free article] [PubMed] [Google Scholar]
- 15.Karsdal M. A., et al. , “Are nonresorbing osteoclasts sources of bone anabolic activity?,” J. Bone Miner. Res. 22, 487–494 (2007).http://dx.doi.org/10.1359/jbmr.070109 [DOI] [PubMed] [Google Scholar]
- 16.Alexiou K., Stamatakis H., Tsiklakis K., “Evaluation of the severity of temporomandibular joint osteoarthritic changes related to age using cone beam computed tomography,” Dento. Maxillo Facial Radiol. 38(3), 141–147 (2009).http://dx.doi.org/10.1259/dmfr/59263880 [DOI] [PubMed] [Google Scholar]
- 17.Limchaichana N., Petersson A., Rohlin M., “The efficacy of magnetic resonance imaging in the diagnosis of degenerative and inflammatory temporomandibular joint disorders: a systematic literature review,” Oral Surg. Oral Med. Oral Pathol. Oral Radiol. Endod. 102(4), 521–36 (2006).http://dx.doi.org/10.1016/j.tripleo.2006.02.001 [DOI] [PubMed] [Google Scholar]
- 18.Ahmad M., “Research diagnostic criteria for temporomandibular disorders (RDC/TMD): development of image analysis criteria and examiner reliability for image analysis,” Oral Surg. Oral Med. Oral Pathol. Oral Radiol. Endod. 107(6), 844–860 (2009).http://dx.doi.org/10.1016/j.tripleo.2009.02.023 [DOI] [PMC free article] [PubMed] [Google Scholar]
- 19.Geiger D., et al. , “Quantitative 3D ultrashort time-to-echo (UTE) MRI and micro-CT (muCT) evaluation of the temporomandibular joint (TMJ) condylar morphology,” Skeletal Radiol. 43(1), 19–25 (2014).http://dx.doi.org/10.1007/s00256-013-1738-9 [DOI] [PMC free article] [PubMed] [Google Scholar]
- 20.Larheim T. A., “Current trends in temporomandibular joint imaging,” Oral Surg. Oral Med. Oral Pathol. Oral Radiol. Endod. 80(5), 555–76 (1995).http://dx.doi.org/10.1016/S1079-2104(05)80154-4 [DOI] [PubMed] [Google Scholar]
- 21.Lee J. Y., et al. , “A longitudinal study on the osteoarthritic change of the temporomandibular joint based on 1-year follow-up computed tomography,” J. Craniomaxillofac. Surg. 40(8), e223–8 (2012).http://dx.doi.org/10.1016/j.jcms.2011.10.023 [DOI] [PubMed] [Google Scholar]
- 22.Brooks S. L., et al. , “Imaging of the temporomandibular joint: a position paper of the American academy of oral and maxillofacial radiology,” Oral Surg. Oral Med. Oral Pathol. Oral Radiol. Endod. 83(5), 609–18 (1997).http://dx.doi.org/10.1016/S1079-2104(97)90128-1 [DOI] [PubMed] [Google Scholar]
- 23.Moncada G., et al. , “Relationship between disk position and degenerative bone changes in temporomandibular joints of young subjects with TMD. An MRI study,” J. Clin. Pediatr. Dent. 38(3), 269–76 (2014).http://dx.doi.org/10.17796/jcpd.38.3.w43m8474433n7ur2 [DOI] [PubMed] [Google Scholar]
- 24.Hussain A. M., et al. , “Role of different imaging modalities in assessment of temporomandibular joint erosions and osteophytes: a systematic review,” Dentomaxillofac Radiol. 37(2), 63–71 (2008).http://dx.doi.org/10.1259/dmfr/16932758 [DOI] [PubMed] [Google Scholar]
- 25.Ludlow J. B., Davies K. L., Tyndall D. A., “Temporomandibular joint imaging: a comparative study of diagnostic accuracy for the detection of bone change with biplanar multidirectional tomography and panoramic images,” Oral Surg. Oral Med. Oral Pathol. Oral Radiol. Endod. 80(6), 735–43 (1995).http://dx.doi.org/10.1016/S1079-2104(05)80259-8 [DOI] [PubMed] [Google Scholar]
- 26.Sener S., Akganlu F., “MRI characteristics of anterior disc displacement with and without reduction,” Dentomaxillofac. Radiol. 33(4), 245–52 (2004).http://dx.doi.org/10.1259/dmfr/17738454 [DOI] [PubMed] [Google Scholar]
- 27.dos Anjos Pontual M. L., et al. , “Evaluation of bone changes in the temporomandibular joint using cone beam CT,” Dentomaxillofac. Radiol. 41(1), 24–9 (2012).http://dx.doi.org/10.1259/dmfr/17815139 [DOI] [PMC free article] [PubMed] [Google Scholar]
- 28.Paniagua B., et al. , “Clinical application of SPHARM-PDM to quantify temporomandibular joint osteoarthritis,” Comp. Med. Imaging Graph. 35, 345–52 (2011).http://dx.doi.org/10.1016/j.compmedimag.2010.11.012 [DOI] [PMC free article] [PubMed] [Google Scholar]
- 29.Itksnap.org. “Penn Image Computing and Science Laboratory,” University of Pennsylvania, Philadelphia, 17 April 2013, http://www.itksnap.org (15 October 2013). [Google Scholar]
- 30.Schilling J., et al. , “Regional 3D superimposition to assess temporomandibular joint condylar morphology,” Dentomaxillofac. Radiol. 43(1), 20130273.http://dx.doi.org/10.1259/dmfr.20130273.(2014). [DOI] [PMC free article] [PubMed] [Google Scholar]
- 31.Neuroimaging Informatics Tools and Resources Clearinghouse (NITRC.org) “Projects Spharm-PDM,” Neuro Image Research and Analysis Laboratories, University of North Carolina, Chapel Hill, 21 July 2013, http://www.NITRC.org (22 July 2013).www.nitrc.org/projects/spharm-pdm. [Google Scholar]
- 32.Slicer.org, “Surgical Planning Laboratory,” Harvard Medical School, Boston, http://slicer.org (01 September 2014). [Google Scholar]
- 33.Neuroimaging Informatics Tools and Resources Clearinghouse (NITRC.org) “Projects shape analysis Mancova,” Neuro Image Research and Analysis Laboratories, University of North Carolina, Chapel Hill, 27 June 2013, http://www.NITRC.org (15 October 2013). [Google Scholar]
- 34.Wei S., “Latent Supervised Learning and DiProPerm,” The University of North Carolina, Chapel Hill: (2014). [Google Scholar]
- 35.Qiao X., et al. , “Weighted distance weighted discrimination and its asymptotic properties,” J. Am. Stat. Assoc. 105(489), 401–414 (2010).http://dx.doi.org/10.1198/jasa.2010.tm08487 [DOI] [PMC free article] [PubMed] [Google Scholar]
- 36.Johnston J. D., et al. , “In vivo precision of a depth-specific topographic mapping technique in the CT analysis of osteoarthritic and normal proximal tibial subchondral bone density,” Skeletal Radiol. 40(8), 1057–64 (2011).http://dx.doi.org/10.1007/s00256-010-1001-6 [DOI] [PubMed] [Google Scholar]
- 37.Langs G., et al. , “Automatic quantification of joint space narrowing and erosions in rheumatoid arthritis,” IEEE Trans. Med. Imaging 28(1), 151–64 (2009).http://dx.doi.org/10.1109/TMI.2008.2004401 [DOI] [PubMed] [Google Scholar]
- 38.Radin E. L., Rose R. M., “Role of subchondral bone in the initiation and progression of cartilage damage,” Clin. Orthop. Relat. Res. (213), 34–40 (1986). [PubMed] [Google Scholar]
- 39.Schneider E., et al. , “Magnetic resonance imaging evaluation of weight-bearing subchondral trabecular bone in the knee,” Skeletal Radiol. 40(1), 95–103 (2011).http://dx.doi.org/10.1007/s00256-010-0943-z [DOI] [PMC free article] [PubMed] [Google Scholar]
- 40.Kurita H., et al. , “Resorption of the lateral pole of the mandibular condyle in temporomandibular disc displacement,” Dentomaxillofac. Radiol. 30(2), 88–91 (2001).http://dx.doi.org/10.1038/sj.dmfr.4600578 [DOI] [PubMed] [Google Scholar]
- 41.Kurita H., et al. , “Relationship between alteration of horizontal size and bony morphological change in the mandibular condyle,” Dentomaxillofac. Radiol. 32(6), 355–8 (2003).http://dx.doi.org/10.1259/dmfr/70038602 [DOI] [PubMed] [Google Scholar]
- 42.Cortes D., et al. , “Association between disk position and degenerative bone changes of the temporomandibular joints: an imaging study in subjects with TMD,” Cranio. 29(2), 117–26 (2011). [DOI] [PubMed] [Google Scholar]
- 43.Arvidsson L. Z., et al. , “Temporomandibular joint findings in adults with long-standing juvenile idiopathic arthritis: CT and MR imaging assessment,” Radiology 256(1), 191–200 (2010).http://dx.doi.org/10.1148/radiol.10091810 [DOI] [PubMed] [Google Scholar]
- 44.Talaat W., Al Bayatti S., Al Kawas S., “CBCT analysis of bony changes associated with temporomandibular disorders,” Cranio. (2015).http://dx.doi.org/2151090315Y0000000002 [DOI] [PubMed] [Google Scholar]
- 45.Kim J. H., et al. , “Effectiveness of bone scans in the diagnosis of osteoarthritis of the temporomandibular joint,” Dentomaxillofac. Radiol. 41(3), 224–9 (2012).http://dx.doi.org/10.1259/dmfr/83814366 [DOI] [PMC free article] [PubMed] [Google Scholar]
- 46.Lamot U., Strojan P., Popovic K. S., “Magnetic resonance imaging of temporomandibular joint dysfunction-correlation with clinical symptoms, age, and gender,” Oral Surg. Oral Med. Oral Pathol. Oral Radiol. 116(2), 258–63 (2013).http://dx.doi.org/10.1016/j.oooo.2013.04.019 [DOI] [PubMed] [Google Scholar]
- 47.Oliveira J. X., et al. , “Assessing joint effusion and bone changes of the head of the mandible in MR images of symptomatic patients,” Braz. Oral Res. 27(1), 37–41 (2013).http://dx.doi.org/10.1590/S1806-83242012005000028 [DOI] [PubMed] [Google Scholar]
- 48.Schmitter M., et al. , “Prevalence of clinical and radiographic signs of osteoarthrosis of the temporomandibular joint in an older persons community,” Dentomaxillofac. Radiol. 39(4), 231–4 (2010).http://dx.doi.org/10.1259/dmfr/16270943 [DOI] [PMC free article] [PubMed] [Google Scholar]
- 49.Sano T., et al. , “Osteoarthritis and abnormal bone marrow of the mandibular condyle,” Oral Surg. Oral Med. Oral Pathol. Oral Radiol. Endod. 87(2), 243–52 (1999).http://dx.doi.org/10.1016/S1079-2104(99)70280-5 [DOI] [PubMed] [Google Scholar]
- 50.Rousseau J., Garnero P., “Biological markers in osteoarthritis,” Bone 51(2), 265–277 (2012).http://dx.doi.org/10.1016/j.bone.2012.04.001 [DOI] [PubMed] [Google Scholar]
- 51.van Spil W. E., et al. , “Clusters within a wide spectrum of biochemical markers for osteoarthritis: data from CHECK, a large cohort of individuals with very early symptomatic osteoarthritis,” Osteoarthritis Cartilage 20(7), 745–54 (2012).http://dx.doi.org/10.1016/j.joca.2012.04.004 [DOI] [PubMed] [Google Scholar]
- 52.Stone L. S., “Joint degeneration and chronic pain: still looking for the missing link,” Pain 141(3), 185–6 (2009).http://dx.doi.org/10.1016/j.pain.2008.12.001 [DOI] [PubMed] [Google Scholar]
- 53.Yajima A., et al. , “MR evidence of characteristics in symptomatic osteoarthritis of the temporomandibular joint: increased signal intensity ratio on proton density-weighted images of bone marrow in the mandibular condyle,” Cranio. 25(4), 250–6 (2007). [DOI] [PubMed] [Google Scholar]
- 54.Emshoff R., et al. , “Relative odds of temporomandibular joint pain as a function of magnetic resonance imaging findings of internal derangement, osteoarthrosis, effusion, and bone marrow edema,” Oral Surg. Oral Med. Oral Pathol. Oral Radiol. Endod. 95(4), 437–45 (2003).http://dx.doi.org/10.1067/moe.2003.95 [DOI] [PubMed] [Google Scholar]
- 55.Marguelles-Bonnet R. E., et al. , “Clinical diagnosis compared with findings of magnetic resonance imaging in 242 patients with internal derangement of the TMJ,” J. Orofac. Pain 9(3), 244–53 (1995). [PubMed] [Google Scholar]
- 56.Emshoff R., et al. , “Relationship between temporomandibular joint pain and magnetic resonance imaging findings of internal derangement,” Int. J. Oral Maxillofac. Surg. 30(2), 118–22 (2001).http://dx.doi.org/10.1054/ijom.2000.0028 [DOI] [PubMed] [Google Scholar]
- 57.Wiese M., et al. , “Association between temporomandibular joint symptoms, signs, and clinical diagnosis using the RDC/TMD and radiographic findings in temporomandibular joint tomograms,” J. Orofac. Pain 22(3), 239–51 (2008). [PubMed] [Google Scholar]
- 58.Kopp S., Rockler B., “Relationship between clinical and radiographic findings in patients with mandibular pain or dysfunction,” Acta Radiol. Diagn. 20(3), 465–77 (1979). [DOI] [PubMed] [Google Scholar]
- 59.Hansson L. G., Hansson T., Petersson A., “A comparison between clinical and radiologic findings in 259 temporomandibular joint patients,” J. Prosthet. Dent. 50(1), 89–94 (1983).http://dx.doi.org/10.1016/0022-3913(83)90172-5 [DOI] [PubMed] [Google Scholar]
- 60.Ohlmann B., et al. , “Prediction of TMJ arthralgia according to clinical diagnosis and MRI findings,” Int. J. Prosthodont. 19(4), 333–8 (2006). [PubMed] [Google Scholar]
- 61.Palconet G., et al. , “Correlating cone beam CT results with temporomandibular joint pain of osteoarthritic origin,” Dentomaxillofac. Radiol. 41(2), 126–30 (2012).http://dx.doi.org/10.1259/dmfr/60489374 [DOI] [PMC free article] [PubMed] [Google Scholar]
- 62.Loeser J. D., Treede R. D., “The Kyoto protocol of IASP basic pain terminology,” Pain 137(3), 473–477 (2008).http://dx.doi.org/10.1016/j.pain.2008.04.025 [DOI] [PubMed] [Google Scholar]
- 63.Jamison R. N., et al. , “Cognitive-behavioral classifications of chronic pain: replication and extension of empirically derived patient profiles,” Pain 57(3), 277–92 (1994).http://dx.doi.org/10.1016/0304-3959(94)90003-5 [DOI] [PubMed] [Google Scholar]
- 64.Dworkin S. F., LeResche L., “Research diagnostic criteria for temporomandibular disorders: review criteria, examinations and specifications, critique,” J. Craniomandib. Disord. 6(4), 301–355 (1992). [PubMed] [Google Scholar]
Associated Data
This section collects any data citations, data availability statements, or supplementary materials included in this article.