

In this study, Pfister et al. identified a new mutant p53 target gene, VEGFR2, and demonstrated that mutant p53 stimulates expression of VEGFR2 by cooperating with the SWI/SNF chromatin remodeling complex to superactivate the VEGFR2 gene. They also show that >50% of all mutant p53-regulated gene expression is mediated by SWI/SNF, providing insight into the observation that mutant p53 alters the expression of many genes.
Keywords: mutant p53, VEGFR2, SWI/SNF, chromatin, transcription, breast cancer, 3D culture
Abstract
Mutant p53 impacts the expression of numerous genes at the level of transcription to mediate oncogenesis. We identified vascular endothelial growth factor receptor 2 (VEGFR2), the primary functional VEGF receptor that mediates endothelial cell vascularization, as a mutant p53 transcriptional target in multiple breast cancer cell lines. Up-regulation of VEGFR2 mediates the role of mutant p53 in increasing cellular growth in two-dimensional (2D) and three-dimensional (3D) culture conditions. Mutant p53 binds near the VEGFR2 promoter transcriptional start site and plays a role in maintaining an open conformation at that location. Relatedly, mutant p53 interacts with the SWI/SNF complex, which is required for remodeling the VEGFR2 promoter. By both querying individual genes regulated by mutant p53 and performing RNA sequencing, the results indicate that >40% of all mutant p53-regulated gene expression is mediated by SWI/SNF. We surmise that mutant p53 impacts transcription of VEGFR2 as well as myriad other genes by promoter remodeling through interaction with and likely regulation of the SWI/SNF chromatin remodeling complex. Therefore, not only might mutant p53-expressing tumors be susceptible to anti VEGF therapies, impacting SWI/SNF tumor suppressor function in mutant p53 tumors may also have therapeutic potential.
TP53 is the most frequently mutated gene found in human cancers (Olivier et al. 2010). Wild-type p53 is a sequence-specific transcription factor that, when activated by various stresses such as DNA damage, oncogenic signaling, or nutrient depletion, promotes cellular outcomes such as cell arrest, cell death, senescence, metabolic changes, and others, depending on the extent and context of the stress (Vousden and Prives 2009). In human cancer, p53 primarily sustains missense mutations in its conserved DNA-binding domain. The small number of residues (approximately five to six) within this region that are mutated with extraordinarily high frequency are termed hot spot mutations. These mutations can be loosely divided into two categories: the contact mutants (e.g., R273H), which remain well folded, but whose mutated residues fail to make specific contact with elements within the DNA-binding site, and conformational mutants (e.g., R175H), which are partly unfolded, leading to loss of zinc coordination and general DNA binding. Evidence from sources as varied as human epidemiology studies, mouse models, and cell-based experiments has shown that these hot spot missense mutant forms of p53, which often accumulate to high levels in the cells that they inhabit, can produce outcomes such as increased metastases in mice and increased motility and invasive characteristics in cultured cells (Brosh and Rotter 2009; Muller and Vousden 2014). In Li-Fraumeni patients, missense mutation was reported to lead to earlier tumor onset than other forms of p53 loss (Bougeard et al. 2008). p53 hot spot mutant proteins have been reported to associate with chromatin and alter a cell's transcriptional profile, leading to oncogenic cellular changes (Di Agostino et al. 2006; Stambolsky et al. 2010; Do et al. 2012; Freed-Pastor et al. 2012; Cooks et al. 2013). Although a common view is that p53 hot spot mutants acquire neomorphic properties, many activities of mutant p53 are likely conserved from wild-type p53 and generate different cellular outcomes due to differences in their distribution within cellular chromatin.
When we reanalyzed the global gene expression analysis from a previous study (Freed-Pastor et al. 2012), vascular endothelial growth factor receptor 2 (VEGFR2/KDR/FLK1) was identified as a gene strongly induced by mutant p53. VEGFR2 is a receptor tyrosine kinase that is activated upon VEGF ligand binding and, under normal physiological conditions, mediates angiogenesis (Ferrara 2004). VEGFR2 is the key receptor for endothelial cell neovascularization and mediates increased cellular proliferation, migration, and prosurvival signaling (Ferrara 2004). In addition to the breast tumor vasculature, VEGFR2 is often aberrantly expressed on the breast tumor epithelia (Ryden et al. 2003). Increased VEGF or VEGFR2 expression on breast tumor cells correlates with decreased survival (Ghosh et al. 2008). The VEGFR2 ligand VEGF is the clinical target of anti-VEGF therapies, including bevacizumab, which in 2011 lost FDA approval for metastatic breast cancer, revocation of which may have been due to an inability to distinguish the candidates who would respond to treatment. Interestingly, wild-type p53 is a canonical repressor of the VEGF pathway through multiple mechanisms, including transcriptional repression of VEGFA (Mukhopadhyay et al. 1995) and MDM2-induced degradation of HIF1A (Ravi et al. 2000). Loss of wild-type p53 function promotes the angiogenic switch by derepressing HIF1A and VEGFA, thereby promoting tumor neovascularization (Ravi et al. 2000).
We additionally report that mutant p53 regulates the chromatin architecture of the VEGFR2 promoter by mediating nucleosomal displacement via cooperation with the SWI/SNF chromatin remodeling complex (CRC). The SWI/SNF complex associates genome-wide with transcription regulatory elements (Euskirchen et al. 2011), including those associated with wild-type p53 (Lee et al. 2002), to regulate nucleosome occupancy (Tolstorukov et al. 2013). This complex is composed of either BRG1 or BRM ATPase, a set of core proteins, and other context-specific components (Wilson and Roberts 2011). SWI/SNF complexes are subdivided into PBAF and BAF complexes based on the presence of BAF250A or BAF250B (BAF complex; contains either BRG1 or BRM ATPase) or BAF180 (PBAF complex; contains only BRG1 ATPase), although this distinction may not be absolute (Ryme et al. 2009; Wilson and Roberts 2011; Euskirchen et al. 2012). Importantly, inactivating mutations in several SWI/SNF components are found at high frequency in a variety of cancers, including breast cancer, implicating SWI/SNF in tumor suppression (Reisman et al. 2009; Wilson and Roberts 2011).
We hypothesize that mutant p53 co-opts SWI/SNF complex function to mediate its gain-of-function transcriptional effects. A model is proposed in which mutant p53 expression imparts transcriptional plasticity to a tumor that is mediated through interaction with the SWI/SNF CRC.
Results
Mutant p53 promotes VEGFR2 expression in breast cancer cell lines
Using a three-dimensional (3D) tissue culture system, global gene expression profiling was performed in MDA-468 breast cancer cells that contain a doxycycline-inducible shRNA to the 3′ untranslated region (UTR) of the p53 messenger RNA (MDA-468.shp53 cells) (Freed-Pastor et al. 2012). MDA-468 cells express only the R273H p53 hot spot mutant from the endogenous TP53 locus. Upon reanalysis of the gene expression profiling data sets from our earlier study, VEGFR2 was identified as the number eight overall most up-regulated gene by mutant p53 and in the top percentile of up-regulated genes (Supplemental Table S1). VEGFR2 was chosen for further study because it is a clinically important gene that is known to mediate tumor neovascularization and, in breast cancer cells, can mediate pro-oncogenic signaling through autocrine activation (Guo et al. 2010).
Using quantitative RT–PCR (qRT–PCR), we confirmed that VEGFR2 RNA levels are strongly correlated with mutant p53 protein levels in MDA-468.shp53 cells in 3D culture conditions (Fig. 1A). We also observed decreased VEGFR2 expression in two-dimensional (2D) culture conditions (Supplemental Fig. S1A), although to a lesser extent than was observed in 3D culture (75% depletion to 90% depletion of VEGFR2 transcript in 2D and 3D cultures, respectively). Mutant p53 regulated expression of VEGFR2 at the level of transcription, as we detected reduced expression of intronic VEGFR2 transcript to the same extent as total VEGFR2 RNA (Supplemental Fig. S1B). Stepwise depletion of mutant p53 led to increasing reductions in VEGFR2 levels (Supplemental Fig. S1C). Reduction of VEGFR2 RNA corresponded to depletion of VEGFR2 protein isoforms, which differ in migration pattern based on varying post-translational modifications (Fig. 1A; Supplemental Fig. S1A,C; Bruns et al. 2010). Mutant p53 regulated VEGFR2 in two additional breast cancer cell lines that express endogenous p53 hot spot mutants. Using MDA-231 cells (p53 R280K), we found that p53 depletion by two different siRNAs (Fig. 1B) or using doxycycline to induce p53 shRNA in MDA-231.shp53 cells (see Fig. 3B, below) resulted in significant reduction in VEGFR2. Depletion of mutant p53 by two different siRNAs in SK-BR-3 cells (p53 R175H) grown in 2D cultures also led to reduction in VEGFR2 transcript (Supplemental Fig. S1D). Thus, mutant p53 is a regulator of VEGFR2 expression in multiple breast cancer cell lines endogenously expressing both conformational and contact p53 hot spot mutations.
Figure 1.

Mutant p53 promotes VEGFR2 expression in breast cancer cells. (A) MDA-468.shp53 cells were grown in 3D culture conditions for 8 d with (+DOX) and without (−DOX) doxycycline to induce an shRNA targeting mutant p53. Total VEGFR2 transcript was assayed by qRT–PCR and normalized to the −DOX condition. (**) P < 0.001 by one-tailed t-test. Below is the related immunoblot showing levels of the indicated proteins. (B) MDA-231 cells were grown in 3D culture conditions and assayed for VEGFR2 expression following depletion of mutant p53 with two different siRNAs as described in the Materials and Methods. Expression was normalized to control siRNA. (*) P < 0.05; (**) P < 0.01 by one-tailed t-test. The immunoblot at right shows the indicated protein levels with control or p53 siRNAs. (C) MDA-468.shp53 cells were selected to stably express mutant p53 hot spot mutant R175H, R245S, or R248W that lacks the short hairpin sequence used target endogenous mutant p53 R273H. A control cell line containing empty vector or the cells expressing the indicated p53 hot spot mutants were grown in 3D culture in the presence of doxycycline to deplete the endogenous mutant p53 R273H. Total VEGFR2 messenger RNA was analyzed by qRT-PCR and normalized to the −DOX control condition. Corresponding immunoblot of p53 proteins with actin loading control is shown below. In A–C, error bars represent the standard error. In each experiment, at least three biological replicates were performed. Endogenous VEGFR2 was detected with anti-VEGFR2 antibody, and mutant p53 was identified with a mixture of mABs 1801 and DO-1. (D–F) The Cancer Genome Atlas (TCGA) breast cancer RNA sequencing (RNA-seq) version 2 data set analysis stratified by p53 mutational status (wild type, truncation mutation, hot spot missense mutation, or non-hot spot missense mutation as indicated). RNA expression of VEGFR2 (D), VEGFA (E), and HIF1A (F) is presented as a box plot, where the box contains the interquartile range. The central line represents the median gene expression. Median expression values are delineated for the truncation mutant category in D and the wild-type p53 category in E and F. RNA expression values were analyzed as upper quartile-normalized RNA-seq by expectation maximization (RSEM) of reads. (*) P < 0.05 by Welch's one-tailed t-test in D.
Figure 3.

Mutant p53 gain of function is mediated by VEGFR2 and may predict response to bevacizumab. (A) MDA-231.shp53 cells were engineered to express control vector, VEGFR2, or VEGFR2 tyrosine phosphorylation mutant Y1059F as described in the Materials and Methods and then grown in 3D culture conditions for up to 8 d. Where indicated, cells were grown in the presence of doxycycline (DOX; low Mut p53) to deplete endogenous mutant p53. Differential interference contrast images were acquired at 10× magnification on live imaging. Bar, 100 μm. (B) Immunoblot of the indicated proteins from A. (C) Relative cell areas of an average of at least 85 colonies per condition among four independent replicates were analyzed. Error bars represent the standard deviation. (*) P < 0.001 calculated by one-tailed t-test. (D) For wound migration analysis, MDA-231 cells were transfected with control siRNA and two independent siRNAs each to deplete mutant p53 or VEGFR2 and then seeded to confluency in tissue culture plates containing inserts. Representative differential interference contrast images (Supplemental Fig. 3A) were acquired immediately upon removal of the insert (0 h) and 48 h later. Relative migration was calculated by dividing the total distance migrated of each sample by the total migration in the siControl sample. At least three images were quantitated per sample. The data are an average of four biological replicates. Error bars represent the standard deviation. (*) P < 0.01; (**) P < 0.001 by two-sided t-test. (E,F) Response ratio showing reduction in tumor volume in TP53 wild-type tumors (E) and TP53 mutated tumors (F) treated with chemotherapy alone (Chemo) or chemotherapy plus bevacizumab (Chemo + Bev). Each data point represents one patient's response to the indicated treatment, which was calculated as the tumor volume of the residual tumor divided by the initial tumor volume. Data are plotted as a box plot, and the sample size is indicated by “n”. P-value was derived from Kruskal-Wallis test. Median values of the chemotherapy-only cohorts are delineated.
To determine whether different p53 hot spot mutants activate expression of VEGFR2, we engineered MDA-468.shp53 cells to express hot spot p53 mutants R175H, G245S, and R248W that lack the targeting region of the inducible p53 shRNA in these cells (Freed-Pastor et al. 2012). In this situation, endogenous p53 R273H was depleted upon addition of doxycycline, so the great majority of the remaining p53 isoforms in each cell was the respective ectopic hot spot mutant (Fig. 1C). We found that p53 R175H fully rescued and p53 G245S partially rescued the ability of the depleted endogenous mutant p53 to up-regulate VEGFR2 RNA expression as compared with untreated MDA-468.shp53 cells. In contrast, expression of p53 R248W, also a hot spot mutant, failed to increase VEGFR2 expression (Fig. 1C). With the caveat that these ectopically expressed proteins were overexpressed compared with the endogenous mutant p53, these data indicate that at least three different hot spot mutants can activate VEGFR2 expression, including a contact mutant (endogenous p53 R273H) and conformational mutants (p53 R175H and p53 G245S) in the MDA-468 cell line. These data also suggest that different p53 hot spot mutants possess intrinsically different capacities to activate VEGFR2 transcription.
Mutant p53 status correlates with increased levels of VEGF pathway components in human breast cancer samples
A fundamental question is whether mutant p53 impacts VEGFR2 expression in human breast tumors. To address this, we sorted the Breast Invasive Carcinoma TCGA (The Cancer Genome Atlas) provisional data set into p53 mutation classes, including wild type, hot spot missense mutation, non-hot spot missense mutation, and truncation mutation, which includes nonsense, frameshift, in-frame deletion, and in-frame insertion mutations that are predicted to alter wild-type p53 activities such as the ability to repress VEGF (Supplemental Table S2). To extend our query to other angiogenesis-related genes known to be affected by p53 status, we analyzed normalized RNA sequencing (RNA-seq) expression values for VEGFR2, VEGFA, and HIF1A. Five hot spot mutants of p53 observed in breast cancer (Walerych et al. 2012) were selected prior to analysis and are present in 49 out of 969 tumors in the data set (R175, Y220, G245, R248, and R273) (Supplemental Table S3). Comparing expression levels of VEGFR2 with tumors that contain truncation mutations in p53 showed that hot spot mutant tumors express significantly elevated levels of VEGFR2 (P < 0.05) (Fig. 1D). Note that wild-type p53 tumors also had higher levels of VEGFR2 than truncation or non-hot spot mutation-containing tumors. Importantly, all classes of inactivating p53 mutations (hot spot, non-hot spot missense, and truncation mutants) correlated with significantly increased levels of VEGFA and HIF1A (P < 0.05 in each case), which are potent proangiogenic factors that potentiate VEGFR2 activation (Fig. 1E,F; Ferrara 2004). This suggests that up-regulation of VEGFA and HIF1A is due to loss of repression by wild-type p53 rather than activation by mutant p53 (Fig. 1E,F). We speculate that hot spot mutant p53-containing breast tumors are unique in being able to regulate a pattern of proangiogenic gene expression that may preferentially potentiate VEGFR2 autocrine signaling compared with tumors with wild-type p53 or other forms of loss of p53 function.
Cell-autonomous VEGFR2 expression is sufficient to mediate mutant p53 gain of function
Mutant p53 has been reported to promote cell growth and invasiveness in 3D culture models of breast cancer (Muller et al. 2009; Freed-Pastor et al. 2012). To investigate whether VEGFR2 mediates downstream effects of mutant p53, including increased cellular growth and invasive characteristics, we pharmacologically inhibited VEGFR2 with semaxanib (SU5416), a potent inhibitor of VEGFR2 autophosphorylation with an IC50 of 1.23 μM (Fong et al. 1999). In 3D cultures, inhibition of VEGFR2 with semaxanib prevented growth of MDA-231 and MDA-468 breast cancer cells but not of MCF10A immortalized breast cells or MCF7 breast cancer cells that express wild-type p53 (Supplemental Fig. S2A–D). While this does not demonstrate that mutant p53-bearing cells are uniquely sensitive to semaxanib, it supports the findings below implicating VEGFR2 as being critical for growth of MDA-231 and MDA-468 cells.
To gain further evidence for a role for VEGFR2 in 3D culture cell growth, we depleted VEGFR2 with two different siRNAs. MDA-231 and MDA-468 cells were significantly inhibited in 3D growth upon depletion of VEGFR2 with siRNA, recapitulating the effect of depletion of mutant p53 (Fig. 2A,B; corresponding immunoblots in Supplemental Fig. S2E,F). The MDA-231 cells, which in 3D cultures form stellate-appearing clusters, had mostly lost their characteristic invasive-appearing processes (Fig. 2A; Kenny et al. 2007). These data indicate that, with respect to 3D culture gross morphology, loss of VEGFR2 phenocopies loss of mutant p53 and suggest that VEGFR2 is required for efficient growth of mutant p53-containing breast cancer cells. The data also suggest that cell-autonomous VEGFR2 signaling is required for cell growth in cell lines that contain mutant p53.
Figure 2.

VEGFR2 inhibition phenocopies loss of mutant p53. MDA-231 cells (A) and MDA-468 cells (B) were transfected with two independent siRNAs to deplete mutant p53 or VEGFR2 and then grown in 3D culture conditions for 8 d. Representative differential interference contrast images were acquired at 10× magnification on live imaging. Relative cell areas of an average of at least 95 colonies per condition for three independent replicates were calculated and are shown in the corresponding bar graphs. Error bars represent the standard deviation. Bar, 100 μm. (*) P < 0.01 by one-tailed t-test.
We then determined whether VEGFR2 expression can rescue loss of mutant p53 using MDA-231.shp53 cells expressing a doxycycline-inducible shRNA to p53 (Freed-Pastor et al. 2012) that were engineered to stably express VEGFR2 or a phosphorylation-defective VEGFR2 mutant (VEGFR2-Y1059F) (Jinnin et al. 2008). As expected, loss of mutant p53 led to a dramatic reduction in size of the invasive, stellate-shaped clusters of MDA-231.shp53 cells (Fig. 3A, top panels). Remarkably, when VEGFR2 was expressed in cells with reduced endogenous mutant p53, the growth properties and morphological characteristics of the cell clusters were restored (P < 0.001) (Fig. 3A–C). Furthermore, cells expressing phosphorylation-defective VEGFR2-Y1059F failed to rescue the loss of mutant p53, indicating that the rescue with VEGFR2 is due to pro-oncogenic signaling properties mediated by this receptor tyrosine kinase (Fig. 3A–C). Finally, to gain more information about oncogenic activities of mutant p53 or VEGFR2, we performed a wound closure assay in MDA-231 cells. Our data indicated that VEGFR2 and mutant p53 are each required for cellular migration (Fig. 3D; Supplemental Fig. S3A). Note that MDA-468 cells do not migrate efficiently and are not amenable to such measurements. These data implicate VEGFR2 as a proto-oncogene in breast cancer cells that, when transactivated by mutant p53, functions as an oncogene that can mediate certain mutant p53 oncogenic effects that are consistent with characteristic growth and invasive properties of tumor cells.
To determine whether mutant p53-expressing breast tumors preferentially respond to anti-VEGF therapy, we analyzed the response in tumors with wild-type TP53 versus mutated TP53 from the NeoAva study (Fig. 3E,F; see the Materials and Methods for further description). Interestingly, across all patients, response ratios were higher in patients with TP53 mutated tumors (Supplemental Fig. S3B–D). Relevantly, among patients who received chemotherapy and bevacizumab, the pathological complete response (pCR) was 33.3% versus 17.1% in TP53 mutated versus wild-type tumors (Supplemental Fig. S3C). A higher pCR rate in TP53 mutated tumors compared with wild-type tumors (27.7% vs. 4.5%) was also observed among patients receiving chemotherapy alone, so a benefit of bevacizumab cannot be concluded based on pCR in this patient cohort (Supplemental Fig. S3C). When treatment response was analyzed as a continuous variable, however, a greater reduction in tumor volume was observed when bevacizumab was combined with chemotherapy in TP53 mutated tumors but not in tumors with wild-type TP53 (Fig. 3E,F). The P-value of this observation, P = 0.28, suggests that a larger sample size is necessary to confirm a therapeutic effect of bevacizumab on p53 mutated breast tumors. Nevertheless, these data suggest that, as predicted by the cell culture data, inclusion of anti-VEGF therapy in p53 mutated breast tumors might lead to enhanced anti-tumor response.
Mutant p53 mediates chromatin remodeling at the VEGFR2 promoter
Because VEGFR2 expression was one of the genes most strongly activated by mutant p53 in MDA-468.shp53 cells, we sought to define how mutant p53 regulates the VEGFR2 promoter using this clonal cell line. We used quantitative promoter scanning chromatin immunoprecipitation (ChIP) along 4 kb of the VEGFR2 promoter using nine primer sets. Mutant p53 was associated with the VEGFR2 promoter, with peak binding at the proximal promoter (primer set 150 base pairs [bp]) (Fig. 4A). Peak binding was approximately fivefold higher than background levels (normalized to percent input) at the −150 site and threefold above the lowest mutant p53 signal, located at the −2350 site (Fig. 4A). The binding signal was specific in that it was consistently significantly decreased when mutant p53 was depleted (Fig. 4A; Supplemental Fig. S4A–C). Mutant p53 could be detected along at least 1.5 kb of the VEGFR2 promoter even though peak binding was in the vicinity of the transcriptional start site (TSS). This broad binding pattern is consistent with the view that mutant p53 is not likely to bind to a specific DNA sequence (Kim and Deppert 2007). Rather, the mutant p53-binding distribution observed is consistent with a more diffuse association with the proximal VEGFR2 promoter, a region predicted to be associated with a complex array of transcription factors, chromatin regulators, transcriptional machinery, nucleosomes, and other factors.
Figure 4.

Mutant p53 associates with the VEGFR2 promoter and leads to promoter remodeling. MDA-468.shp53 cells were cultured for 8 d in 3D culture in the presence (−Mut p53; black) and absence (+Mut p53; red) of doxycycline (DOX). Cells were treated with formaldehyde to cross-link chromatin and subjected to the indicated procedures. (A) Scanning ChIP for mutant p53 was performed along 4 kb surrounding the VEGFR2 TSS. ChIP was performed in the presence and absence of doxycycline for mutant p53 and also in the absence of antibodies to p53 using primers corresponding to the indicated data points. Immunoprecipitated chromatin was subjected to qPCR, and the percent input-normalized signal between −DOX and +DOX samples was plotted relative to the peak binding signal at the −150-bp VEGFR2 site. Error bars represent the standard error of the three independent experiments shown in Supplemental Figure S4A–C. (B) For micrococcal nuclease (MNase), PCR chromatin was digested with MNase, and mononucleosome-sized DNA fragments were isolated. qPCR was performed for six amplicons averaging 66 bp along 446 bp of the VEGFR2 promoter from −390 bp to +56 bp relative to the TSS, with the signal normalized to amplicon 1. Error bars represent the standard error of three independent experiments. (*) P < 0.05 by one-tailed t-test. (C) In vivo DNase I footprinting by ligation-mediated PCR (LM-PCR) was performed at the VEGFR2 promoter between approximately −160 bp and +5 bp of the TSS. Densitometry analysis of the relative DNase I hypersensitivity signal is represented by a histogram ([red] +Mut p53; [black] −Mut p53).
As wild-type p53 mediates gene expression changes through complex interaction with multiple chromatin regulators (Laptenko and Prives 2006), many of which are known mutant p53-binding partners (Freed-Pastor and Prives 2012), and because wild-type p53 binding to DNA leads to nucleosome displacement in vivo (Lidor Nili et al. 2010; Laptenko et al. 2011), we sought to characterize mutant p53-dependent changes in chromatin architecture. The VEGFR2 promoter is a GC-rich, TATA-less promoter that is tightly regulated and under tissue-specific control (Patterson et al. 1997). We postulated that mutant p53 could either mediate a step preceding promoter activation in which mutant p53 would initiate or facilitate changes in chromatin architecture (such as by promoting nucleosomal displacement) or be recruited to active promoters and augment transcription subsequent to and without affecting promoter remodeling.
To distinguish between these two possibilities, we characterized the chromatin architecture of the VEGFR2 promoter using micrococcal nuclease (MNase) digestion followed by promoter-scanning qPCR (MNase-PCR). MNase eliminates DNA that is not allosterically protected from digestion by association with DNA-binding proteins and, specifically, core nucleosomes (Noll and Kornberg 1977). MNase-PCR primers were designed to span the VEGFR2 promoter from −390 bp to +56 bp relative to the TSS, with an average amplicon length of 66 bp and an average overlap of 2.5 bp (Supplemental Table S4). Unfortunately, primers could not be developed for the region defined by amplicon 5, spanning 63 bp between amplicons 4 and 6, as this region has high GC content and homology with other genomic regions. The average amplicon was 66 bp, so each amplicon is less than half the length of DNA associated with a core nucleosome (which coordinates 147 bp of DNA). Thus, observed changes were much more defined than they would be by ChIP that typically has resolution of ∼300–500 bp (Laptenko et al. 2011). Using cross-linked chromatin, MNase digestion was performed on isolated nuclear fractions with full or reduced expression of mutant p53. MNase-treated chromatin were separated via agarose gel electrophoresis, and mononucleosomal length (∼147 bp) DNA was excised, purified, and PCR-amplified using the described MNase primer sets (Fig. 4B). Indeed, in the presence of mutant p53, there was increased chromatin digestion by MNase that was localized to the proximal promoter region between amplicons 3 and 6, corresponding to −261 bp to −10 bp from the TSS, but not amplicons 1, 2, or 7 that correspond to flanking regions, suggestive of a relaxed, transcriptionally permissible, open chromatin state in the region where mutant p53 was localized (Fig. 4B). Note that amplicon 4, where the greatest difference in nucleosome occupancy between full and reduced levels of mutant p53 was observed (∼30%), uses the same primer set as the −150-bp site where peak mutant p53 binding was observed in Figure 4A. This is likely an underestimate because not all VEGFR2 promoters in a pool of cells are expected to be engaged at the same time by mutant p53. Because depletion of mutant p53 led to localized resistance to MNase digestion, these data signify that mutant p53 is associated with remodeled chromatin at the proximal VEGFR2 promoter, and loss of mutant p53 leads to promoter closure (Fig. 4B), consistent with the dramatic decrease in VEGFR2 expression (Fig. 1A).
To confirm and extend these observations with an independent enzymatic technique, in vivo DNase I footprinting by LM-PCR was used. This technique provides a direct visualization of virtually each nucleotide in the genomic DNA region being queried. Increased DNase I cleavage (termed hypersensitivity) is a hallmark of active genes, corresponding to an open promoter configuration (for review, see Krebs and Peterson 2000), and is a feature of wild-type p53 target genes, including p21 (CDKN1A) (Braastad et al. 2003), for which it is known that the area surrounding the p53 response element undergoes nucleosomal remodeling subsequent to p53 recruitment (Laptenko et al. 2011). In the presence and absence of mutant p53, cross-linked chromatin was subjected to DNase I digestion. Increased DNase I hypersensitivity was detected at the proximal promoter between nucleotides −160 bp and +5 bp, corresponding to MNase amplicon 6 as well as the area that would theoretically be amplified by MNase primer set 5, in the presence of mutant p53 (Fig. 4C, red). There were no detectable changes in DNase I hypersensitivity downstream from the TSS using a separate set of nested primers corresponding to VEGFR2 exon 1 (Supplemental Fig. S4D). Since, as mentioned above, mutant p53 is unlikely to bind directly to DNA within the VEGFR2 proximal promoter in a sequence-dependent manner and instead displays a rather wide region of interaction, it is not surprising that the in vivo DNase I footprint region is also quite broad. These experiments reveal that mutant p53 mediates promoter remodeling at the VEGFR2 promoter and is required to sustain an open chromatin conformation.
Mutant p53 interacts with the SWI/SNF CRC
In order to screen for the protein partners that may cooperate with mutant p53 to mediate changes in chromatin architecture, SILAC-based mass spectrometry was performed using an inducible p53 R282W hot spot mutant that was available in the p53-null H1299 cell line. In this screen, some subunits of the SWI/SNF CRC were identified as mutant p53 interactors; namely, BAF53A (ACTL6A) and a peptide mapping to the ATPase subunits BRG1 and BRM (Supplemental Table S5). No components of other transcriptional machinery were identified in this screen. This is relevant to our study for a number of reasons: First, the SWI/SNF CRC is a well-characterized ATP-dependent nucleosomal remodeler. Second, multiple components of the SWI/SNF complex have been identified as wild-type p53-binding partners, including INI1 and BRG1 (Lee et al. 2002; Naidu et al. 2009), BAF60A and BAF155 (Oh et al. 2008), ARID1A (Guan et al. 2011), and BRD7 (Burrows et al. 2010). Third, TP53 and SWI/SNF mutations have a tendency toward mutual exclusivity in cancers, suggestive of a shared mechanism (Kadoch et al. 2013). Fourth, mutant p53 has many overlapping interacting partners with SWI/SNF components (Supplemental Table S6). Finally, mutant p53 and wild-type p53 often mediate opposing effects on their interacting partners, so, in theory, mutant p53 could dysregulate normal SWI/SNF complex function that wild-type p53 requires for transcriptional activities (Lee et al. 2002; Xu et al. 2007) by affecting its activity, interaction with other proteins, or chromosomal location.
Using immunoprecipitation experiments, we were able to coimmunoprecipitate SWI/SNF components with mutant p53 in several cell lines (Fig. 5; Supplemental Fig. S5). SWI/SNF core subunit BAF53A was coimmunoprecipitated with p53 R273H in MDA-468 cells and p53 R175H in SK-BR-3 cells (Fig. 5A,B, respectively). SWI/SNF core subunit BAF155 was coimmunoprecipitated with p53 R273H in MDA-468 cells and p53 R280K in MDA-231 cells (Supplemental Fig. S5A,B, respectively). Reciprocal immunoprecipitation was performed for BAF155, which coimmunoprecipitated mutant p53 in MDA-468 and MDA-231 cells (Fig. 5C,D, respectively). Additionally, BRG1 and BAF170 were coimmunoprecipitated with p53 R273H in HT29 cells (Supplemental Fig. S5C). Hence, mutant p53 associates with multiple SWI/SNF subunits, including core components BAF155, BAF170, and BAF53A (present in both BAF and PBAF SWI/SNF complexes) as well as core ATPases BRG1 (present in PBAF and BAF complex subclasses) and BRM (present in BAF complex subclasses) (Euskirchen et al. 2012). While, at this point, we cannot conclude that their interaction is direct, the fact that multiple SWI/SNF subunits were coimmunoprecipitated with mutant p53 suggests that their association is significant and functional, which is supported by the results described below.
Figure 5.

Mutant p53 is found in protein complexes with members of the SWI/SNF CRC at the VEGFR2 promoter. Extracts of MDA-468 (A,C), SK-BR-3 (B), or MDA-231 (D) cells were subjected to immunoprecipitation (IP) with anti-p53 antibodies (mAb DO-1; A,B) or anti-BAF155 antibody (C,D) followed by immunoblotting (IB) with anti-p53 (mAbs DO-1 [A,B] or DO-1 and 1801 [C,D]), anti-BAF53A (A,B), or anti-BAF155 (C,D) antibodies. Inputs represent 5% (A,B,D) or 3.3% (C) of total extract. (E) ChIP–re-ChIP (sequential ChIP) was performed in MDA-468.shp53 cells by performing initial ChIP for IgG or mutant p53 followed by re-ChIP with BAF170 or IgG antibodies. qPCR was performed at the VEGFR2 promoter at site −150 bp from the TSS. Signal is shown as percent of input material. Error bars represent the standard error of two independent experiments. (F–H) Immunodepletion ChIP was performed in MDA-468.shp53 by immunoprecipitating cross-linked cell extract with IgG or anti-p53 mAbs (DO-1/1801/PAb421). ChIP was then performed on the immunodepleted extracts with antibodies to BAF170 (F) or BAF155 (G). qRT–PCR was performed at the VEGFR2 promoter as in E. Signal is shown as fold signal over ChIP for IgG. Error bars represent the standard error of two independent experiments. (H) The immunoblot for mutant p53 with histone 2A as a loading control corresponds to F and G.
The SWI/SNF CRC mediates nucleosome occupancy of the VEGFR2 promoter and is required for optimal mutant p53-associated VEGFR2 expression
As mutant p53 association with the VEGFR2 promoter mediated promoter remodeling, and mutant p53 interacted with the SWI/SNF CRC, it is plausible that the SWI/SNF complex facilitates remodeling of the VEGFR2 promoter via nucleosomal repositioning. We first determined that mutant p53 and the SWI/SNF complex coexist at the VEGFR2 promoter. Two techniques were used to ascertain their co-occupation of this region: sequential ChIP (re-ChIP) and immunodepletion ChIP (ID-ChIP) using MDA-468.shp53 cells. Schematics for these procedures are depicted in Supplemental Figure S5, D and E. For the re-ChIP, the first immunoprecipitation was performed with IgG control or anti-p53 antibodies. The pellet was washed, eluted, and diluted for a second immunoprecipitation with anti-BAF170 or IgG control antibodies. We found that ChIP-p53–ChIP-BAF170 was significantly elevated over ChIP-p53–ChIP-IgG and ChIP-IgG–ChIP-IgG signals, formally demonstrating that core SWI/SNF subunit BAF170 and mutant p53 colocalize at the VEGFR2 promoter (Fig. 5E). For the ID-ChIP, lysates were immunodepleted with IgG control antibodies or p53 monoclonal antibodies to remove chromatin-bound p53 (see Supplemental Fig. S5E). Mutant p53 immunodepletion was confirmed in total cell extract (Fig. 5H) and at the VEGFR2 locus (Supplemental Fig. S5F). Each lysate was then immunoprecipitated with anti-BAF155, anti-BAF170, or IgG control antibodies. BAF155 and BAF170 were chosen because they are core SWI/SNF subunits for which ChIP-grade antibodies are available (Euskirchen et al. 2011). Both anti-BAF170 (Fig. 5F) and anti-BAF155 (Fig. 5G) signals were significantly reduced in the mutant p53 chromatin-depleted samples, confirming that mutant p53 and BAF155 and mutant p53 and BAF170 are simultaneously present at the VEGFR2 proximal promoter (−150-bp site). We next queried whether mutant p53 recruits the SWI/SNF complex to the VEGFR2 promoter. Using quantitative ChIP (qChIP) to determine the abundance of SWI/SNF core components BAF170 and BAF155 at the proximal (−150-bp site) and distal (−2350-bp site) VEGFR2 promoters, corresponding to high and low mutant p53 sites, we found that BAF155 and BAF170 were enriched at the proximal promoter relative to the distal promoter (Fig. 6A,B). Supplemental Figure S6A shows that mutant p53 signal was depleted at the −150-bp site in the experimental conditions. Since BAF155 and BAF170 signals did not change when mutant p53 was depleted, this indicated that mutant p53 does not affect the recruitment of the SWI/SNF complex to the VEGFR2 promoter (Fig. 6A–C; Supplemental Fig. S6A). Three additional intragenic sites as well as one site 30 kb downstream from the 3′ UTR were also analyzed, as the SWI/SNF complex has been shown to affect transcriptional efficiency by assisting with the RNA polymerase complex, but, again, no change was observed in the presence or absence of mutant p53 (Fig. 6A,B; Supplemental Fig. S6A).
Figure 6.

SWI/SNF is required for maximal VEGFR2 expression, nucleosomal remodeling, and expression of other mutant p53-dependent genes. (A,B) MDA-468.shp53 cells were grown for 5 d in 2D cell culture in the presence (−Mut p53; black) and absence (+Mut p53; red) of doxycycline (DOX) and then treated with formaldehyde and prepared for scanning ChIP to detect occupancy of BAF155 (A) or BAF170 (B). IgG was used as a control in either case. Immunoprecipitated chromatin was subjected to qRT–PCR using primers that spanned the length of the VEGFR2 gene (from −2.35 kb to +30 kb downstream from the coding and the 3′ UTR). The percent input-normalized signal between −DOX and +DOX samples was plotted relative to the peak binding signal at the −150-bp VEGFR2 site. Error bars represent the standard error of three independent experiments. (C) Immunoblot of the indicated proteins in A and B. (D) ChIP for mutant p53 in MDA-468.shp53 cells grown in 2D culture was performed in the presence and absence of BRG1 and BRM. Negative site corresponds to +30 kb downstream from the VEGFR2 3′ UTR. (**) P < 0.01 by one-tailed t-test. (E) MNase-assisted ChIP was performed on MDA-468.shp53 cells grown in 2D culture with control siRNA or siRNA to BAF170. Cells were fixed with formaldehyde, nuclei were extracted and incubated with micrococcal nuclease, ChIP was performed using antibodies to histone H3 and IgG, and immunoprecipitated mononucleosomal-sized DNA was purified by agarose gel electrophoresis. qRT–PCR was performed using MNase-PCR primers at the proximal promoter (−78 to −10 bp from the TSS; amplicon 6 [red]) and normalized to the distal promoter (−390 bp to −330 bp from the TSS; amplicon 1 [blue]). Error bars represent the standard error of three independent experiments. (F–I) MDA-468.shp53 cells grown in 2D culture were transfected with two independent siRNAs (20 nM) to deplete BRM (F), BRG1 (G), BAF155 (H) , or BAF170 (I). Total VEGFR2 transcript was assayed by qRT–PCR and normalized to control siRNA (Ctrl). Error bars represent the standard error of three independent experiments. Corresponding immunoblots are shown in Supplemental Figure S6D. (J–N) MDA-468.shp53 cells grown in 2D culture were transfected with a mixture of 50 nM siRNA to codeplete BRM and BRG1 or with control siRNA (Ctrl). VEGFR2 protein (J) and RNA (K) are shown. Three other mutant p53 transcriptional targets—IGFBP5 (L), ceruloplasmin (M), and mammaglobin-A (N)—were also assayed by qRT–PCR and normalized to RPL32 internal control. Error bars represent the standard error of three independent experiments. (*) P < 0.05; (**) P < 0.01 by two-tailed t-test.
Since SWI/SNF localization to the VEGFR2 promoter was unaffected by mutant p53, we considered the reciprocal possibility that SWI/SNF recruits mutant p53 to the VEGFR2 promoter to cooperate in initiation of promoter remodeling. As we found a greater impact of depletion of BRG1 and BRM together on VEGFR2 expression than of siRNA-mediated reduction of either alone (see below), the two SWI/SNF ATPase components were codepleted for this experiment. In fact, co-reduction of BRG1 and BRM significantly reduced occupancy of mutant p53 at its peak binding region in the VEGFR2 promoter (at −150 bp; P < 0.01) (Fig. 6D), while mutant p53 binding to a control site 30 kb downstream from the 3′ UTR was not significantly affected (Fig. 6D). The decrease in mutant p53 binding with SWI/SNF knockdown (∼30%) should be contextualized by comparison with the maximal reduction of mutant p53 observed at the same −150-bp site when mutant p53 was depleted with shRNA (∼30% to ∼50%) (cf. Figs. 6D and 4A; Supplemental Figs. S4A–C, S6A). Since mutant p53 levels were unchanged upon BRG1 and BRM codepletion (Fig. 6J; Supplemental Fig. S7A), the reduction of mutant p53 presence at the VEGFR2 promoter was due to the reduced presence of the SWI/SNF complex.
To formally demonstrate that the SWI/SNF CRC mediates nucleosomal displacement at the VEGFR2 promoter, we performed MNase digestion followed by ChIP for histone H3, a core nucleosomal protein. BAF170 was chosen for depletion because it is a core SWI/SNF subunit, present in both BRG1- and BRM-containing SWI/SNF complexes (Euskirchen et al. 2012). Upon BAF170 depletion, there was a significant increase in histone H3 occupancy at the VEGFR2 proximal promoter (MNase amplicon 6; −78 to −10 bp) relative to the distal control site (MNase amplicon 1; −390 to −330 bp), while no significant change between these sites in the control sample was detected (Fig. 6E). Because depletion of a core SWI/SNF component resulted in increased nucleosome density at the VEGFR2 promoter and decreased VEGFR2 expression, we conclude that the SWI/SNF complex is required to sustain an open promoter conformation at a mutant p53 target gene.
The SWI/SNF CRC is required to activate multiple mutant p53-dependent genes
We hypothesized that mutant p53 enhances expression of additional genes that are also regulated by SWI/SNF complexes. We first determined whether VEGFR2 expression requires SWI/SNF activity by using an RNAi approach to deplete multiple SWI/SNF components, including the BRM and BRG1 ATPases, only one of which is present per SWI/SNF complex (BRG1-containing or BRM-containing), and BAF155 and BAF170, which are components of all SWI/SNF complexes (Euskirchen et al. 2012). Upon depletion of all four of these SWI/SNF components, we observed significant reduction in VEGFR2 RNA expression (Fig. 6F–I). Interestingly, both BRM (Fig. 6F) and BRG1 (Fig. 6G) independently reduced VEGFR2 levels, implying that both BRG1- and BRM-containing SWI/SNF complexes mediate VEGFR2 expression (suggesting that mutant p53 may cooperate with both PBAF and BAF complexes). We next determined whether codepletion of BRG1 and BRM resulted in greater depletion of VEGFR2 levels than depletion of either component individually. Compared with individual depletion of BRG1 or BRM, codepletion resulted in even more dramatic reduction in VEGFR2 levels of up to 60% (Fig. 6J,K). Note that, in these 2D culture conditions, for which we observed ∼75% depletion of VEGFR2 transcript on mutant p53 knockdown (Supplemental Fig. S1A), there may exist residual mutant p53-dependent transcriptional activation. This difference may be due to a residual SWI/SNF complex, retained open promoter conformation, or unidentified factors. Because SWI/SNF recruits mutant p53 and because mutant p53 and SWI/SNF are both required to sustain VEGFR2 promoter conformation and gene expression, our data indicate that mutant p53 enhances SWI/SNF-dependent VEGFR2 expression.
We next sought to generalize the extent to which mutant p53 relies on SWI/SNF complex function to mediate its transcriptional activities. Using individual depletion of BRG1 or BRM, three of the top mutant p53 target genes from the global gene expression analysis were tested for impact of the SWI/SNF complex on their gene expression (Supplemental Table S1). Depletion of BRM (Supplemental Fig. S6B) and BRG1 (Supplemental Fig. S6C) caused a reduction in the expression of IGFBP5, ceruloplasmin (CP), and mammaglobin-A (SCGB2A2), which we verified as mutant p53 target genes (Supplemental Fig. S6E). Codepletion of both BRG1 and BRM led to greater reduction in the expression of these genes (Fig. 6L–N).
To extend our findings more globally, we performed RNA-seq on MDA-468 cells grown with siRNA to deplete mutant p53 (Mut p53 knockdown) or siRNAs to codeplete BRG1 and BRM (SWI/SNF knockdown). From a combined analysis of two biological replicates, 2470 genes were significantly up-regulated and 2177 were down-regulated upon mutant p53 depletion, while 3823 genes were significantly up-regulated and 3061 were down-regulated upon SWI/SNF depletion (Fig. 7A,B). There were 1086 genes that were co-up-regulated by depletion of SWI/SNF or mutant p53. In total, SWI/SNF can account for 43.97% of the genes (1086 out of 2470) endogenously repressed by mutant p53 (Fig. 7A,B). There were 883 genes that were co-down-regulated by depletion of SWI/SNF or mutant p53. In total, SWI/SNF can account for 40.56% of the genes (883 out of 2177) endogenously activated by mutant p53. When we compared the results of the BRG/BRM knockdown in this RNA-seq experiment with the array data set from our previous study (Freed-Pastor et al. 2012), we obtained very similar results such that 48.83% of the genes regulated by mutant p53 were also regulated by SWI/SNF (523 of 1071 mutant p53-regulated genes) (Supplemental Fig. S7B). We conclude that a common feature of numerous mutant p53-dependent genes is their requirement for SWI/SNF complex activity for maximal mutant p53-mediated expression. Mutant p53 likely mediates a substantial fraction of the genes that it activates by harnessing SWI/SNF CRC function to remodel promoters into transcriptionally active conformations.
Figure 7.
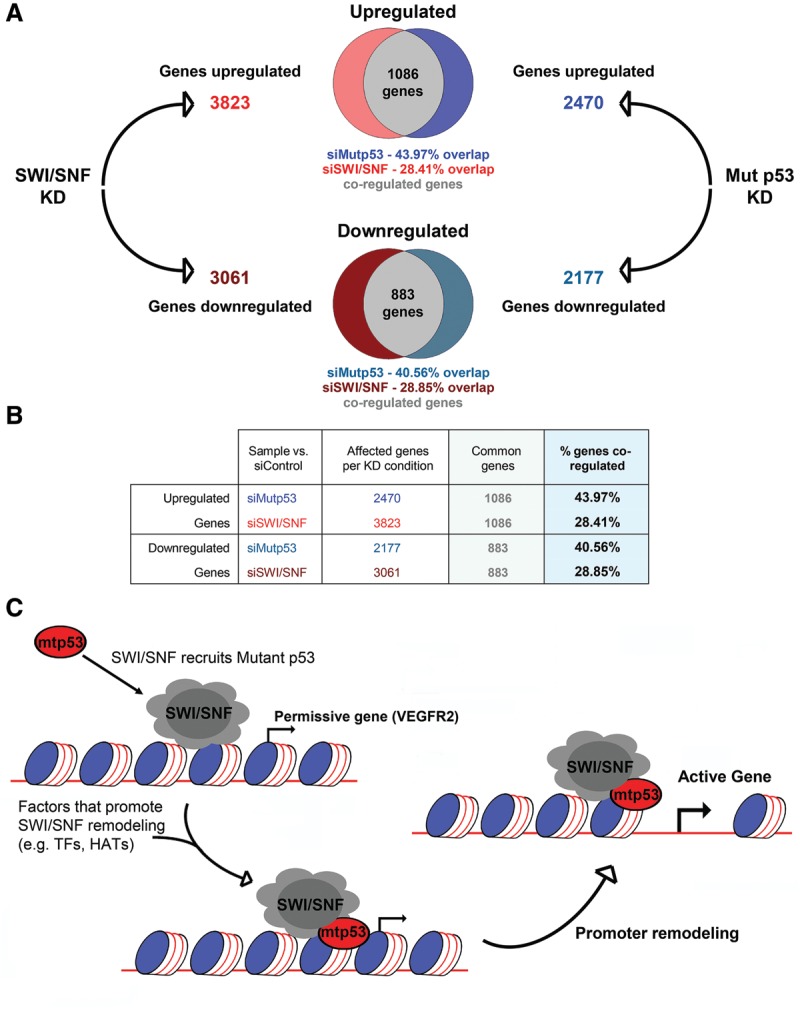
The SWI/SNF complex mediates mutant p53-dependent transcription at many mutant p53-responsive genes. (A) RNA-seq was performed on two independent replicates of MDA-468.shp53 cells grown for 4 d with either control siRNA, siRNA to deplete mutant p53 (Mut p53 knockdown), or siRNAs to codeplete BRG1 and BRM (SWI/SNF knockdown). The top affected genes compared with siControl, using a false discovery rate value <0.01, were analyzed. The total number of up-regulated and down-regulated genes for each knockdown condition are depicted. The numbers of co-up-regulated or co-down-regulated genes in both Mut p53 knockdown and SWI/SNF knockdown conditions are demonstrated by a Venn diagram. Immunoblots for both replicates are shown in Supplemental Figure S7A. (B) The table lists the number of coregulated genes (common genes) from the RNA-seq data. Percent of coregulated genes was calculated by dividing the number of coregulated genes by the number of genes affected in the knockdown condition. (C) Proposed model depicting how mutant p53 interacts with SWI/SNF at mutant p53-responsive genes to promote transcription. Mutant p53 is recruited by SWI/SNF to SWI/SNF-regulated genes. Mutant p53 recruits other transcription factors (TFs), histone acetyltransferases (HATs), or other chromatin modifiers that promote SWI/SNF-dependent promoter remodeling.
Discussion
We reported two aspects of mutant p53 function that could lead to clinical interventions: (1) Classifying breast tumors by p53 mutational status could improve response to anti-VEGF therapy due to the combined effect of inhibiting mutant p53-induced proproliferative VEGFR2 signaling compounded with antagonistic effects on tumor vasculature, and (2) targeting the SWI/SNF complex in mutant p53 tumors could impede mutant p53 transcriptional gain-of-function effects.
VEGFR2 is a candidate proto-oncogene (Ding et al. 2008) that is correlated with decreased survival in breast cancer patients (Ghosh et al. 2008). Here we identified VEGFR2 as a transcriptional target of mutant p53 in breast cancer cells. In human tumors, hot spot mutation in TP53 correlates with increased VEGFR2 expression and elevated HIF1A and VEGFA levels, which are repressed in tumors with wild-type p53 (Fig. 1D–F). Wild-type p53 is known to inhibit the VEGF pathway by multiple mechanisms, including repression of VEGF and HIF1A, so mutation in TP53 leading to loss of such activities will promote VEGF pathway signaling (Bergers and Benjamin 2003). In our experiments, mutant p53-stimulated VEGFR2 expression is necessary and sufficient for increased growth and migration of cultured breast cancer cell lines due to cell-autonomous VEGFR2 signaling. That tumors containing mutant p53 are likely to be more susceptible to anti-angiogenic therapy because of the added effect of antagonizing the tumor cell directly in addition to the vasculature is supported by clinical data shown in Figure 3F.
Mutant p53 mediates pro-oncogenic transcriptional profiles (for review, see Brosh and Rotter 2009; Freed-Pastor and Prives 2012). Interestingly, mutant p53 has been reported to stimulate additional receptor tyrosine kinases, including EGFR (Ludes-Meyers et al. 1996), IGF1R (Werner et al. 1996), MET (Muller et al. 2013), and PDGFRB (Weissmueller et al. 2014), all of which, along with VEGFR2, promote proproliferative signaling. As a tumor forms, acquisition of a hot spot mutation in TP53 may facilitate transcriptional plasticity, whereby tumor cells increase capacity for gene expression changes and therefore undergo selection for the greatest proproliferative transcriptional program for the particular tumor context. We found that hot spot mutants vary in their capacity to activate VEGFR2 expression, suggesting that only certain such mutants may harness VEGFR2 as a proproliferative gene, while other hot spot mutants may rely on different factors (Fig. 1C). This hypothesis explains, for instance, why such a wide array of genes and pathways has been reported to mediate mutant p53 gain of function.
Mutant p53 is associated with decreased overall survival in breast cancer (Langerod et al. 2007), which is most likely due to increased rate of metastases, a known phenotype in mutant p53 mouse models (Lang et al. 2004; Olive et al. 2004; Adorno et al. 2009; Hanel et al. 2013; Weissmueller et al. 2014). TP53 mutation facilitates the angiogenic switch by derepressing HIF1A and VEGFA expression (Mukhopadhyay et al. 1995; Ravi et al. 2000), promoting expression of proangiogenic factors that enhance tumor angiogenesis, growth, and metastatic potential (Folkman 2002). Our data suggest that p53 hot spot mutants may be selected over loss-of-function p53 mutants during the progression of breast cancer in part due to the advantages conferred by cell-autonomous VEGFR2 signaling.
We point out that the mevalonate pathway previously shown to be regulated by mutant p53 (Freed-Pastor et al. 2012) and VEGFR2 pathways are not mutually exclusive. VEGFR2 requires multiple products of the mevalonate pathway to function, including plasma membrane components as well as post-translational lipid modifications to signaling mediators (Mo and Elson 2004; Guo et al. 2010). Indeed, multiple pathways may be altered by mutant p53 within an individual tumor or even due to mutual interactions among tumor cells in the microenvironment to promote proproliferative capacities.
The SWI/SNF complex associates genome-wide with transcription regulatory elements (Euskirchen et al. 2011) to regulate nucleosome occupancy (Tolstorukov et al. 2013). We observed SWI/SNF-dependent recruitment of mutant p53 to the VEGFR2 promoter (Fig. 6D). Since mutant p53 and SWI/SNF complexes are required to mediate chromatin remodeling at the VEGFR2 proximal promoter, we propose that mutant p53 stimulates SWI/SNF-mediated nucleosomal displacement, possibly by facilitating recruitment of one or more transcriptional activators or histone modifiers that interact with mutant p53 (Supplemental Table S6). Conformational and contact hot spot mutants interact with SWI/SNF components (Fig. 5A–D; Supplemental Fig. S5A–C), and SWI/SNF function is required at multiple mutant p53 target genes (Fig. 6K–N), suggestive of a general mutant p53 transcriptional mechanism. BRG1- and BRM-containing SWI/SNF complexes are each required for maximal expression of these mutant p53 target genes, as depletion of either ATPase decreases expression, while codepletion results in the greatest repression (Fig. 6F–N; Supplemental Fig. S6B,C). Our data define a model in which mutant p53 facilitates gene activation via SWI/SNF-mediated promoter remodeling (Fig. 7C).
Mutant p53 has been proposed to facilitate transcriptional plasticity (Quante et al. 2012), and our data supply a mechanism by which mutant p53 may mediate genome-wide transcriptional changes by SWI/SNF-mediated nucleosomal remodeling. Because nucleosomal positioning is a critical factor in gene regulation, promoting or inhibiting transcription by regulating access to DNA, mutant p53 may co-opt SWI/SNF activity to mediate both gene activation and repression. As the SWI/SNF CRC is reported to interact with many of the same transcriptional regulators as mutant p53 (Supplemental Table S6), regulation of mutant p53 target genes could be extraordinarily complex, and protein recruitment patterns among loci or even at an individual locus may vary.
SWI/SNF proteins are tumor-suppressive in some contexts. For instance, PBAF subunit BAF180 mediates p21 expression in breast tumor cells to suppress tumorigenesis (Xia et al. 2008), BRG1 is necessary for efficient RB-mediated cell cycle arrest (Strobeck et al. 2000), and BRG1 cooperates with ATM to promote the DNA damage response (Kwon et al. 2015). Moreover, mutations in SWI/SNF subunits and TP53 have a tendency toward mutual exclusivity in multiple cancer types, including breast cancer, suggesting that loss of SWI/SNF function may phenocopy p53 loss to mediate oncogenesis (Kadoch et al. 2013). It is possible that mutant p53 impedes tumor-suppressive activities of the SWI/SNF complex, such as in the DNA damage response, which mutant p53 deregulates, leading to genetic instability (Song et al. 2007). Therefore, in conjunction with chemotherapy or radiotherapy, restoration of SWI/SNF tumor suppressor function by targeting mutant p53 may be a therapeutic option in cancers expressing hot spot mutants of p53.
Oncology is headed toward highly adaptable treatment regimens based on the particular genetic alterations of a tumor. Defining the contributions of mutant p53 and VEGFR2 to breast cancer tumorigenicity may be critical steps toward identifying specific tumor alterations that can be therapeutically harnessed. Outstanding questions include how SWI/SNF and mutant p53 positively regulate each other via recruitment of p53 to promoters and how the ensuing functional activation of promoter remodeling occurs. It will be interesting to discern why mutant p53 impacts many but not all target genes in a SWI/SNF-dependent manner. Future directions also include testing the feasibility of development of small molecules to interrupt the mutant p53–SWI/SNF interaction to impede mutant p53 gain-of-function activities. Finally, it will be of paramount importance whether patients with mutant p53-expressing breast tumors demonstrate improved survival with anti-VEGF treatment or newly developed small molecules.
Materials and methods
Reagents
Plasmids
pLNCX-Flag-p53-R175H, pLNCX-Flag-p53-G245S, pLNCX-Flag-p53-R248W, and doxycycline-inducible shp53 plasmids were generated as previously described (Freed-Pastor et al. 2012). pcDNA3.1-VEGFR2 and pcDNA3.1-VEGFR2-Y1059F were kind gifts from Dr. Lena Claesson-Welsh and Dr. Bjorn Olsen, respectively (Jinnin et al. 2008). Constructs were verified by sequencing using primers listed in Supplemental Table S4.
siRNAs
For siRNA knockdown experiments, Silencer Select siRNAs were purchased from Life Technologies and were as follows: siRNA to TP53 (s605 and s606), VEGFR2 (s7822 and s7823), SMARCA4 (Brg1; s13139 and s13140), SMARCA2 (BRM; s13133 and s13134), SMARCC1 (BAF155; s13145 and s13146), and SMARCC2 (BAF170; s13148 and s13149). Silencer Select negative control #1 siRNA (Life Technologies) was used as control siRNA. DharmaFECT 1 (Thermo Scientific) was used as the transfection reagent for all siRNA knockdown experiments. siRNA sequences are listed in Supplemental Table S4.
Antibodies
p53 was detected using a combination of mAb 1801/mAb DO-1 (both in-house-purified from hybridoma supernatants) or with polyclonal FL393 (Santa Cruz Biotechnology, sc-6243). Anti-p53 PAb421 (in-house-purified) was used along with mAb 1801/mAb DO-1 to deplete p53 in the ID-ChIP. Anti-Actin (A2066), mouse IgG (I5381), and rabbit IgG (I5006) antibodies were purchased from Sigma. Anti-VEGFR2 (55B11) rabbit mAb was purchased from Cell Signaling Technology. Anti-BAF53A (ab131272), anti-Histone H3 (ab1791), and anti-Histone H2A antibodies (ab18255) were purchased from Abcam. Anti-BRG1 (G-7; sc-17796), BRM (N-19; sc-6450), BAF170 (H-116; sc-10757), and BAF155 (H-76; sc-10756) antibodies were purchased from Santa Cruz Biotechnology.
Drugs
The following drugs were purchased from Sigma Aldrich: SU5416 (semaxanib, S8442), hydrocortisone (H4001), insulin (I1882), doxycycline (D9891), DMSO (D5879), and mitomycin C (Sigma M4287). EGF was purchased from Peprotech (AF-100-15). For drug treatment experiments, doxycycline was dissolved in H2O and used at a final concentration of 10 μg/mL, which was determined to generate maximal depletion of endogenous mutant p53. SU5416 (semaxanib) was dissolved in DMSO and added to cell cultures 48 h after plating at the listed experimental concentrations. DMSO was used as a vehicle control in untreated cells.
Cell cultures
Cell lines and generation of stable cell lines
MDA-468, MDA-231, SK-BR-3, HT29, H1299, and MCF7 cells were maintained in DMEM and 10% fetal bovine serum (FBS) (Gemini Bio-Products). MCF10A cells were maintained in DMEM/F12 supplemented with 5% horse serum (Life Technologies), 10 μg/mL insulin, 0.5 μg/mL hydrocortisone, and 20 ng/mL EGF. All cells were maintained at 37°C in 5% CO2. Unless otherwise stated, we refer to these growth conditions as 2D cultures to distinguish them from 3D culture conditions described below.
Clonal MDA-468.shp53 and clonal MDA-231.shp53 cells as well as MDA-468.shp53-175H, MDA-468.shp53-245S, and MDA-468.shp53-248W derivative cell lines were previously described (Freed-Pastor et al. 2012). Stable MDA-231.shp53 cell lines were developed to overexpress control vector (pcDNA3.1-GFP), pcDNA3.1-VEGFR2, and pcDNA3.1-VEGFR2-Y1059F by transfection of linearized pcDNA3.1 vector. Stable clones were selected with G418. To induce shRNA expression, cells were treated with 10 µg/mL doxycycline from day 0 for the time periods indicated in the figure legends. When overexpressing VEGFR2 or mutant p53 derivatives, MDA-468.shp53 and MDA-231.shp53 cells lines were maintained in doxycycline to deplete endogenous mutant p53.
3D cultures
The 3D cell culture protocol was performed as previously described (Debnath et al. 2003). For routine imaging, eight-well chamber slides were lined with 45 μL of growth factor-reduced Matrigel (BD Biosciences, 356231). Cells were seeded at 5000 cells per well in assay medium (DMEM/F12, 2% horse serum, 10 μg/mL insulin, 0.5 μg/mL hydrocortisone, 2% Matrigel) with 5 ng/mL EGF supplemented to MCF10A cultures. For RNA, protein, or chromatin analyses from 3D cultures, 35-mm plates were lined with 475 μL of Matrigel, and cells were seeded at a density of 175,000–225,000 cells per plate in assay medium and 2% Matrigel. Cells were refed with assay medium on day 4 and imaged or collected for analysis on day 8. When siRNA was used, cells grown in 2D conditions were transfected with 50 nM siRNA and, 24 h later, plated in 3D culture conditions. Cells were harvested using cell recovery solution (BD Biosciences). Where indicated, drug concentrations in 3D cultures were maintained when refreshing media. Differential interference contrast images were acquired by live imaging at 10× magnification using a LSM 700 confocal microscope with ZEN 2011 software (Zeiss). Multiple fields of each image were obtained, and representative images were chosen for presentation. Where needed, the Colony Blob Count Tool program was used within ImageJ (Schneider et al. 2012) to calculate the area of cells grown in 3D culture conditions. Areas of each independent replicate were quantitated using settings to control for background lighting. Incorrect program measurements, determined by counting an area of greater than one cell cluster as an individual colony or counting an area in which no cell cluster exists, were manually excluded.
Migration assay
Cell culture inserts (Ibidi, #80209) were placed in 35-mm tissue culture dishes to form an ∼500-μm cell-free gap. Approximately 25,000 MDA-231 cells that were transfected with 50 nM siRNA to deplete mutant p53 or VEGFR2 24 h earlier were trypsinized, quantitated by MOXI Z automated cell counter (ORFLO Technologies), and added to each side of the cell culture insert gap. Approximately 36 h later, after the cells were seeded, the cell culture insert was removed with sterile forceps. Fresh medium was added that was supplemented with 5 μg/mL mitomycin C (Sigma, M4287) to prevent cell proliferation. Cells were imaged at 0 and 48 h, which approximated wound closure for the control sample, using differential interference contrast images acquired by live imaging at 10× magnification using a LSM 700 confocal microscope with ZEN 2011 software (Carl Zeiss AG). Total migration was calculated by measuring with the Adobe Photoshop ruler tool the total distance migrated by each side of the wound relative to 0 h for three images per biological replicate.
RNA expression
qRT–PCR
For most experiments, RNA was isolated from cells using the Qiagen RNeasy minikit. For RNA-seq, RNA was isolated using the MagJET RNA kit (Thermo Scientific). Complementary DNA was generated using the Qiagen Quantitect reverse transcription kit with 1 μg of input RNA as measured by NanoDrop spectrophotometer (Thermo Scientific). Real-time PCR was carried out on an ABI StepOne Plus machine using SYBR Green dye. Transcript levels were assayed in triplicate and normalized to RPL32 mRNA expression. Relative changes in cDNA levels were calculated using the comparative Ct method (ΔΔCT method). All qRT–PCR primers were designed with Primer Express (Applied Biosystems) from genomic DNA sequence from the University of California at Santa Cruz (UCSC) Human Genome Browser hg19 assembly. Primer targeting was confirmed with the UCSC Human Genome Browser in silico PCR tool. All primer sequences were validated for amplification efficiency by comparison with a genomic DNA standard curve and amplified single targets as determined by melting curve analysis. Primer sequences are listed in Supplemental Table S4. All primers were purchased from Life Technologies.
Preparation and sequencing of RNA-seq libraries
Total RNA extracted using the MagJET RNA kit (Thermo Scientific) was first checked for integrity on an Agilent Bioanalyzer 2100; samples with RNA integrity number (RIN) >9.0 were used for subsequent processing. Total RNA was subjected to two rounds of poly(A) selection using oligo-d(T)25 magnetic beads (New England Biolabs). A single-read cDNA library was prepared following the Illumina TrueSeq small RNA protocol for strand-specific RNA-seq with minor modifications (Hoque et al. 2013). Briefly, poly(A)+ RNA was fragmented in an alkaline buffer (NaHCO3 at pH 9.3) for 2 min at 94°C followed by dephosphorylation with recombinant shrimp alkaline phosphatase (New England Biolabs) and then phosphorylation with T4 polynucleotide kinase (New England Biolabs). After addition of 3′ adapter (5′ adenylated) and 5′ adapter using truncated T4 RNA ligase II (New England Biolabs) and T4 RNA ligase I (New England Biolabs), respectively, RNA was reverse-transcribed using 3′ adapter-specific primer. cDNA was then amplified by PCR for 15 cycles with a universal forward primer and a reverse primer with bar code. The cDNA libraries were purified from an 8% polyacrylamide gel and quantified on an Agilent Bioanalyzer.
Analysis of RNA-seq libraries
RNA-seq was performed using an Illumina HiSeq 2000 version 3 instrument. At least 20 million reads per sample were acquired using 100-bp single-end reads. HTSeq (Anders et al. 2015) was used to convert reads mapped with TopHat in SAM format to gene read counts. Reads were converted to gene counts using the hg19 genome as a reference. HTSeq-converted read counts were used as an input for differential gene analysis in the R platform. RUVSeq was used to correct for variance (see Supplemental Fig. S7C,D; Risso et al. 2014). Briefly, read counts were filtered and normalized, variance was corrected, and differential gene expression was calculated using edgeR as described in the RUVSeq manual. A Venn diagram program (http://bioinformatics.psb.ugent.be/webtools/Venn) was used to identify genes that changed between knockdown conditions.
Protein analysis
Coimmunoprecipitations were performed based on a previously described method (Noll et al. 2012). Briefly, subconfluent cultures of MDA-468 or SK-BR-3 (1 × 10⁶ cells) were harvested, lysed in 500 μL of lysis buffer (20 mM Tris–HCl at pH 8, 1 mM EDTA, 0.5% NP-40, 150 mM NaCl, 10% glycerol, protease inhibitors [Roche]), sonicated, and centrifuged at 16,100g for 15 min at 4°C. Clarified lysates were incubated with 200 ng of either anti-p53 antibody (DO-1; Santa Cruz Biotechnology) or mouse IgG for 2 h at 4°C with agitation followed by the addition of 10 μL of protein-G-Sepharose beads (GE Healthcare) and incubation for an additional 2 h at 4°C. Beads were washed three times with 400 μL of lysis buffer, and protein complexes were eluted with SDS loading buffer for 5 min at 95°C. Western blot analysis of inputs and coimmunoprecipitated protein complexes was performed as described previously (Pishas et al. 2011). Where indicated, coimmunoprecipitations were performed as described in the “qChIP” section below.
Chromatin analysis
qChIP
qChIP experiments were carried out as previously described (Gomes et al. 2006). Briefly, MDA-468 cells were lysed in RIPA buffer (150 mM NaCl, 5 mM EDTA, 1% Nonidet P-40, 0.5% deoxycholate, 0.1% SDS, 50 mM Tris at pH 8.0, 0.5 μM phenylmethyl sulfonyl fluoride, 1 μM benzamidine, 3 μg/mL leupeptin, 100 ng/mL bacitracin, 200 ng/mL a2-macroglobulin) and sonicated to yield ∼500-bp fragments. Protein A/G Sepharose beads were conjugated to anti-p53 antibodies (1801/DO-1) that were used subsequently to immunoprecipitate p53 from ∼1 mg of whole-cell lysate. Quantitative ChIP was carried out on an ABI StepOne Plus using SYBR Green dye versus genomic standard DNA and input DNA. ChIP primers designed with Primer Express (Applied Biosystems) were derived from the USCS Human Genome Browser hg19 assembly. Primer sequence specificity was confirmed with the UCSC Human Genome Browser in silico PCR tool. All primer sequences were validated for amplification efficiency and amplified single targets as determined by melt curve analysis. ChIP primer sequences are provided in Supplemental Table S4. Samples were normalized to each other and other amplicons using percent input DNA.
MNase-PCR and ChIP
Primers sequences were individually designed and tested for amplification efficiency (Supplemental Table S4). For MNase-PCR, ∼1.5 million subconfluent MDA-468.shp53 cells grown in 3D culture were cross-linked for 10 min with 1% formaldehyde in PBS at room temperature. Nuclei were collected in nucleus preparation buffer (300 mM sucrose, 10 mM Tris-HCl at pH 7.5, 15 mM NaCl, 60 mM KCl, 5 mM MgCl2, 0.1 mM EDTA , 0.15 mM spermine, 0.5 mM spermidine, 0.1% Nonidet-P40, 0.5 μM phenylmethyl sulfonyl fluoride) supplemented with 3 mM CaCl2, pelleted by centrifugation, resuspended in MNase digestion buffer (nucleus preparation buffer without Nonidet-P40 and supplemented with 3mM CaCl2) and 0.5 U of micrococcal nuclease (Sigma, N3755), and incubated for 10 min at 37°C to generate primarily mononucleosomal length DNA fragments. Chromatin was incubated for 5 h at 65°C with proteinase K to reverse cross-linking and remove protein followed by incubation with RNase A to remove RNA. DNA was extracted with phenol-chloroform–isoamyl alcohol extraction followed by isopropanol precipitation. DNA was resuspended in 40 μL of 1× DNA loading dye, and 10 μL of resuspended material was separated via 2% agarose gel electrophoresis. DNA bands were visualized by ethidium bromide staining, and DNA bands corresponding to mononucleosomal length (∼147 bp) fragments were excised. DNA was purified with QIAquick gel extraction kit (Qiagen). qRT–PCR was used to determine the ratio of MNase-resistant DNA between sample conditions.
For MNase ChIP, ∼10 million subconfluent MDA-468.shp53 cells grown in 2D culture were cross-linked for 10 min with 1% formaldehyde and PBS at room temperature. Nuclei were collected and processed as described for MNase-PCR. Following MNase digestion, chromatin was released from nuclei by sonication, diluted, and normalized by DNA content using a NanoDrop spectrophotometer (Thermo Scientific). ChIP was performed as previously explained. Following final wash steps, immunoprecipitated chromatin was incubated for 5 h at 65°C with proteinase K to reverse cross-linking and remove protein followed by incubation with RNase A to remove RNA. DNA was extracted with phenol-chloroform–isoamyl alcohol extraction followed by isopropanol precipitation. DNA was resuspended in 30 μL of 1× DNA loading dye. Twenty-five microliters of resuspended material was separated via 2% agarose gel electrophoresis. DNA bands were visualized by ethidium bromide staining, and DNA bands corresponding to mononucleosomal length (∼147 bp) fragments were excised. DNA was purified with QIAquick gel extraction kit (Qiagen). qPCR was used to determine the ratio of MNase-resistant DNA between sample conditions.
In vivo DNase I footprinting by LM-PCR
MDA-468.shp53 cells grown in 3D culture were cross-linked for 10 min with 1% formaldehyde and PBS. Nuclei were collected in nucleus preparation buffer. DNase I (Worthington Biochemical Corporation) was added to resuspended nuclei. DNase I-digested chromatin was incubated for 5 h at 65°C to reverse cross-linking. DNA was extracted with phenol-chloroform–isoamyl alcohol extraction followed by isopropanol precipitation. One microgram of DNA was prepared for single-step primer extension to generate blunt-end fragments. The blunt-end fragments were then ligated to a linker DNA, creating PCR-amplifiable variable length DNAs. A nested primer was used to amplify linker-ligated genomic DNA from the VEGFR2 locus. A third nested primer was radiolabeled with [γ−32P]ATP (PerkinElmer) and used to linearly amplify DNA from the previous PCR step. Radiolabeled DNA was resolved by denaturing 8 M urea polyacrylamide gel electrophoresis. The DNase I hypersensitivity signal represents the γ−32P signal detected by phosphorimager quantitation. A GC acyclonucleotide ladder, shown in Supplemental Figure S4E, was used to confirm that the LM-PCR specifically amplifies the VEGFR2 proximal promoter region depicted in Figure 4C.
Breast cancer patient data sets
Breast tumor analysis from TCGA provisional breast cancer data set
Data from the Breast Invasive Carcinoma TCGA provisional data set generated by TCGA Research Network (http://cancergenome.nih.gov) was obtained (see the Supplemental Material). Data analysis was performed in two phases: First, the somatic mutations data set was analyzed to stratify the samples based on p53 mutation status. Next, TCGA breast cancer RNA-seq version 2 data set was analyzed to determine expression of genes of interest. Welch's t-test was used to determine statistical significance and correct for multiple testing, and, when necessary, the false discovery rate correction (Benjamini and Hochberg procedure) was used. RNA expression values were analyzed as upper quartile-normalized RNA-seq by expectation maximization (RSEM) of reads.
The NeoAva study
Patients with HER2-negative mammary carcinomas (>2.5 cm; tumor size T2, T3, or T4) previously untreated for the current disease were included in the NeoAva study. The study was approved by the institutional protocol review board, the regional ethics committee, and the Norwegian Medicines Agency and was carried out in accordance with the Declaration of Helsinki and International Conference on Harmonisation (ICH) guidelines for good clinical practice. The study was registered in the ClinicalTrials.gov database with the identifier NCT00773695. The patients were recruited into the study at three sites in Norway (The Norwegian Radium Hospital, Ullevål University Hospital, and St. Olav's hospital). Written informed consent was obtained from all the patients prior to inclusion. While 132 patients received neoadjuvant chemotherapy, 12 patients (not reported here) were allocated to an endocrine treatment arm. The patients were further randomized to receive or not receive bevacizumab in addition to chemotherapy. pCR was the primary endpoint and was defined as complete eradication of all invasive and noninvasive forms of cancer from the breast and lymph nodes. The percentage of tumor shrinkage was determined by taking the ratio of the size of the tumor at surgery to the size of the tumor at inclusion (termed “response ratio”), giving a continuous scale of response to treatment.
TP53 mutation status was assessed by sequencing the entire coding region (exons 2–11), including splice junctions, using BigDye direct cycle sequencing kit (Life Technologies). The samples were run on a 3730 DNA Analyzer (Life Technologies), a capillary electrophoresis-based automated DNA sequencer. TP53 mutation status was successfully obtained for 124 of the 132 total patients in the chemotherapy cohort. Response ratio data were missing and thus were not included for seven out of 124 samples with TP53 status available due to unavailability of post-treatment tumor measurements. P-values were derived from Kruskal-Wallis test.
Supplementary Material
Acknowledgments
We thank Ella Freulich for excellent technical assistance, and Lynn Biderman, Yan Zhu, and Masha Poyurovsky as well as other members of the Prives laboratory for helpful discussions. This work was supported by National Institutes of Health grant CA87497 and the National Institutes of Health Medical Scientist Training Program through Columbia University Medical School. The NeoAva study was cosponsored by Roche Norway. N.T.P. designed and performed most of the experiments. K.R., J.Y.Z, W.Z., O.L., and W.A.F.-P. assisted in experiments. L.S.-P., A.-L.B.-D., and O.E. conducted, analyzed, and described the NeoAva study. K.R. performed, analyzed, and described TCGA analysis. J.B. designed doxycycline-inducible cell lines. P.M.N. initiated the mass spectrometry analysis and performed experiments. S.P.N. performed mass spectrometry analysis, which J.G. supervised and described. M.H. and B.T. prepared the RNA-seq library. V.F. performed and analyzed RNA-seq analyses. C.P. supervised the project. N.T.P. and C.P. conceived of the project, designed most of the studies, analyzed the data, and wrote the manuscript.
Footnotes
Supplemental material is available for this article.
Article published online ahead of print. Article and publication date are online at http://www.genesdev.org/cgi/doi/10.1101/gad.263202.115.
References
- Adorno M, Cordenonsi M, Montagner M, Dupont S, Wong C, Hann B, Solari A, Bobisse S, Rondina MB, Guzzardo V, et al. 2009. A Mutant-p53/Smad complex opposes p63 to empower TGFβ-induced metastasis. Cell 137: 87–98. [DOI] [PubMed] [Google Scholar]
- Anders S, Pyl PT, Huber W. 2015. HTSeq—a Python framework to work with high-throughput sequencing data. Bioinformatics 31: 166–169. [DOI] [PMC free article] [PubMed] [Google Scholar]
- Bergers G, Benjamin LE. 2003. Tumorigenesis and the angiogenic switch. Nat Rev Cancer 3: 401–410. [DOI] [PubMed] [Google Scholar]
- Bougeard G, Sesboue R, Baert-Desurmont S, Vasseur S, Martin C, Tinat J, Brugieres L, Chompret A, de Paillerets BB, Stoppa-Lyonnet D, et al. 2008. Molecular basis of the Li-Fraumeni syndrome: an update from the French LFS families. J Med Genet 45: 535–538. [DOI] [PubMed] [Google Scholar]
- Braastad CD, Han Z, Hendrickson EA. 2003. Constitutive DNase I hypersensitivity of p53-regulated promoters. J Biol Chem 278: 8261–8268. [DOI] [PubMed] [Google Scholar]
- Brosh R, Rotter V. 2009. When mutants gain new powers: news from the mutant p53 field. Nat Rev Cancer 9: 701–713. [DOI] [PubMed] [Google Scholar]
- Bruns AF, Herbert SP, Odell AF, Jopling HM, Hooper NM, Zachary IC, Walker JH, Ponnambalam S. 2010. Ligand-stimulated VEGFR2 signaling is regulated by co-ordinated trafficking and proteolysis. Traffic 11: 161–174. [DOI] [PubMed] [Google Scholar]
- Burrows AE, Smogorzewska A, Elledge SJ. 2010. Polybromo-associated BRG1-associated factor components BRD7 and BAF180 are critical regulators of p53 required for induction of replicative senescence. Proc Natl Acad Sci 107: 14280–14285. [DOI] [PMC free article] [PubMed] [Google Scholar]
- Cooks T, Pateras IS, Tarcic O, Solomon H, Schetter AJ, Wilder S, Lozano G, Pikarsky E, Forshew T, Rosenfeld N, et al. 2013. Mutant p53 prolongs NF-κB activation and promotes chronic inflammation and inflammation-associated colorectal cancer. Cancer Cell 23: 634–646. [DOI] [PMC free article] [PubMed] [Google Scholar]
- Debnath J, Muthuswamy SK, Brugge JS. 2003. Morphogenesis and oncogenesis of MCF-10A mammary epithelial acini grown in three-dimensional basement membrane cultures. Methods 30: 256–268. [DOI] [PubMed] [Google Scholar]
- Di Agostino S, Strano S, Emiliozzi V, Zerbini V, Mottolese M, Sacchi A, Blandino G, Piaggio G. 2006. Gain of function of mutant p53: the mutant p53/NF-Y protein complex reveals an aberrant transcriptional mechanism of cell cycle regulation. Cancer Cell 10: 191–202. [DOI] [PubMed] [Google Scholar]
- Ding L, Getz G, Wheeler DA, Mardis ER, McLellan MD, Cibulskis K, Sougnez C, Greulich H, Muzny DM, Morgan MB, et al. 2008. Somatic mutations affect key pathways in lung adenocarcinoma. Nature 455: 1069–1075. [DOI] [PMC free article] [PubMed] [Google Scholar]
- Do PM, Varanasi L, Fan S, Li C, Kubacka I, Newman V, Chauhan K, Daniels SR, Boccetta M, Garrett MR, et al. 2012. Mutant p53 cooperates with ETS2 to promote etoposide resistance. Genes Dev 26: 830–845. [DOI] [PMC free article] [PubMed] [Google Scholar]
- Euskirchen GM, Auerbach RK, Davidov E, Gianoulis TA, Zhong G, Rozowsky J, Bhardwaj N, Gerstein MB, Snyder M. 2011. Diverse roles and interactions of the SWI/SNF chromatin remodeling complex revealed using global approaches. PLoS Genet 7: e1002008. [DOI] [PMC free article] [PubMed] [Google Scholar]
- Euskirchen G, Auerbach RK, Snyder M. 2012. SWI/SNF chromatin-remodeling factors: multiscale analyses and diverse functions. J Biol Chem 287: 30897–30905. [DOI] [PMC free article] [PubMed] [Google Scholar]
- Ferrara N. 2004. Vascular endothelial growth factor: basic science and clinical progress. Endocr Rev 25: 581–611. [DOI] [PubMed] [Google Scholar]
- Folkman J. 2002. Role of angiogenesis in tumor growth and metastasis. Semin Oncol 29: 15–18. [DOI] [PubMed] [Google Scholar]
- Fong TA, Shawver LK, Sun L, Tang C, App H, Powell TJ, Kim YH, Schreck R, Wang X, Risau W, et al. 1999. SU5416 is a potent and selective inhibitor of the vascular endothelial growth factor receptor (Flk-1/KDR) that inhibits tyrosine kinase catalysis, tumor vascularization, and growth of multiple tumor types. Cancer Res 59: 99–106. [PubMed] [Google Scholar]
- Freed-Pastor WA, Prives C. 2012. Mutant p53: one name, many proteins. Genes Dev 26: 1268–1286. [DOI] [PMC free article] [PubMed] [Google Scholar]
- Freed-Pastor WA, Mizuno H, Zhao X, Langerod A, Moon SH, Rodriguez-Barrueco R, Barsotti A, Chicas A, Li W, Polotskaia A, et al. 2012. Mutant p53 disrupts mammary tissue architecture via the mevalonate pathway. Cell 148: 244–258. [DOI] [PMC free article] [PubMed] [Google Scholar]
- Ghosh S, Sullivan CA, Zerkowski MP, Molinaro AM, Rimm DL, Camp RL, Chung GG. 2008. High levels of vascular endothelial growth factor and its receptors (VEGFR-1, VEGFR-2, neuropilin-1) are associated with worse outcome in breast cancer. Hum Pathol 39: 1835–1843. [DOI] [PMC free article] [PubMed] [Google Scholar]
- Gomes NP, Bjerke G, Llorente B, Szostek SA, Emerson BM, Espinosa JM. 2006. Gene-specific requirement for P-TEFb activity and RNA polymerase II phosphorylation within the p53 transcriptional program. Genes Dev 20: 601–612. [DOI] [PMC free article] [PubMed] [Google Scholar]
- Guan B, Wang TL, Shih Ie M. 2011. ARID1A, a factor that promotes formation of SWI/SNF-mediated chromatin remodeling, is a tumor suppressor in gynecologic cancers. Cancer Res 71: 6718–6727. [DOI] [PMC free article] [PubMed] [Google Scholar]
- Guo S, Colbert LS, Fuller M, Zhang Y, Gonzalez-Perez RR. 2010. Vascular endothelial growth factor receptor-2 in breast cancer. Biochim Biophys Acta 1806: 108–121. [DOI] [PMC free article] [PubMed] [Google Scholar]
- Hanel W, Marchenko N, Xu S, Yu SX, Weng W, Moll U. 2013. Two hot spot mutant p53 mouse models display differential gain of function in tumorigenesis. Cell Death Differ 20: 898–909. [DOI] [PMC free article] [PubMed] [Google Scholar]
- Hoque M, Ji Z, Zheng D, Luo W, Li W, You B, Park JY, Yehia G, Tian B. 2013. Analysis of alternative cleavage and polyadenylation by 3′ region extraction and deep sequencing. Nat Methods 10: 133–139. [DOI] [PMC free article] [PubMed] [Google Scholar]
- Jinnin M, Medici D, Park L, Limaye N, Liu Y, Boscolo E, Bischoff J, Vikkula M, Boye E, Olsen BR. 2008. Suppressed NFAT-dependent VEGFR1 expression and constitutive VEGFR2 signaling in infantile hemangioma. Nat Med 14: 1236–1246. [DOI] [PMC free article] [PubMed] [Google Scholar]
- Kadoch C, Hargreaves DC, Hodges C, Elias L, Ho L, Ranish J, Crabtree GR. 2013. Proteomic and bioinformatic analysis of mammalian SWI/SNF complexes identifies extensive roles in human malignancy. Nat Genet 45: 592–601. [DOI] [PMC free article] [PubMed] [Google Scholar]
- Kenny PA, Lee GY, Myers CA, Neve RM, Semeiks JR, Spellman PT, Lorenz K, Lee EH, Barcellos-Hoff MH, Petersen OW, et al. 2007. The morphologies of breast cancer cell lines in three-dimensional assays correlate with their profiles of gene expression. Mol Oncol 1: 84–96. [DOI] [PMC free article] [PubMed] [Google Scholar]
- Kim E, Deppert W. 2007. Interactions of mutant p53 with DNA: guilt by association. Oncogene 26: 2185–2190. [DOI] [PubMed] [Google Scholar]
- Krebs JE, Peterson CL. 2000. Understanding ‘active’ chromatin: a historical perspective of chromatin remodeling. Crit Rev Eukaryot Gene Expr 10: 1–12. [PubMed] [Google Scholar]
- Kwon SJ, Park JH, Park EJ, Lee SA, Lee HS, Kang SW, Kwon J. 2015. ATM-mediated phosphorylation of the chromatin remodeling enzyme BRG1 modulates DNA double-strand break repair. Oncogene 34: 303–313. [DOI] [PubMed] [Google Scholar]
- Lang GA, Iwakuma T, Suh YA, Liu G, Rao VA, Parant JM, Valentin-Vega YA, Terzian T, Caldwell LC, Strong LC, et al. 2004. Gain of function of a p53 hot spot mutation in a mouse model of Li-Fraumeni syndrome. Cell 119: 861–872. [DOI] [PubMed] [Google Scholar]
- Langerod A, Zhao H, Borgan O, Nesland JM, Bukholm IR, Ikdahl T, Karesen R, Borresen-Dale AL, Jeffrey SS. 2007. TP53 mutation status and gene expression profiles are powerful prognostic markers of breast cancer. Breast Cancer Res 9: R30. [DOI] [PMC free article] [PubMed] [Google Scholar]
- Laptenko O, Prives C. 2006. Transcriptional regulation by p53: one protein, many possibilities. Cell Death Differ 13: 951–961. [DOI] [PubMed] [Google Scholar]
- Laptenko O, Beckerman R, Freulich E, Prives C. 2011. p53 binding to nucleosomes within the p21 promoter in vivo leads to nucleosome loss and transcriptional activation. Proc Natl Acad Sci 108: 10385–10390. [DOI] [PMC free article] [PubMed] [Google Scholar]
- Lee D, Kim JW, Seo T, Hwang SG, Choi EJ, Choe J. 2002. SWI/SNF complex interacts with tumor suppressor p53 and is necessary for the activation of p53-mediated transcription. J Biol Chem 277: 22330–22337. [DOI] [PubMed] [Google Scholar]
- Lidor Nili E, Field Y, Lubling Y, Widom J, Oren M, Segal E. 2010. p53 binds preferentially to genomic regions with high DNA-encoded nucleosome occupancy. Genome Res 20: 1361–1368. [DOI] [PMC free article] [PubMed] [Google Scholar]
- Ludes-Meyers JH, Subler MA, Shivakumar CV, Munoz RM, Jiang P, Bigger JE, Brown DR, Deb SP, Deb S. 1996. Transcriptional activation of the human epidermal growth factor receptor promoter by human p53. Mol Cell Biol 16: 6009–6019. [DOI] [PMC free article] [PubMed] [Google Scholar]
- Mo H, Elson CE. 2004. Studies of the isoprenoid-mediated inhibition of mevalonate synthesis applied to cancer chemotherapy and chemoprevention. Exp Biol Med (Maywood) 229: 567–585. [DOI] [PubMed] [Google Scholar]
- Mukhopadhyay D, Tsiokas L, Sukhatme VP. 1995. Wild-type p53 and v-Src exert opposing influences on human vascular endothelial growth factor gene expression. Cancer Res 55: 6161–6165. [PubMed] [Google Scholar]
- Muller PA, Vousden KH. 2014. Mutant p53 in cancer: new functions and therapeutic opportunities. Cancer Cell 25: 304–317. [DOI] [PMC free article] [PubMed] [Google Scholar]
- Muller PA, Caswell PT, Doyle B, Iwanicki MP, Tan EH, Karim S, Lukashchuk N, Gillespie DA, Ludwig RL, Gosselin P, et al. 2009. Mutant p53 drives invasion by promoting integrin recycling. Cell 139: 1327–1341. [DOI] [PubMed] [Google Scholar]
- Muller PA, Trinidad AG, Timpson P, Morton JP, Zanivan S, van den Berghe PV, Nixon C, Karim SA, Caswell PT, Noll JE, et al. 2013. Mutant p53 enhances MET trafficking and signalling to drive cell scattering and invasion. Oncogene 32: 1252–1265. [DOI] [PMC free article] [PubMed] [Google Scholar]
- Naidu SR, Love IM, Imbalzano AN, Grossman SR, Androphy EJ. 2009. The SWI/SNF chromatin remodeling subunit BRG1 is a critical regulator of p53 necessary for proliferation of malignant cells. Oncogene 28: 2492–2501. [DOI] [PMC free article] [PubMed] [Google Scholar]
- Noll M, Kornberg RD. 1977. Action of micrococcal nuclease on chromatin and the location of histone H1. J Mol Biol 109: 393–404. [DOI] [PubMed] [Google Scholar]
- Noll JE, Jeffery J, Al-Ejeh F, Kumar R, Khanna KK, Callen DF, Neilsen PM. 2012. Mutant p53 drives multinucleation and invasion through a process that is suppressed by ANKRD11. Oncogene 31: 2836–2848. [DOI] [PubMed] [Google Scholar]
- Oh J, Sohn DH, Ko M, Chung H, Jeon SH, Seong RH. 2008. BAF60a interacts with p53 to recruit the SWI/SNF complex. J Biol Chem 283: 11924–11934. [DOI] [PubMed] [Google Scholar]
- Olive KP, Tuveson DA, Ruhe ZC, Yin B, Willis NA, Bronson RT, Crowley D, Jacks T. 2004. Mutant p53 gain of function in two mouse models of Li-Fraumeni syndrome. Cell 119: 847–860. [DOI] [PubMed] [Google Scholar]
- Olivier M, Hollstein M, Hainaut P. 2010. TP53 mutations in human cancers: origins, consequences, and clinical use. Cold Spring Harb Perspect Biol 2: a001008. [DOI] [PMC free article] [PubMed] [Google Scholar]
- Patterson C, Wu Y, Lee ME, DeVault JD, Runge MS, Haber E. 1997. Nuclear protein interactions with the human KDR/flk-1 promoter in vivo. Regulation of Sp1 binding is associated with cell type-specific expression. J Biol Chem 272: 8410–8416. [DOI] [PubMed] [Google Scholar]
- Pishas KI, Al-Ejeh F, Zinonos I, Kumar R, Evdokiou A, Brown MP, Callen DF, Neilsen PM. 2011. Nutlin-3a is a potential therapeutic for ewing sarcoma. Clin Cancer Res 17: 494–504. [DOI] [PubMed] [Google Scholar]
- Quante T, Otto B, Brazdova M, Kejnovska I, Deppert W, Tolstonog GV. 2012. Mutant p53 is a transcriptional co-factor that binds to G-rich regulatory regions of active genes and generates transcriptional plasticity. Cell Cycle 11: 3290–3303. [DOI] [PMC free article] [PubMed] [Google Scholar]
- Ravi R, Mookerjee B, Bhujwalla ZM, Sutter CH, Artemov D, Zeng Q, Dillehay LE, Madan A, Semenza GL, Bedi A. 2000. Regulation of tumor angiogenesis by p53-induced degradation of hypoxia-inducible factor 1α. Genes Dev 14: 34–44. [PMC free article] [PubMed] [Google Scholar]
- Reisman D, Glaros S, Thompson EA. 2009. The SWI/SNF complex and cancer. Oncogene 28: 1653–1668. [DOI] [PubMed] [Google Scholar]
- Risso D, Ngai J, Speed TP, Dudoit S. 2014. Normalization of RNA-seq data using factor analysis of control genes or samples. Nat Biotechnol 32: 896–902. [DOI] [PMC free article] [PubMed] [Google Scholar]
- Ryden L, Linderholm B, Nielsen NH, Emdin S, Jonsson PE, Landberg G. 2003. Tumor specific VEGF-A and VEGFR2/KDR protein are co-expressed in breast cancer. Breast Cancer Res Treat 82: 147–154. [DOI] [PubMed] [Google Scholar]
- Ryme J, Asp P, Bohm S, Cavellan E, Farrants AK. 2009. Variations in the composition of mammalian SWI/SNF chromatin remodelling complexes. J Cell Biochem 108: 565–576. [DOI] [PubMed] [Google Scholar]
- Schneider CA, Rasband WS, Eliceiri KW. 2012. NIH Image to ImageJ: 25 years of image analysis. Nat Methods 9: 671–675. [DOI] [PMC free article] [PubMed] [Google Scholar]
- Song H, Hollstein M, Xu Y. 2007. p53 gain-of-function cancer mutants induce genetic instability by inactivating ATM. Nat Cell Biol 9: 573–580. [DOI] [PubMed] [Google Scholar]
- Stambolsky P, Tabach Y, Fontemaggi G, Weisz L, Maor-Aloni R, Siegfried Z, Shiff I, Kogan I, Shay M, Kalo E, et al. 2010. Modulation of the vitamin D3 response by cancer-associated mutant p53. Cancer Cell 17: 273–285. [DOI] [PMC free article] [PubMed] [Google Scholar]
- Strobeck MW, Knudsen KE, Fribourg AF, DeCristofaro MF, Weissman BE, Imbalzano AN, Knudsen ES. 2000. BRG-1 is required for RB-mediated cell cycle arrest. Proc Natl Acad Sci 97: 7748–7753. [DOI] [PMC free article] [PubMed] [Google Scholar]
- Tolstorukov MY, Sansam CG, Lu P, Koellhoffer EC, Helming KC, Alver BH, Tillman EJ, Evans JA, Wilson BG, Park PJ, et al. 2013. Swi/Snf chromatin remodeling/tumor suppressor complex establishes nucleosome occupancy at target promoters. Proc Natl Acad Sci 110: 10165–10170. [DOI] [PMC free article] [PubMed] [Google Scholar]
- Vousden KH, Prives C. 2009. Blinded by the light: the growing complexity of p53. Cell 137: 413–431. [DOI] [PubMed] [Google Scholar]
- Walerych D, Napoli M, Collavin L, Del Sal G. 2012. The rebel angel: mutant p53 as the driving oncogene in breast cancer. Carcinogenesis 33: 2007–2017. [DOI] [PMC free article] [PubMed] [Google Scholar]
- Weissmueller S, Manchado E, Saborowski M, Morris JP, Wagenblast E, Davis CA, Moon SH, Pfister NT, Tschaharganeh DF, Kitzing T, et al. 2014. Mutant p53 drives pancreatic cancer metastasis through cell-autonomous PDGF receptor β signaling. Cell 157: 382–394. [DOI] [PMC free article] [PubMed] [Google Scholar]
- Werner H, Karnieli E, Rauscher FJ, LeRoith D. 1996. Wild-type and mutant p53 differentially regulate transcription of the insulin-like growth factor I receptor gene. Proc Natl Acad Sci 93: 8318–8323. [DOI] [PMC free article] [PubMed] [Google Scholar]
- Wilson BG, Roberts CW. 2011. SWI/SNF nucleosome remodellers and cancer. Nat Rev Cancer 11: 481–492. [DOI] [PubMed] [Google Scholar]
- Xia W, Nagase S, Montia AG, Kalachikov SM, Keniry M, Su T, Memeo L, Hibshoosh H, Parsons R. 2008. BAF180 is a critical regulator of p21 induction and a tumor suppressor mutated in breast cancer. Cancer Res 68: 1667–1674. [DOI] [PMC free article] [PubMed] [Google Scholar]
- Xu Y, Zhang J, Chen X. 2007. The activity of p53 is differentially regulated by Brm- and Brg1-containing SWI/SNF chromatin remodeling complexes. J Biol Chem 282: 37429–37435. [DOI] [PubMed] [Google Scholar]
Associated Data
This section collects any data citations, data availability statements, or supplementary materials included in this article.