

Abstract
Background:
We have previously tested, in a laboratory setting, a novel algorithm that enables prediction of hypoglycemia. The algorithm integrates information of autonomic modulation, based on heart rate variability (HRV), and data based on a continuous glucose monitoring (CGM) device. Now, we investigate whether the algorithm is suitable for prediction of hypoglycemia and for improvement of hypoglycemic detection during normal daily activities.
Methods:
Twenty-one adults (13 men) with T1D prone to hypoglycemia were recruited and monitored with CGM and a Holter device while they performed normal daily activities. We used our developed algorithm (a pattern classification method) to predict spontaneous hypoglycemia based on CGM and HRV. We compared 3 different models; (i) a model containing raw data from the CGM device; (ii) a CGM* model containing data derived from the CGM device signal; and (iii) a CGM+HRV model-combining model (ii) with HRV data.
Results:
A total of 12 hypoglycemic events (glucose levels < 3.9 mmol/L, 70 mg/dL) and 237 euglycemic measurements were included. For a 20-minute prediction, model (i) resulted in a ROC AUC of 0.69. If a high sensitivity of 100% was chosen, the corresponding specificity was 69%. (ii) The CGM* model yielded a ROC AUC of 0.92 with a corresponding sensitivity of 100% and specificity of 71%. (iii) The CGM+HRV model yielded a ROC AUC of 0.96 with a corresponding sensitivity of 100% and specificity of 91%.
Conclusions:
Data shows that adding information of autonomic modulation to CGM measurements enables prediction and improves the detection of hypoglycemia.
Keywords: continuous glucose monitoring, heart rate variability, hypoglycemia, diabetes, prediction
Were it not for the risk of hypoglycemic episodes, patients with diabetes could have normal glucose levels over a lifetime of diabetes. Hypoglycemia often results in an increase physical as well as psychosocial morbidity, and is a risk factor for an increased mortality.1,2 Hypoglycemia is very common in patients with type 1 diabetes (T1D).3 Patients trying to improve or maintain a tight glycemic control suffer from innumerable episodes of asymptomatic hypoglycemia. Plasma glucose levels may be less than 60 mg/dl (3.3 mmol/l) 10% of the time, and on average, patients with T1D suffer from 2 weekly incidents of symptomatic hypoglycemia.1,4,5 Accordingly, patients with diabetes experience thousands of hypoglycemic events over a lifetime. In addition, these patients have a 4.7-fold excess mortality risk compared to healthy subjects.6 This explains why there is a considerable interest in using continuous glucose monitoring (CGM) devices to detect and warn diabetic patients about an imminent hypoglycemic event.7-10 However, a proportion of false positive alarms must be tolerated.
Koivikko et al studied 37 adults with T1D, who underwent CGM and ECG monitoring for 3 nights. The authors observed that spontaneous nocturnal hypoglycemia resulted in a reduction of the low-frequency component of the heart rate variability (HRV).11 HRV, that is, the beat-to-beat fluctuations in the heart rate, is a noninvasive and extensively validated method to investigate the balance in the autonomic nervous system.12,13 Recently, we showed how a combination of CGM and HRV could be used to predict and detect hypoglycemia in bed-bound patients with T1D.14 Our data suggested that HRV could help improving specificity and thereby reduce false positive alarms. However, questions remain on how useful HRV information is during daily life living and during spontaneous hypoglycemia. HRV is influenced by many factors such as physical activity, diurnal variation, age and gender.15,16 Also, glucose excursions are much more diverse and complex under free-living conditions.17 Therefore, with the present study we aimed to investigate whether the developed algorithm14 was able to predict and improve the detection of hypoglycemia during normal daily activities.
Methods
Participants
Data for this study were obtained from a trial performed at Steno Diabetes Center (Gentofte, Denmark).18 A total of 21 (13 men and 8 women) adults with long lasting T1D were recruited. The patients were 58 ± 10 years old, had a diabetes duration of 34 ± 12 years and a HbA1c 7.9 ± 0.7%, and 11 participants had peripheral neuropathy measured by biothesiometer. All participants were prone to hypoglycemia, that is, they had experienced at least 2 episodes of severe hypoglycemia within the last year. None of the patients had a history of cardiovascular disease or were taking drugs affecting the cardiovascular system. All patients had a normal electrocardiogram. The study protocols were approved by the local ethics committee and the study conducted according to the principles of the Helsinki Declaration II. All patients gave their written informed consent.
Study Design
Participants were admitted to the Clinical Research Unit at the Steno Diabetes Center Thursday at 8 pm. ECG was measured from lead II using a digital Holter monitor (SpiderView Plus, ELA Medical, Montrouge, France). At the same time, CGM was monitored using a Guardian Real-Time Continuous Glucose Monitoring System (Medtronic MiniMed, Northridge, CA, USA) with the prevailing glucose level blinded. At 11 pm a cannula was placed into an antecubital arm vein. Blood glucose samples were taken at hourly intervals until 7 am the next morning. At 8 am, participants were sent home with the monitoring equipment and were instructed to calibrate the CGM at least 4 times a day. Monitoring ended on Sunday at 8 pm. A total of 72 hours of continuous CGM and ECG data were available for each participant.
Data Processing
The ECG was analyzed using custom analysis software developed in MatLab (Version R2014a; MathWorks, Natick, MA, USA). ECG QRS detection was implemented based on the methods of Pan and Tompkins with (1) bandpass filter, (2) differentiating, (3) squaring, and (4) moving-window integration.19 Initial R-peaks were identified with a threshold and a minimum time distance of 250 ms from the moving-window integration output. R detections were then found as the highest point in the original signal within the timeframe of the initial detected peak. Interbeat intervals were derived from the R detections and interpolation was used to remove outliers based on 2.StdHRV. The filtered HRV signal was inspected manually and periods with substantial noisy signals were labeled for excluding glucose measurements with appertaining corrupted HRV. The HRV signal was analyzed with a 5 minutes, 90% overlapping sliding window calculating typical derived measures describing HRV; heart rate, SDNN (standard deviation of all NN intervals), SDANN (standard deviation of the averages of NN intervals in all 5-minute segments of the entire recording), pNNx (proportion of pairs of adjacent NN intervals differing by more than 50 ms), RMSSD (the square root of the mean of the sum of the squares of differences between adjacent NN intervals), VLF (power in very low frequency range, <0.04 Hz), LF (power in low frequency range, 0.04-0.15 Hz), HF (power in high frequency range, 0.15-0.4 Hz), TP (total power of all frequencies), LF/HF (ratio of LF and HF), entropy.
The CGM signal was spline resampled to remove short periods with dropouts. Dropouts defined as periods with no measurements shorter than 15 minutes. Single measurement of glucose (SMG), such as blood plasma glucose or self-monitoring of blood glucose levels below 3.9 mmol/L (70 mg/dL) were labeled as a hypoglycemic event20 and otherwise as euglycemia. Glucose spot measurements with corresponding CGM readings showing a discrepancy of 8 mmol/L (144 mg/dl) or more were considered as erroneous data in either the CGM or spot measurement and they were therefore excluded from further analysis. Furthermore, spot measurements within 2 hours after a hypoglycemic event were excluded since such an event may affect the heart rate during the recovery phase.21 Figure 1 shows CGM readings with corresponding SMG readings from 1 participant. The dashed line illustrates the threshold for labeling SMG reading as either hypoglycemic or euglycemic.
Figure 1.
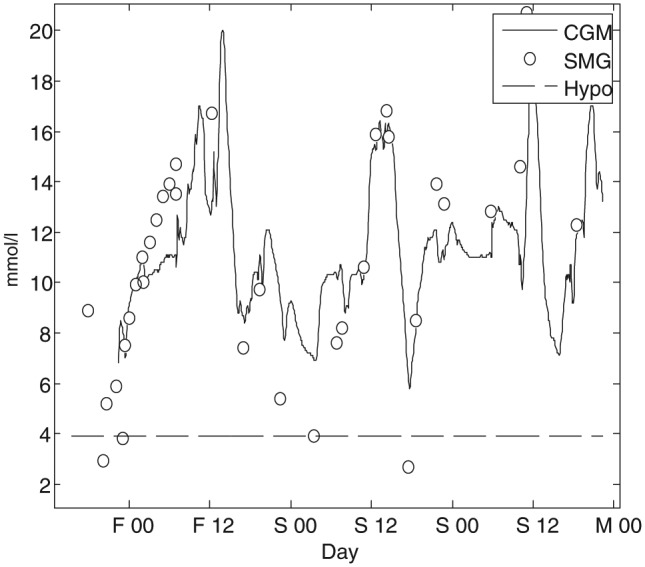
The line represents an individual patient CGM profile and the circles the corresponding single measurement of glucose (SMG), such as blood plasma glucose or self-monitoring of blood glucose levels from midnight Friday (F 00) to midnight Monday (M 00).
Pattern Classification
We developed a pattern classification method to predict single measurements of glucose (SMG) into 1 of the 2 classes: being within the range of hypoglycemia, or euglycemia. The method was based on extracting features from the CGM signal and the derived HRV signal prior to the SMG. A classification model was applied, using features that produced the best prediction model. The approach is illustrated in Figure 2, where data in a 60-minute prediction window 10 minutes prior to the SMG have been used to extract features for prediction. We have described the extraction of features in detail in a recent publication.14 In short, we used different time intervals within the prediction window to calculate several derived features from the CGM and the corresponding HRV signals. The nature of this approach results in a large number of features. To eliminate uninformative features, we used a ranking and correlative method where the receiver operating characteristic (ROC) for every feature was calculated. The result was weighted based on the correlation with higher-ranking features. The 40 most informative features were kept and the rest were discarded. To find a subset of the most informative features for model inclusion, we used forward selection and concurrently a 10-fold cross validation. The model used for classifying the patterns was based on logistic regression classification.
Figure 2.
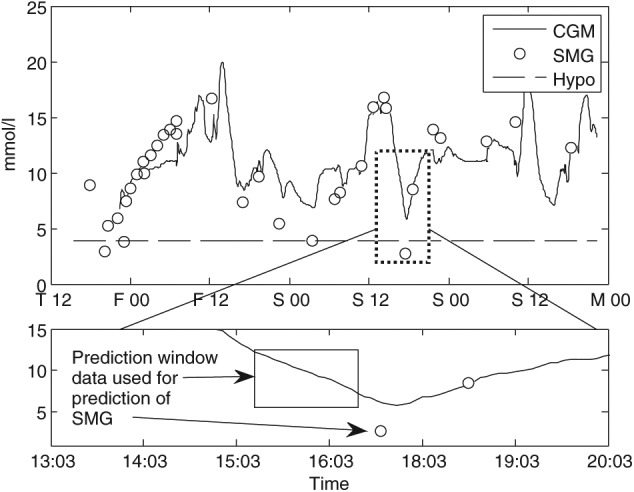
An illustration of the window used for prediction of a single measurement of glucose (SMG) outcome. In this example, CGM and HRV data 10 minutes prior to the SMG reading are used for prediction.
Performance
For evaluation of the hypothesis that HRV could add information in the prediction of hypoglycemia, we assessed and compared 3 different models; (i) 1 model (CGM) containing only the raw information from the CGM, (ii) 1 model (CGM*) containing features derived from the CGM signal in the prediction window, and (iii) 1 model (CGM+HRV) containing both features derived from CGM and HRV. The classification performance was evaluated by sample-based sensitivity and specificity along with ROC and absolute number of true positives, true negatives, false positives and false negatives for a chosen best model. Each SMG reading was predicted as either hypoglycemic or euglycemic, and the truth of each classification was calculated subsequently. Calculation of the different model (i-iii) performances was based on the prediction window starting 0 to 30 minutes prior to the SMG readings. Hence, a prediction window starting 30 minutes prior to the reading will yield a 30-minute prediction interval.
Results
A total of 12 hypoglycemic events and 237 euglycemic SMG readings were included in the 21 datasets. For a 20-minute prediction of the SMG reading, the CGM model (i) had a ROC AUC of 0.69 with a corresponding sensitivity of 100% and a specificity of 69%. The CGM* model (ii) yielded a ROC AUC of 0.92 with a corresponding sensitivity of 100% and specificity of 71%. The CGM+HRV model (iii) yielded a ROC AUC of 0.96 with a corresponding sensitivity of 100% and specificity of 91%. The relative and absolute numbers for the 20-minute prediction are seen in Table 1 and the corresponding ROC for the 3 models are depicted in Figure 3B, which shows the comparison of the (ii) CGM* model and the (iii) CGM+HRV model with varying prediction times. The CGM+HRV model is obtaining a higher specificity when sliding prediction time from 0 to 30 min, whereas the CGM* model is steadily losing prediction power. The difference between the models in the time dependent analysis is significant (P < .05).
Table 1.
Performance.
| Model | SEN (%) | SPE (%) | AUC (%) | TP | TN | FP | FN |
|---|---|---|---|---|---|---|---|
| i. CGM | 100 | 68 | 69 | 12 | 161 | 76 | 0 |
| ii. CGM* | 100 | 71 | 92 | 12 | 168 | 69 | 0 |
| iii. CGM+HRV | 100 | 91 | 96 | 12 | 216 | 21 | 0 |
Performance represented as sensitivity (SEN), specificity (SPE), area under curve (AUC), true positive (TP), true negative (TN), false positive (FP), and false negative (FN), with a prediction of 20 minutes. Performance compared between that of CGM (current reading), CGM* algorithm with features from the CGM, and CGM+HRV algorithm with features from both CGM and HRV.
Figure 3.
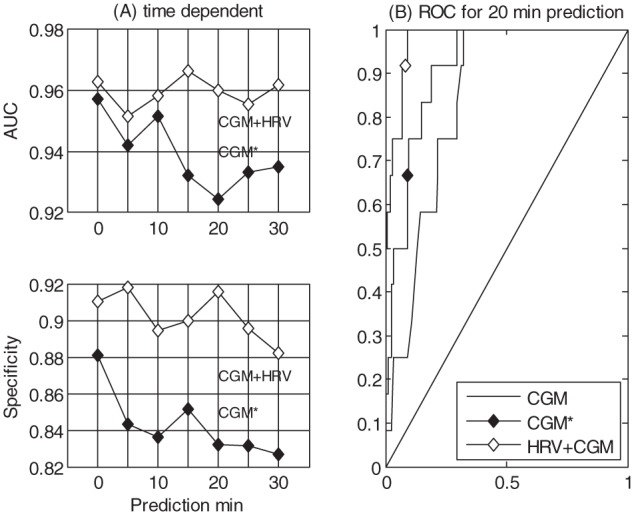
The left side (A) shows the performance (ROC, AUC, and specificity) of models ii and iii as a function of prediction time, such that a prediction of 30 minutes will give a 30-minute forecast. The right side (B) shows the ROC for the 3 models with a 20-minute prediction (i, ii, iii).
Discussion
We have recently shown how the combination of information from CGM and HRV can be used to construct an algorithm for prediction and detection of insulin induced hypoglycemia in bed-bound patients with T1D.14 Accordingly, the next step was to investigate whether this approach could be used successfully in daily living and during spontaneous hypoglycemia. To this end, we used 63 days of data based on CGM, self-monitoring of blood glucose, and a Holter device from 21 T1D patients in high risk of hypoglycemia. The results suggested that CGM without analyzing software was unable to predict hypoglycemia, whereas the combination of CGM and “smart” algorithms has the potential to serve as a clinically relevant hypoglycemic alarm system. Thus, our results demonstrated that combining information from CGM and HRV yielded a significantly higher performance compared to data based solely on the CGM.
Others have suggested several approaches to predict hypoglycemic events and with varying results.7-10,22-24 Eren-Oruklu et al25 have reported a sensitivity of 89%, a precision of 78%, and a lead time of 27 minutes when applying a hypoglycemic threshold of 60 mg/dL and a prediction interval of 30 min. Moreover, Georga et al23 studied 15 patients in free-living conditions and reported a sensitivity of up to 96%, but without reporting the number of false positives. The present data showed both a high sensitivity (100%) and specificity (91%) compared to previous studies. However, we acknowledge that it is difficult to compare such studies head-to-head. Most studies do not consider the underlying plasma glucose value and they are using the CGM data to define periods with and without hypoglycemia. It is well-known that CGM produces a physiological lag time and moreover a lesser precision in the lower glucose concentration range.26-28 Bode et al tested the accuracy of the CGM system used in our study by comparing home blood glucose meter readings with CGM meter readings.29 With a hypoglycemic threshold of 3.9 mmol/l (70 mg/dl), the system had a sensitivity of 67%, a specificity of 90%, and a false alarm rate of 47%. This clearly demonstrates the need for improving the accuracy of a CGM alarm system and why CGM data when used alone are poor predictors of hypoglycemia. Moreover, in the development of a successful closed-loop artificial pancreas system, improvements in CGM accuracy and reliability are needed.30,31 In a future perspective, incorporating information from HRV could be a means to improving accuracy and reliability for closed-loop systems.
We used single patient-based measurements of blood glucose (SMG) as the reference for our study (ie, the truth glucose value); SMG data were drawn from vein plasma glucose and SMBG. Vein measurements is the golden standard and SMBG has a generally high precision.32 The disadvantage of this approach is that we only know the glucose level at 1 point in time and therefore not the precise start of a hypoglycemic event.
The present study used automatic detection of R-peak on single-lead ECG, which carries the possibility of inaccuracy, although we sought to reduce this risk by reviewing all measurements manually. Moreover, many sequences were excluded due to a noisy ECG, but this is a well-known challenge when applying Holter devices in free-living patients. In a future perspective, this challenge should be addressed in more detail. Many new and robust algorithms have been developed since the article by Pan and Tompkins was published in 1985,19 so the knowledge for improving the automated detection of R-peaks is present. In addition, the method of collecting the ECG could be improved by addressing electrode design and body placement and combining the CGM device with ECG electrodes/electronics.
Conclusion
The present data suggest that the integration of data obtained by HRV and CGM holds useful information in constructing an applicable and pragmatic alarm system for prediction of hypoglycemia in patients with diabetes.
Footnotes
Abbreviations: AUC, area under the curve; CGM, continuous glucose monitoring; HRV, heart rate variability; ROC, receiver operating characteristic; SMG, single measurement of glucose; T1D, type 1 diabetes.
Declaration of Conflicting Interests: The author(s) declared the following potential conflicts of interest with respect to the research, authorship, and/or publication of this article: The algorithm used in this article was developed by Medicus Engineering. SLC and J Fleischer are consultants for Medicus Engineering.
Funding: The author(s) disclosed receipt of the following financial support for the research, authorship, and/or publication of this article: This work was supported by funding from Novo Nordisk A/S.
References
- 1. Cryer P, Davis S, Shamoon H. Hypoglycemia in diabetes. Diabetes Care. 2003;26:1902-1912. [DOI] [PubMed] [Google Scholar]
- 2. Parekh B. The mechanism of dead-in-bed syndrome and other sudden unexplained nocturnal deaths. Curr Diabetes Rev. 2009;4(5):210-215. [DOI] [PubMed] [Google Scholar]
- 3. Leese G, Wang J, Broomhall J. Frequency of severe hypoglycemia requiring emergency treatment in type 1 and type 2 diabetes: a population-based study of health service resource use. Diabetes Care. 2003;26:1176-1180. Available at: http://care.diabetesjournals.org/content/26/4/1176.short. Acces-sed November 18, 2013. [DOI] [PubMed] [Google Scholar]
- 4. Diabetes Control and Complications Trial Research Group. The effect of intensive treatment of diabetes on the development and progression of long-term complications in insulin-dependent diabetes mellitus. New Engl J Med. 1993;329:977-986. Available at: http://journals.lww.com/retinajournal/Abstract/1994/14030/The_Effect_of_Intensive_Treatment_of_Diabetes_on.22.aspx. Accessed May 5, 2014. [DOI] [PubMed] [Google Scholar]
- 5. Donnelly LA, Morris AD, Frier BM, et al. Frequency and predictors of hypoglycaemia in Type 1 and insulin-treated type 2 diabetes: a population-based study. Diabet Med. 2005;22(6):749-755. Available at: http://www.ncbi.nlm.nih.gov/pubmed/15910627. [DOI] [PubMed] [Google Scholar]
- 6. Feltbower R, Bodansky H. Complications and drug misuse are important causes of death for children and young adults with type 1 diabetes results from the Yorkshire Register of Diabetes. Diabetes Care. 2008;31(5):922-926. [DOI] [PubMed] [Google Scholar]
- 7. Jensen MH, Christensen TF, Tarnow L, Seto E, Dencker Johansen M, Hejlesen OK. Real-time hypoglycemia detection from continuous glucose monitoring data of subjects with type 1 diabetes. Diabetes Technol Ther. 2013;15(7):1-6. [DOI] [PubMed] [Google Scholar]
- 8. Skladnev VN, Tarnavskii S, McGregor T, Ghevondian N, Gourlay S, Jones TW. Hypoglycemia alarm enhancement using data fusion. J Diabetes Sci Technol. 2010;4(1):34-40. [DOI] [PMC free article] [PubMed] [Google Scholar]
- 9. Palerm CC, Bequette BW. Hypoglycemia detection and prediction using continuous glucose monitoring-a study on hypoglycemic clamp data. J Diabetes Sci Technol. 2007;1(5):624-629. [DOI] [PMC free article] [PubMed] [Google Scholar]
- 10. Wolpert HA. Use of continuous glucose monitoring in the detection and prevention of hypoglycemia. J Diabetes Sci Technol. 2007;1(1):146-150. [DOI] [PMC free article] [PubMed] [Google Scholar]
- 11. Koivikko ML, Tulppo MP, Kiviniemi AM, et al. Autonomic cardiac regulation during spontaneous nocturnal hypoglycemia in patients with type 1 diabetes. Diabetes Care. 2012;35(7):1585-1590. [DOI] [PMC free article] [PubMed] [Google Scholar]
- 12. Fleischer J. Diabetic autonomic imbalance and glycemic variability. J Diabetes Sci Technol. 2012;6(5):1207-1215. [DOI] [PMC free article] [PubMed] [Google Scholar]
- 13. Malik M. Guidelines heart rate variability. Eur Hear J. 1996;354-381. [Google Scholar]
- 14. Cichosz SL, Frystyk J, Hejlesen OK, Tarnow L, Fleischer J. A novel algorithm for prediction and detection of hypoglycemia based on continuous glucose monitoring and heart rate variability in patients with type 1 diabetes [published online ahead of print March 31, 2014. J Diabetes Sci Technol. [DOI] [PMC free article] [PubMed] [Google Scholar]
- 15. Zhang J. Effect of age and sex on heart rate variability in healthy subjects. J Manipulative Physiol Ther. 2007;30(5):374-379. [DOI] [PubMed] [Google Scholar]
- 16. Antelmi I, de Paula RS, Shinzato AR, Peres CA, Mansur AJ, Grupi CJ. Influence of age, gender, body mass index, and functional capacity on heart rate variability in a cohort of subjects without heart disease. Am J Cardiol. 2004;93(3):381-385. [DOI] [PubMed] [Google Scholar]
- 17. Cichosz SL, Fleischer J, Hoeyem P, et al. Assessment of postprandial glucose excursions throughout the day in newly diagnosed type 2 diabetes. Diabetes Technol Ther. 2012;15(1):78-83. [DOI] [PubMed] [Google Scholar]
- 18. Christensen TF, Tarnow L, Randløv J, et al. QT interval prolongation during spontaneous episodes of hypoglycaemia in type 1 diabetes: the impact of heart rate correction. Diabetologia. 2010;53(9):2036-2041. [DOI] [PubMed] [Google Scholar]
- 19. Pan J, Tompkins WJ. A real-time QRS detection algorithm. IEEE Trans Biomed Eng. 1985;32(3):230-236. Available at: http://www.ncbi.nlm.nih.gov/pubmed/3997178. Accessed May 7, 2014. [DOI] [PubMed] [Google Scholar]
- 20. American Diabetes Association. Defining and reporting hypoglycemia in diabetes. Diabetes Care. 2005;28(5):1245-1249. [DOI] [PubMed] [Google Scholar]
- 21. Christensen TF, Cichosz SL, Tarnow L, et al. Hypoglycaemia and QT interval prolongation in type 1 diabetes—bridging the gap between clamp studies and spontaneous episodes. J Diabetes Complications. 2014;28:723-728. [DOI] [PubMed] [Google Scholar]
- 22. Tsalikian E, Kollman C. GlucoWatch® G2™ Biographer (GW2B) alarm reliability during hypoglycemia in children. J Diabetes Sci Technol. 2004;6(5):559-566. [DOI] [PMC free article] [PubMed] [Google Scholar]
- 23. Georga EI, Protopappas VC, Ardigò D, Polyzos D, Fotiadis DI. A glucose model based on support vector regression for the prediction of hypoglycemic events under free-living conditions. Diabetes Technol Ther. 2013;15(8):634-643. [DOI] [PubMed] [Google Scholar]
- 24. Eren-Oruklu M, Cinar A, Quinn L, Smith D. Estimation of future glucose concentrations with subject-specific recursive linear models. Diabetes Technol Ther. 2009;11(4):243-253. [DOI] [PMC free article] [PubMed] [Google Scholar]
- 25. Eren-Oruklu M, Cinar A, Quinn L. Hypoglycemia prediction with subject-specific recursive time-series models. J Diabetes Sci Technol. 2010;4(1):25-33. [DOI] [PMC free article] [PubMed] [Google Scholar]
- 26. Damiano E, El-Khatib F. A comparative effectiveness analysis of three continuous glucose monitors. Diabetes Care. 2013;36:251-259 [DOI] [PMC free article] [PubMed] [Google Scholar]
- 27. Garg SK, Voelmle M, Gottlieb PA. Time lag characterization of two continuous glucose monitoring systems. Diabetes Res Clin Pract. 2010;87(3):348-353. [DOI] [PubMed] [Google Scholar]
- 28. Bay C, Kristensen PL, Pedersen-Bjergaard U, Tarnow L, Thorsteinsson B. Nocturnal continuous glucose monitoring: accuracy and reliability of hypoglycemia detection in patients with type 1 diabetes at high risk of severe hypoglycemia. Diabetes Technol Ther. 2013;15(5):371-377. [DOI] [PubMed] [Google Scholar]
- 29. Bode B, Gross K, Rikalo N. Alarms based on real-time sensor glucose values alert patients to hypo-and hyperglycemia: the guardian continuous monitoring system. Diabetes Technol Ther. 2004;6(2):105-113. [DOI] [PubMed] [Google Scholar]
- 30. Keenan DB, Grosman B, Clark HW, et al. Continuous glucose monitoring considerations for the development of a closed-loop artificial pancreas system. J Diabetes Sci Technol. 2011;5(6):1327-1336. Available at: http://dst.sagepub.com/lookup/doi/10.1177/193229681100500603. Accessed July 1, 2014. [DOI] [PMC free article] [PubMed] [Google Scholar]
- 31. Weinstock RS. Closing the loop: another step forward. Diabetes Care. 2011;34(9):2136-2137. Available at: http://www.pubmed-central.nih.gov/articlerender.fcgi?artid=3161254&tool=pmcentrez&rendertype=abstract. Accessed July 1, 2014. [DOI] [PMC free article] [PubMed] [Google Scholar]
- 32. Kuo CY, Hsu CT, Ho CS, Su TE, Wu MH, Wang CJ. Accuracy and precision evaluation of seven self-monitoring blood glucose systems. Diabetes Technol Ther. 2011;13(5):596-600. [DOI] [PubMed] [Google Scholar]