

Abstract
Cholesterol modulates the plasmalemma’s biophysical properties and influences the function and trafficking of membrane proteins. A fundamental phenomenon that remains obscure is how the plasmalemma’s lipid composition regulates the activatable pool of membrane receptors. An outstanding model to study this phenomenon is the nicotinic acetylcholine receptor (nAChR), since the nAChR activatable pool has been estimated to be but a small fraction of the receptors present in the plasmalemma. Studies on the effect of cholesterol depletion in the function of the Torpedo californica nAChR, using the lipid-exposed nAChR mutation (αC418W) that produces a congenital myasthenic syndrome (CMS), demonstrated that cholesterol depletion causes a remarkable increase in the αC418W nAChR’s macroscopic current whereas not in the wild-type (WT). A variety of approaches were used to define the mechanism responsible for the cholesterol depletion mediated-increase in the αC418W nAChR’s macroscopic current. The present study suggests that a substantial fraction of the αC418W nAChRs is located in caveolin-1-positive domains, “trapped” in a non-activatable state, and that membrane cholesterol depletion results in the relocation of these receptors to the activatable pool. Co-fractionation and co-immunoprecipitation of the αC418W nAChR and the membrane raft protein caveolin-1 (cav1) support the notion that interactions at lipid-exposed domains regulate the partition of the receptor into membrane raft microdomains. These results have potential implications as a novel mechanism to fine-tune cholinergic transmission in the nervous system and in the pathogenesis associated to the αC418W nAChR.
Keywords: nicotinic acetylcholine receptor, lipid-exposed transmembrane domains, congenital myasthenic syndrome, membrane rafts, caveolin
Introduction
The nicotinic acetylcholine receptor (nAChR) belongs to the superfamily of the ligand-gated ion channels which are of fundamental importance in the chemical synaptic transmission throughout the nervous system. The nAChR is a cation-selective ion channel composed of four homologous membrane-spanning subunits, namely α, β, ε (γ in the Torpedo californica nAChR) and δ in a 2:1:1:1 ratio. Each subunit contains a large hydrophilic extracellular N-terminal, four putative transmembrane domains (M1–M4), a large cytoplasmic loop between the M3 and M4, and a short extracellular C-terminal. The M1 and M2 domains form the ion channel pore,7,8 whereas the M3 and M4 domains have the largest contact with the membrane lipids9 and are distant from the ion channel pore and the ligand binding sites. Defects in the nAChR function could affect the transmission of nerve signals across synapses and cause pathological diseases such as the congenital myasthenic syndromes (CMS). The novel nAChR mutation (αC418W), located in the M4 domain, is the first lipid-exposed mutation that has been shown to produce a CMS in a patient.12
The nAChR has been extensively used as a model in the study of lipid-protein interactions. Previously, we reported the functional implications following cholesterol depletion of Xenopus laevis oocytes expressing the wild-type (WT) and the αC418W nAChRs.13 Cholesterol depletions, achieved using a 50 μM methyl-β-cyclodextrin (MβCD) incubation procedure, produced a 67% increase [p value = 0.0032, two-tailed, unpaired t-test, n = 12 (control); n = 22 (MβCD)] in peak current in the αC418W nAChR compared to a less than 5% increase in the WT nAChR.13 These results raised questions on the mechanism by which the membrane cholesterol levels selectively influences the function of the αC418W nAChR. We hypothesized that the observed increase in peak current could be due to one or a combination of at least three factors: (i) changes in the single-channel conductance, (ii) altered kinetics and (iii) increased number of activatable receptors. The objective of the present study was to define the contribution from each of these three factors in the increase of the αC418W nAChR peak current upon cholesterol depletion in search for a potential underlying mechanism.
We used a variety of approaches to define the mechanism by which cholesterol depletion selectively increases the αC418W nAChR peak current compared to the WT nAChR. The voltage clamp technique was used to monitor the increases in peak current due to cholesterol depletion.13 Upon cholesterol depletion, we recorded single-channel activity on oocytes expressing the αC418W receptor using the patch clamp technique. Confocal microscopy subcellular fractionation using sucrose density gradients in the presence of detergent and co-immunoprecipitation experiments were used to examine the localization of the receptor in the plasmalemma of Xenopus laevis oocytes.
The present study suggests that a fraction of the αC418W nAChR is located in reservoirs of receptors associated with the plasma membrane and trapped in a non-activatable state. Our data is consistent with the notion that these reservoirs of receptors contain nAChRs aggregated in cholesterol-dependent, cav1-positive caveolae (CAV) membrane rafts. CAV are specialized membrane rafts typically characterized by their flask-shaped morphology, yet heterogenous subcellular morphologies are also recognized. They are rich in cholesterol, sphingolipids and caveolins, which serve as their main structural protein component.15 Caveolins are ubiquitously found in mammals, but they have also been found in other animals, including Xenopus laevis, Fugu rubripes and Caenoshabditis elegans.15 Cholesterol depletion has been shown to disrupt membrane rafts.16 Our results suggest that the cholesterol depletion-mediated rupturing of membrane rafts leads to the relocation of the αC418W nAChR to the bulk membrane and become capable of achieving activation. These results provide a novel and plausible mechanism by which lipid-protein interactions affect the heterogeneous expression of the nAChR with potential implications in the pathogenesis of a CMS.
Results
Oocyte membrane lipid composition
The lipid composition of Xenopus laevis oocyte’s plasma membranes was monitored upon cholesterol depletion to assess the possibility of changes in the membrane phospholipid acyl chain composition as a consequence of 50 μM MβCD incubations. Figure 1B demonstrates that upon incubation of the Xenopus laevis oocytes in MβCD for 45 min, the phospholipid acyl chains present in the plasma membrane of Xenopus laevis oocytes did not significantly vary compared to the control experiments (without MβCD), whereas the same MβCD incubation reduced the membrane cholesterol content 18% compared to the controls (Fig. 1A). Therefore, MβCD incubations did not produce changes in the oocytes plasma membrane phospholipid acyl chain composition while significantly reducing the membrane cholesterol content. These results are consistent with previous work showing that MβCD does not affect membrane integrity at concentrations lower than 15 mM19,20 which is 300-fold higher than the concentration used for these experiments.
Figure 1.
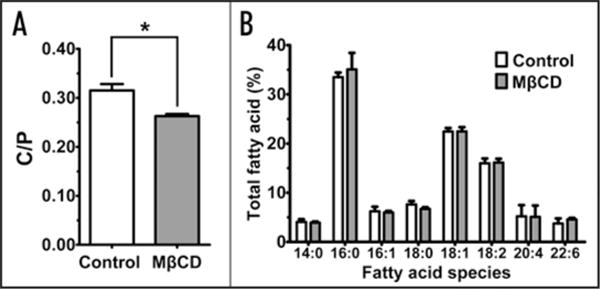
MβCD incubations selectively deplete membrane cholesterol in Xenopus laevis oocytes. (A) 50 μM MβCD 45 min incubations significantly reduces the cholesterol/phospholipid molar ratio (C/P) in the plasma membrane of Xenopus laevis oocytes without affecting the membrane fatty acid composition derived from phospholipid hydrolysis (B). 540 oocytes from three batches were used in these experiments. Values are expressed as the percent of each fatty acid of the total free and esterified fatty acids in the phospholipids. Experiments were performed in triplicate. *p = 0.0434, two-tailed, paired t-test.
Cholesterol depletion effects on nAChR kinetic behavior
Figure 2A shows a typical experiment in which depletion of 18% of the membrane cholesterol produced a 41% increase in peak current in the αC418W nAChR, but not in the control experiment. To assess the mechanism responsible for the increase in peak current, patch clamp experiments in the cell-attached configuration were performed. Single-channel currents elicited by 4 uM ACh demostrate that membrane cholesterol depletion does not modify the mean open time (2.97 ms) when compared to control experiments (2.91 ms) (Fig. 2B). In addition, single-channel currents elicited by 100 μM ACh were fitted to a simple kinetic model (Table 1) using a maximum likelihood fitting algorithm. We found no significant differences in the αC418W nAChR kinetic parameters estimated after cholesterol depletion when compared to control experiments. Figure 3A and B shows current traces of individual bursts elicited by 100 μM ACh and their respective mean open and closed time distribution histograms. The open probability (Popen), which is defined as the fraction of time the ion-channel remains in the open state within a burst, was determined to be 0.90 regardless of the oocyte membrane’s cholesterol content (see Table 1). Similarly, cholesterol depletion did not have any effect on either the effective opening rate (β) or the effective closing rate (α). That is, after cholesterol depletion α and β were 2,198 s−1 and 23,716 s−1, whereas in the control experiments these constants were calculated to be 2,547 s−1 and 23,010 s−1, respectively. Thus, the effective biliganded open channel equilibrium constants (Θ) were very similar: 10.8 upon cholesterol depletion and 9.0 in the control experiment. Moreover, the estimated burst durations were not affected by the oocyte membrane’s cholesterol level: 156 ms after cholesterol depletion, and 167 ms when the cholesterol levels were not changed. In summary, cholesterol depletion did not alter the kinetic parameters of the αC418W nAChR; therefore, the observed increase in peak current could not be explained by a gain in functional response.
Figure 2.
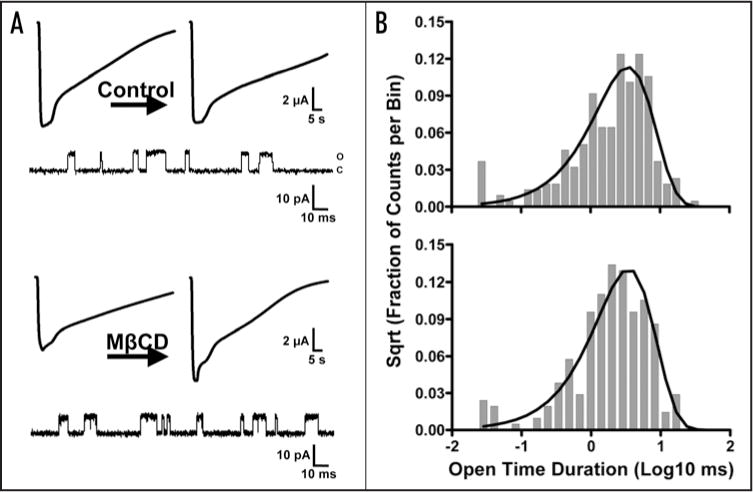
Cholesterol depletion effects on the αC418W nAChR macroscopic response and single-channel mean open time duration. (A) Typical experiment showing macroscopic currents recorded from oocytes expressing the αC418W nAChR and briefly exposed to 100 μM ACh and their corresponding single-channel currents elicited by 4 μM ACh. Incubation in MOR2 buffer did not produce any change in macroscopic response (the left current trace has a peak current of 10,250 nA and the right current trace has a peak current of 9,984 nA) whereas 50 μM MβCD incubation resulted in a 41% increase in macroscopic current (the left current trace has a peak current of 7,743 nA and the right current trace has a peak current of 10,900 nA). (B) Open time duration histograms generated from the single-channel currents displayed in (A) reveal that cholesterol depletion does not produce changes in the mean open time of the αC418W nAChR (τ = 2.91 ms in the upper histogram and 2.97 ms in the histogram presented in the bottom). Patches/events: 3/2,462 (MOR2); 3/3,513 (MβCD).
Table 1.
Kinetic parameters of the αC418W nAChR expressed in Xenopus laevis oocytes as a function of membrane cholesterol depletion
|
| ||||||||
|---|---|---|---|---|---|---|---|---|
| Incubation | Patches/events | Bursts | β (s−1) | α (s−1) | Θ | τB (ms) | Popen | |
| Control | 3/29,983 | 60 | 23,010 ± 213 | 2,547 ± 24 | 9.0 | 167 | 0.90 | |
| MβCD | 3/80,877 | 338 | 23,716 ± 226 | 2,198 ± 14 | 10.8 | 156 | 0.90 | |
Single-channel currents were recorded in cell-attached patches at a holding potential of −100 mV, 22°C and at a sampling rate of 50 kHz. Θ is the diliganded channel open equilibrium constant, corresponding to the ratio of the opening and closing diliganded rate constants (± STD). Values are the result of fitting our model to the data obtained at 100 μM ACh. τB corresponds to the mean burst duration. In this scheme of the proposed kinetic model, R is the receptor, A is ACh, A2R is the bi-liganded species, A2R* is the bi-liganded open-state of the receptor-ligand complex, k+1 and k+2 are the binding rate constants and k−1 and k−2 the first and second dissociation rate constants for the first and second site, respectively. α is the closing rate constant and β is the opening rate constant.
Figure 3.
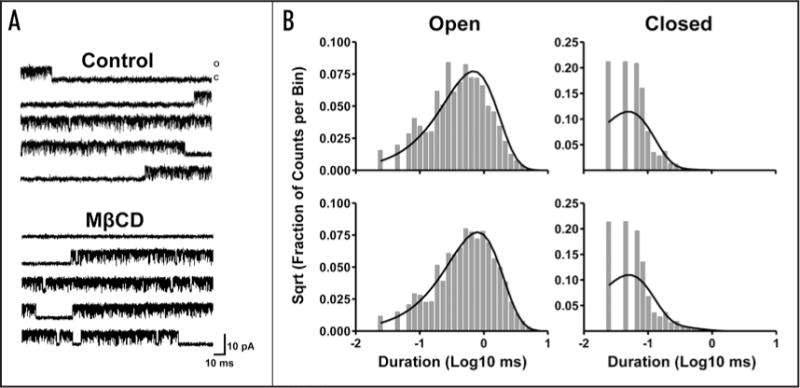
Cholesterol depletion effects on the αC418W nAChR single-channel kinetics. (A) Bursts of single-channel activity elicited by 100 μM ACh. Recordings were made from Xenopus laevis oocytes expressing the αC418W nAChR and incubated in MOR2 buffer or 50 μM MβCD. (B) Corresponding open and closed time duration histograms and fitted probability density functions. Patches/events: 3/29,983 (MOR2); 3/80,877 (MβCD). The results are summarized in Table 1.
Cholesterol depletion effects on nAChR conductance
To obtain a current-voltage relationship, the membrane potential was rapidly changed from the holding potential to a series of values generated between −60 and −140 mV, each differing by 20 mV. Figure 4A displays single-channel currents of the αC418W nAChR elicited at low agonist concentration (4 μM), different membrane potentials and under normal or reduced cholesterol levels. The amplitudes of the single-channel currents were determined using the QuB software and linear regressions performed using the GraphPad Prism 4 software. The slopes of the lines obtained in such I–V plots correspond to the conductance of the ion-channels. Figure 4B displays I–V plots generated using the amplitudes of single-channel currents of the αC418W nAChR with normal and reduced cholesterol levels. The calculated conductance values were (71 ± 4) pS and (72 ± 3) pS for the αC418W nAChR under reduced and normal cholesterol levels, respectively [p = 0.8340, Analysis of Covariance (ANCOVA), patches/events = 3/3422 (MOR2); 3/3491 (MβCD)]. These results suggest that the increase in peak current observed upon cholesterol depletion is not due to an increase in ion-channel conductance.
Figure 4.
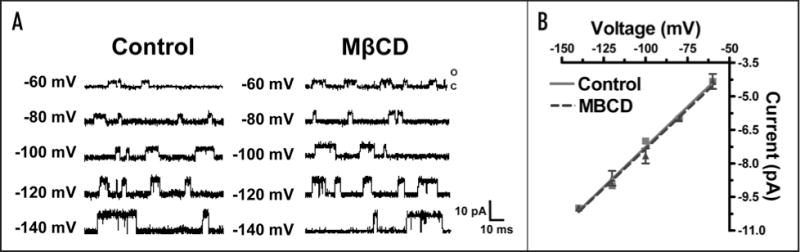
Cholesterol depletion effects on the αC418W nAChR single-channel conductance. (A) Single-channel currents elicited by 4 μM ACh and recorded from oocytes expressing the αC418W nAChR at various membrane potentials and incubated in MOR2 buffer or MβCD. (B) Current-voltage relationships generated using the single-channel data displayed in (A) reveal that the cholesterol depletion of Xenopus laevis oocytes does not modify the αC418W nAChR single-channel conductance [Control (72 ± 3) pS, MβCD (71 ± 4) pS, mean ± SEM, p = 0.8340, Analysis of Covariance (ANCOVA), patches/events = 3/3422 (MOR2); 3/3491 (MβCD)]. (A color version of this figure is available online.)
Aggregation of nAChRs into clusters
The WT and αC418W nAChRs expressed in Xenopus laevis oocytes were labeled with the α-bungarotoxin (α-BTX) Alexa Fluor 488® fluorescent conjugate to assess the distribution of the receptors in the oocyte’s plasma membrane. Images were acquired at a magnification of 63X on a Zeiss LSM 510 Confocal Microscope as a series of optical slices along the Z-axis (Z-stack) (Suppl. Fig. S1A). Figure 5A shows a single optical slice, typical of Alexa Fluor 488® α-BTX-labeled WT and αC418W nAChRs, which captures the fluorescence emitted below the oocyte’s plasma membrane surface. The surface of the oocyte in these experiments was easily identified as the focal plane at which the fluorescence originating from the α-BTX-labeled nAChRs displayed a homogeneous distribution. As displayed in Figure 5A, clusters of receptors characterized by their high fluorescence intensity, appeared in focal planes beyond the focal plane corresponding to the membrane surface. Furthermore, 3-D projections of the collection of optical slices acquired across the Z-axis of typical individual clusters revealed what appeared to be invagination and vesicle-like morphologies (Fig. 5A, central and right). Supplementary Figure S1 pictorially illustrates the construction of the aforementioned 3-D projections. These invaginations and vesicular bodies are present in oocytes expressing the WT and αC418W nAChRs, however, measurement of the cluster sizes using the Image J program (see Materials and Methods) revealed that the clusters formed by the αC418W nAChR are 2.12-fold bigger than those formed by the WT nAChR (Fig. 5B and C). In addition, determining the number of clusters per area revealed that the clusters formed by the αC418W nAChR are 2.04-fold more densely distributed than those formed by the WT nAChR (Fig. 5B and C). These differences in expression patterns were further investigated as a possible cause for the differences in the effect that membrane cholesterol levels have in the peak currents of the WT and αC418W nAChRs. Indeed, using the same procedure, we studied how cholesterol depletion affects the sizes of the clusters formed by the WT and αC418W nAChRs. This analysis revealed that, upon cholesterol depletion, only in the clusters formed by the αC418W nAChR was there a considerable [however not statistically significant, p = 0.0975, two-tailed, paired t-test analysis, circular inserts/clusters: 4/350 (prior to incubation); 4/172 (MβCD)] reduction in cluster size (28%) (data not shown). We also evaluated the possibility that cholesterol depletion could reduce the number of clusters per area. Indeed, we found that upon membrane cholesterol depletion in Xenopus laevis oocytes expressing the αC418W nAChR, the number of nAChR clusters per μm2 was reduced 50% [p = 0.0266, two-tailed, paired t-test, circular inserts/clusters: 4/350 (prior to incubation); 4/172 (MβCD)] whereas in the clusters formed by the WT nAChR no change in the number of clusters per area was observed [p = 0.8135, two-tailed, paired t-test, circular inserts/clusters: 4/308 (prior to incubation); 4/290 (MβCD)]. Control experiments (without MβCD) were performed, and no significant changes in the number of clusters per area were determined [WT: p = 0.5440, two-tailed, paired t-test, circular inserts/clusters: 4/377 (prior to incubation); 4/406 (MOR2); αC418W: p = 0.1855; two-tailed, paired t-test, circular inserts/clusters: 4/434 (prior to incubation); 4/350 (MOR2)] (Fig. 6). These results demonstrate that the clusters formed by the αC418W nAChR are both larger and more densely distributed in the Xenopus laevis oocyte’s plasma membrane, and suggests that the clusters formed by the αC418W nAChR are more sensitive to cholesterol levels.
Figure 5.
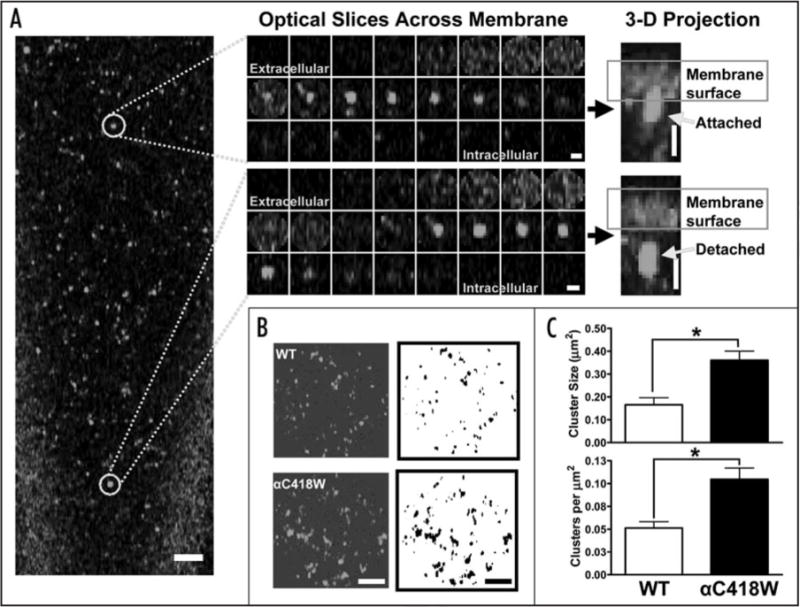
Aggregation of the nAChR into clusters. (A) Single optical slice of Alexa 488®-labeled nAChR in Xenopus laevis oocytes display the aggregation of ion-channel proteins. Optical slices across the membrane, each separated by 0.35 μm, of individual clusters (central) demonstrate that nAChR clusters extend below the membrane surface forming two types of structures. The transversal view of 3-D projections of individual clusters reveal that the nAChR clusters seem to be attached to the membrane surface, forming an invagination, or detached from the surface. Scale bars are 5 μm in the left, 1 μm in the insets and 2 μm in the 3-D projections. The magnification used was 63X. (B) Circular inserts (Area = 314 μm2) display the Alexa 488®-labeled nAChR (WT and αC418W) with fluorescence intensities above a threshold (left). Corresponding Image J processing of the images in the left result in black and white versions which can be used to measure and count the clusters (right). Scale bar is 2 μm. (C) The mean nAChR cluster size resulted to be 2.12-fold bigger in the clusters formed by the αC418W nAChR [WT = (0.17 ± 0.03) μm2, αC418W = (0.36 ± 0.04) μm2, mean ± SEM, *p = 0.0013, two-tailed, unpaired t-test, circular inserts/clusters: 10/1,100 (WT); 7/1,439 (αC418W)], whereas the clusters formed by the αC418W nAChR are more densely distributed (2.04-fold) than the WT nAChR: [WT = 0.051 ± 0.007 clusters/μm2, αC418W = 0.104 ± 0.012 clusters/μm2, Mean ± SEM, *p = 0.0010, two-tailed, unpaired t-test, circular inserts/clusters: 10/1,100 (WT); 7/1,439 (αC418W)]. (A color version of this figure is available online.)
Figure 6.
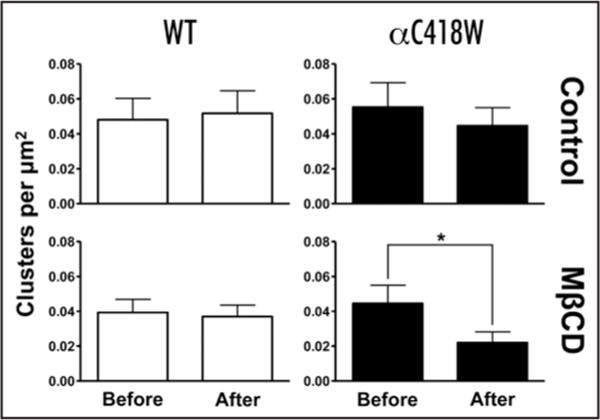
Cholesterol depletion effects on the number of nAChR clusters per area. The number of clusters per area (clusters/μm2) was determined before and after 50 μM MβCD or MOR2 buffer incubations as described in Materials and Methods. The number of clusters per area formed by the αC418W were reduced ~50% [p = 0.0266, two-tailed, paired t-test, circular inserts/clusters: 4/350 (prior to incubation); 4/172 (MβCD)] whereas in the WT nAChR no change was observed [p = 0.8135, two-tailed, paired t-test, circular inserts/clusters: 4/308 (prior to incubation); 4/290 (MβCD)] upon cholesterol depletion of the oocytes. Control experiments (without MβCD) displayed no significant changes in the number of clusters per area [WT: p = 0.5440, two-tailed, paired t-test, circular inserts/clusters: 4/377 (prior to incubation); 4/406 (MOR2); αC418W: p = 0.1855; two-tailed, paired t-test, circular inserts/clusters: 4/434 (prior to incubation); 4/350 (MOR2)].
Fractionation of membrane rafts
Western blot analyses of oocyte membrane fractions obtained using sucrose density gradients in the presence of Triton X-100 were performed using a previously published procedure (see Materials and Methods).25,26 Homogenates of oocytes plasma membranes expressing the αC418W nAChR solubilized in Triton X-100 and fractionated over 5–40% discontinuous sucrose density gradients demonstrated the presence of the αC418W nAChR in the light-density membrane raft fractions in which the Xenopus laevis oocytes caveolin immunoreactivity is present, while a 45 min incubation with 50 μM MβCD lead to a disruption of the light-density membrane raft fractions, causing a shift of the αC418W nAChR immunoreactivity from light to heavier density fractions of the gradients (Fig. 7A). These findings suggest that the MβCD-sensitive microdomain primarily corresponds to the membrane raft fraction.
Figure 7.
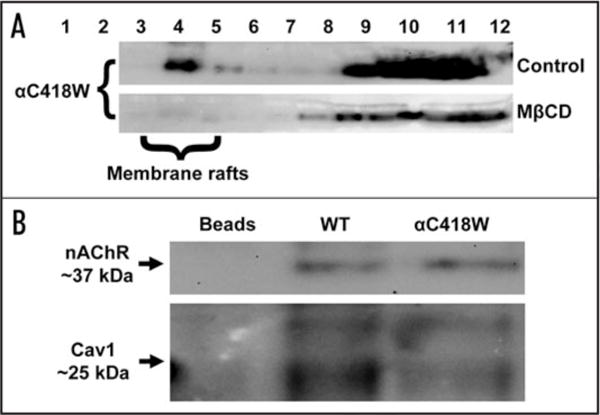
Co-fractionation and co-immunoprecipitation of the nAChR with cav1. (A) Sucrose density gradient fractions from Xenopus laevis oocytes expressing the αC418W nAChR. Fractionation of the nAChR in the light-density membrane raft microdomains (fractions 3–5) of the gradient is observed. MβCD treatment disrupts this light-density fraction leading to a redistribution of the receptor to higher density membrane fractions. (B) nAChR immunoreactivity is observed in immunoprecipitates obtained with a polyclonal antibody against cav1 coupled to Protein A immobilized on polyacrylic beads. Cav1 immunoreactivity (bottom) observed in the immunoprecipitates assayed for nAChR immunoreactivity reveals a more intense band in the oocytes expressing the WT nAChR. Indeed, the ratio between the amounts of co-precipitated nAChR to precipitated cav1 is 2.16-fold higher in the oocytes expressing the αC418W nAChR, which suggests that the amount of nAChR interacting with cav1 is higher in the oocytes expressing the αC418W nAChR. The lane labeled as Beads represents a negative control (cav1 antibody coupled to Protein A immobilized on polyacrylic beads in the absence of membranes isolated from Xenopus laevis oocytes). Experiments were performed in triplicate.
Co-immunoprecipitation experiments
To assess whether the nAChR and cav1, a membrane raft marker, form a physical complex, co-immunoprecipitation experiments were undertaken. Figure 7B shows detection of the WT and αC418W nAChRs in immunoprecipitates obtained with a polyclonal antibody against cav1 coupled to Protein A immobilized on polyacrylic beads. This is consistent with the notion that a physical interaction exists between cav1 and the nAChR. Furthermore, Cav1 immunoreactivity (Fig. 7B, bottom) observed in the same immunoprecipitates used to detect the nAChR immunoreactivity revealed a more intense band in the oocytes expressing the WT nAChR. Therefore, the ratio between the amounts of co-precipitated nAChR to precipitated cav1 is higher (2.16-fold) in oocytes expressing the αC418W nAChR. These results suggest that the amount of nAChRs physically interacting with cav1 is higher in the Xenopus laevis oocytes expressing the αC418W nAChR.
Discussion
The function of the Torpedo californica nAChR has been found to be regulated by membrane cholesterol levels.13,28 Depletion of the plasma membrane cholesterol in Xenopus laevis oocytes expressing the αC418W nAChR, which is the first lipid-exposed nAChR mutation known to produce a CMS in a patient, causes a dramatic increase in macroscopic current whereas in the WT nAChR, the same cholesterol depletion does not produce a significant change in macroscopic current.13 The macroscopic current, as determined by voltage clamp experiments, is a function of the number of activatable receptors in the membrane, as well as their single-channel kinetic behavior and conductance. It was therefore hypothesized that the reported increase in peak current, observed upon membrane cholesterol depletion of oocytes expressing the αC418W nAChR, was due to the influence of membrane cholesterol levels on the receptor’s kinetic behavior, conductance and/or the number of receptors capable of achieving activation in the oocyte’s plasmalemma.
Patch clamp experiments revealed no significant differences in the αC418W nAChR kinetic parameters (Table 1) or single-channel conductance upon membrane cholesterol depletion (Fig. 4). Consistent with the aforementioned results, the hypotheses suggesting that the observed increase in peak current of the αC418W nAChR upon cholesterol depletion was due to changes in the receptor’s kinetics or conductance were ruled out. Therefore, it was hypothesized that the number of receptors capable of achieving activation in the plasmalemma of Xenopus laevis oocytes was being raised as consequence of the membrane cholesterol depletion. Confocal microscopy experiments were performed in an attempt to reveal the possible source of these additional activatable receptors. The images presented in Figure 5A and B reveal that the fluorescence emitted by the Alexa Fluor 488® α-BTX-labeled nAChRs is aggregated into clusters located beneath the membrane surface. Indeed, 3-D projections in the Z-axis of the collection of optical slices acquired across the Z-axis of typical individual clusters generate transversal views of the 3-D objects generated through the projections. The aforementioned 3-D projections revealed the relative location of clusters with respect to optical slices displaying a homogenous distribution of fluorescence which are indicative of the membrane surface and that upon performing the 3-D projections in the Z-axis appear as a broad line of fluorescence. This broad line of fluorescence should not be assumed to represent a direct measure of the phospholipids bilayer thickness, however, it provides an estimate of the number of optical slices that can be viewed to contain some degree of homogeneous distribution of fluorescence along a Z-stack. We therefore used this information to assess the relative location of the clusters of fluorescence with respect to the membrane surface (Suppl. Fig. S1). The revealed relative location of clusters with respect to the location of the surface of the membrane reveal that these seem to be either attached or detached from the oocytes’s plasmalemma (Fig. 5A, central and right).
By measuring the sizes of the clusters and the number of clusters per area, it was determined that the clusters formed by the αC418W nAChR are bigger and more densely distributed than those formed by the WT nAChR. Moreover, cholesterol depletion resulted in a 50% reduction in the number of clusters formed by the αC418W nAChR per area whereas in those formed by the WT nAChR the same cholesterol depletion did not affect the number of clusters per area. These results are consistent with the notion of a cholesterol depletion-mediated rupture of the clusters formed by the αC418W nAChR. These results, taken together with the increase in peak current that accompanies the reduction in the cholesterol content in the plasmalemma of oocytes expressing the αC418W nAChR, suggest that the ruptures in the clusters formed by the αC418W nAChR leads to an increase in the number of activatable receptors in the plasmalemma with a concomitant increase in macroscopic current. In addition, membrane cholesterol depletion in oocytes expressing the WT nAChR does not produce an increase in macroscopic current as it does not produce changes in the clusters, thus providing further evidence on the relationship between cluster integrity and a potential increase in macroscopic current upon membrane cholesterol depletion.
Caveolin tightly binds cholesterol in a 1:1 ratio,29 an interaction shown to be critical for the maintenance of CAV structure and function.30 Figure 7A shows that a fraction of αC418W nAChRs are detected in light-density, detergent-insoluble (LDDI) membrane fractions (fractions 3–5) which are also positive for caveolin.27 Most importantly, the receptors are clearly present in the raft/caveolar fraction, and in other gradient fractions; yet, cholesterol depletion leads to a selective disruption of the LDDI membrane fraction and redistribution of the αC418W nAChR into higher density membrane fractions. These results are consistent with confocal microscopy double-labeling experiments in which cav1 and the nAChR were both labeled. These experiments suggest the co-localization of the WT and αC418W nAChRs with cav1 in the oocyte’s plasmalemma and the cluster structures described above (Suppl. Fig. S3).
Membrane rafts have been recently defined as small, heterogenous, highly dynamic, sterol- and sphingolipid-enriched domains that compartmentalize cellular processes and that can sometimes be stabilized to form larger platforms through protein-protein and protein-lipid interactions.31 This definition put together by consensus includes the caveolae as a member of the membrane raft family.31 Individual caveolae are too small to be individually imaged,31 however, protein clusters of sizes similar to those observed in this study are readily observable using confocal microscopy.32,33 Thus, due to the size of the clusters, these cav1-positive membrane raft domains could correspond to CAV-related structures such as: grape-like clusters of CAV, rosettes, caveosomes, detached vesicles/tubules or vesiculo-vacuolar organelles (VVOs) (clusters of CAV-like vesicles).34,35
The fraction of activatable nAChRs to the total number of surface α-BTX-nAChRs (both non-activatable and activatable) is much less than 1.0, suggesting the existence of non-activatable, yet assembled nAChRs in cell membranes.36 Classical electrophysiological recordings in skeletal muscle endplates clearly indicate that not all the nAChRs present in the endplates are activated by one quantum of ACh.37 In addition, the activatable nAChRs on chick ciliary ganglion neurons constitute only 10% of the total number of receptors.38 Because the non-activatable pool of receptors could actually be quite large, the relocalization of receptors from the non-activatable pool to the activatable pool has the potential to produce remarkable increases in peak currents. Along the same line, the present data is consistent with the notion of the existence of a pool of αC418W nAChRs which are not activated by the fast application of ACh (non-activatable pool) but become, nevertheless, capable of achieving activation upon membrane cholesterol depletion and thereby contribute to the αC418W nAChR activatable pool. The existence of such a non-activatable pool of receptors had been suggested in previous publications from our group.39,40 According to the present study, this reservoir of αC418W nAChRs which become recruited to the activatable pool by cholesterol depletion could reside in cav1-positive domains, which are biochemically-defined as MβCD-sensitive low-density LDDI membrane raft fractions, and immunocytochemically-defined as membrane microdomain structures seen as invaginations and vesicular bodies. The effects of MβCD on the oocyte’s plasmalemma are very specific in terms of cholesterol removal, disruption of cav1 positive clusters, and disruption of LDDI membrane fractions. These actions provide a biochemical and subcellular basis for the effect of cholesterol removal, which leads to an increase in the peak current of the αC418W nAChR, without affecting its single-channel kinetics or conductance. Altogether, these results are consistent with the notion that the activatable pool of the αC418W nAChR could be regulated by membrane cholesterol.
A fundamental question that arises as a consequence of these studies is: Why is the αC418W nAChR associated with these cav1-positive domains? One hypothesis is that the introduction of the hydrophobic side chain of the tryptophan residue, with its 89% larger surface area (Suppl. Fig. S4) as opposed to the polar side chain of cysteine, facilitates the interaction of the nAChR with the densely packed hydrophobic environment characteristic of liquid-ordered phases present in membrane rafts. This hypothesis is supported by studies on the preferential interaction of cholesterol and aromatic amino acid residues such as tryptophan.41,42 Another hypothesis is that, as a consequence of the C to W substitution, this lipid-exposed nAChR mutation favors partitioning of the receptor into membrane rafts by the introduction of a caveolin-binding motif (CBM). Consensus CBMs have been established with the following sequences: φXφXXXXφ and φXXXXφXXφ; in which φ is an aromatic residue (W, F or Y) and X is any amino acid.43 These motifs are present in most caveolae-associated proteins. Variations where one to two apolar amino acids (leucine, isoleucine, valine) may substitute the aromatic residues have also been reported in the analysis of G-proteins and G-protein coupled receptor kinases (GRK).44,45 In the αC418W nAChR, we identified a region within the hydrophobic stretch of the transmembrane domain sequence (WIIGTVSVFA, residues 418–426) with a functional CBM (as determined by co-immunoprecipitation experiments, Fig. 7B). This CBM is formed when the cysteine in position 418 is replaced by tryptophan and is therefore absent in the WT nAChR.
The formation of putative CBMs by the incorporation of the tryptophan residue at lipid-exposed domains could account for the reduced normalized maximum response previously reported for nAChR mutations.39,46–48 The normalized maximum response corresponds to the maximum current (Imax) divided by the total number of receptors as determined by 125I-labaled α-BTX binding assays. Therefore, if only a fraction of the total number of receptors contributes to the activatable pool, then Imax will be lower than expected, resulting in a decreased normalized maximum response. It is feasible that the localization of mutant nAChRs in cav1-positive domains, favored by the introduction of CBMs, could account for the decreased Imax in the nAChR mutations. Indeed, changes in nAChR macroscopic response caused by the incorporation of the tryptophan residue could be accounted for by alterations in the partitioning of the receptors into membrane rafts as consequence of the formation of CBMs.
The proposed mechanism to explain the increase in peak current in the αC418W nAChR was indirectly deduced from our results. A more direct approach would be, for instance, to exclusively probe the functionality of the receptors located in the clusters of nAChRs. However, such an experiment would be at best technically challenging if not unfeasible. In the absence of such direct evidence, our proposed model emerges as the most plausible explanation for the data. Alternative models for the increase in the αC418W nAChR peak current may include the effect of cholesterol depletion on membrane fluidity. However, this scenario would not exclude the proposed mechanism. Indeed, the effect of the high cholesterol concentrations typical of membrane rafts on membrane fluidity may explain why αC418W nAChRs would not be necessarily activatable when located in membrane rafts. Nevertheless, the proposed model leads to interesting and testable predictions. For example, the αC418W nAChR is the first lipid-exposed nAChR mutation that has been found to produce a CMS in a patient and according to Shen et al., the pathology of this nAChR is most likely due to its abnormal kinetic behavior.12 The results from the present study raise the possibility that the favored aggregation of the αC418W nAChR into the cholesterol-sensitive clusters of receptors displayed in Figure 5 could also contribute to the phenotype associated to the αC418W nAChR. For instance, the 30% reduction in the number of αC418W nAChRs in HEK cells reported by Shen et al.12 when compared to the WT nAChR could have its origin in the favored aggregation of the αC418W nAChR to form clusters of receptors beneath the plasma membrane surface (Fig. 5). Our findings predict that a non-activatable pool of receptors could be found as a reservoir trapped in cholesterol-dependent cav1-positive clusters related to endplate CAV. Under this scenario, it is conceivable that cholesterol-lowering drugs such as statins could potentially have a role in modulating the cytotoxic effects of this mutant nAChR. Along this line, recent data from our group strongly suggest that endplate nAChRs located in diaphragm muscles of transgenic mice bearing the αC418W mutation are extremely sensitive to prolonged statin treatments when compared to WT mice (manuscript in preparation).
The results presented herein suggest that specific interactions at lipid-exposed domains with cav1-positive membrane rafts regulate the activatable pool of nAChRs. Along the same line, several types of nAChRs have already been found in membrane rafts including the α7 neuronal nAChR.49–52 The regulation of the activatable pool of nAChRs by membrane rafts could provide a novel mechanism to fine-tune cholinergic transmission in the nervous system. An implicit assumption of the present study is that the regulation of the activatable pool of nAChRs by membrane raft microdomains will be relevant to other important receptor systems, ion channels, and membrane proteins. Finally, these findings may very well contribute to the demonstration that a mutation in a human ligand-gated ion channel receptor may lead to an altered trafficking to cav1-positive membrane domains with consequences in its functional pharmacodynamic behavior, and thereby shed light into potential therapeutic venues.
Materials and Methods
Membrane cholesterol depletion of Xenopus laevis oocytes
Cholesterol depletion in oocytes was accomplished using the procedure described previously17 with some modifications. Briefly, oocytes were incubated in 300 μL of 50 μM MβCD for 45 min and then washed three times with a total volume of 3 mL of MOR2 buffer (115 mM NaCl, 2.5 mM KCl, 1 mM Na2HPO4, 5 mM MgCl2, 0.2 mM CaCl2, 5 mM HEPES, pH 7.4). This water-soluble cyclic oligosaccharide has a high affinity for cholesterol and has been extensively used as an effective tool for the transport of cholesterol away from cell surfaces.18 MβCD incubations selectively remove cholesterol from cell membranes while not affecting membrane integrity when concentrations do not exceed 15 mM which is 300-fold higher than that used throughout the present study.19,20
Determination of membrane cholesterol and phospholipid acyl chain composition in Xenopus laevis oocytes
Membrane isolation
Six batches of oocytes (30 oocytes/batch) were used for each analysis. Three batches of oocytes were incubated in 50 μM MβCD and three in MOR2 buffer (control experiment) for 15, 30 and 45 minutes and then washed. Membrane isolation was performed as described by Ohlsson et al.,21 with minor modifications. Briefly, two-phase sucrose gradients were prepared with 1.5 and 0.3 M sucrose buffers (20 mM Tris HCl, 50 mM KCl, 10 mM MgCl2, 1 mM EGTA, pH 7.6) at a 1:2 ratio in 1.5-mL microtubes (30 oocytes/microtube). The oocytes from each batch were manually disrupted with forceps, layered at the upper phase of the separation medium, and then centrifuged for 20 min at 12,000 × g (4°C). The interface between the phases containing the membranes was removed, washed (5.0 mM HEPES, 160 mM NaCl, pH 7.4), and centrifuged for 10 min at 3,000 × g (4°C). The pellet was resuspended in 200 μl of MOR2 buffer and sonicated.
Analysis of total phospholipid and fatty acid composition
Total lipid from the plasmatic membrane of oocytes was extracted overnight at 4°C under a nitrogen atmosphere with chloroform:methanol (2:1, v:v) containing butylated hydroxytoluene (BHT), 2 × 10⁻⁵ M. Total phospholipid determination and fatty acid composition was achieved by subjecting the extracted lipid from the Xenopus laevis oocyte plasma membrane to an acid hydrolysis. After 3.5 hours of reflux with methanol/HCl all the fatty acids were converted to fatty acid methyl esters (FAME). This nonaqueous acid system is the most suitable for the hydrolysis of the fatty acyl amide bond of sphingolipids. Under this experimental condition almost all acyl chains in the phospholipids are converted to their respective FAME. Quantization of the individual components of the fatty acid mixture was accomplished by adding an internal standard (IS) (20:1Δ11) of known concentration, which is absent in the lipids from the Xenopus laevis oocyte’s plasmalemma. The FAME, the free fatty acids and the IS were extracted with petroleum ether and dried under nitrogen. The extract was dissolved in 10% methanol/diethyl ether and the free fatty acids were methylated using 0.5 mL of diazomethane. After 20 minutes, the reaction mixture was extracted with petroleum ether. The FAME were separated from other lipids on rhodamine 6G stained silica gel G plates with petroleum ether/diethyl ether (98:2, v/v) as the solvent system. The spots corresponding to the FAME and cholesterol were extracted with petroleum ether:ethyl ether (2:3, v/v). Then the FAME were analyzed with a Hewlett-Packard 5890 gas chromatographer using a glass column packed with GP 10% SP 100/120 Cromosorb (155–250°C). Peak identification was carried out isothermally by comparison with known standard mixtures and by graphical correlation to equivalent chain length values. Since each phospholipid produces two fatty acids under the total hydrolysis conditions stated above, the total of phospholipids from the samples were easily determined by dividing the total FAME by two. Contamination by trace amounts of fatty acids, particularly palmitic (16:0), stearic (18:0) and oleic (18:1), which were found in all the solvents tested, was eliminated in each experiment by the appropriate use of control samples to which lipids were not added.
Quantization of membrane cholesterol
The cholesterol isolated from the rhodamine 6G stained silica gel G plates was assayed using the Wako cholesterol E Kit (Wako Chemicals, Richmond VA) according to the manufacturer’s indications. In brief, cholesterol esters in the sample were hydrolyzed in a reaction catalyzed by cholesterol ester hydrolase and then oxidized by cholesterol oxidase, which generates hydrogen peroxide. The formed hydrogen peroxide then participates in a quantitative oxidative condensation reaction between 3,5-dimethoxy-N-ethyl-N-(2-hydroxy-3-sulfopropyl)-aniline sodium salt (DAOS) and 4-aminoantipyrine in the presence of peroxidase to produce a blue pigment. The cholesterol in the sample was determined by measuring the absorbance of the blue color at 600 nm. The total cholesterol concentration corresponding to the absorbance of the sample was read from a calibration curve prepared in advance.
Expression of the nAChR in Xenopus laevis oocytes
RNA transcripts were synthesized in vitro as described previously.22 The RNA transcripts (10 ng/oocyte at the concentration of 0.2 μg/μL) of the Torpedo californica nAChR α (WT and 0CC418W), β, γ and δ subunits were microinjected, in a 2:1:1:1 ratio, into Xenopus laevis oocytes in the V or VI developmental stage. Upon microinjection, the oocytes were incubated at 19°C for 72–96 hours in a medium containing 50% Leibovitz’s L-15 media (GIBCO, Gaithersburg, MD), 0.4 mg/mL bovine serum albumin and antibiotic-antimycotic agents added according to manufacturers directions prior to the scheduled experiments. The liquid medium was changed daily.
Voltage clamp recordings
Macroscopic currents induced by 100 μM acetylcholine (ACh) were recorded with a two-electrode voltage clamp using the Gene Clamp 500B amplifier (Axon Instruments, Foster City, CA). Electrodes were filled with 3 M KCl and had a resistance of less than 2 MΩ. Impaled oocytes in the recording chamber were automatically perfused using a Perfusion Valve Controller VC-8 (Warner Instruments, Inc., Hamden, CT) at a rate of approximately 0.5 mL/s with MOR2 buffer. ACh solutions were made from calcium-free MOR2 to avoid activation of an endogenous Ca2+-dependent Cl− current.23,24 Oocytes were held at a membrane potential of −70 mV. Membrane currents were filtered at 0.1 kHz and digitized at 1 kHz using a Digidata 1322A interface (Axon Instruments, Foster City CA) and acquired using the Clampex 9.2, pCLAMP 9.2 software package (Axon Instruments, Foster City CA) running on a Pentium IV-based computer. The peak currents elicited by oocytes expressing the 0CC418W nAChR were determined before and after the MβCD or MOR2 (control) incubations to determine the increase in peak currents on individual oocytes immediately before performing the patch clamp experiments.
Single-channel experiments
Patch clamp recordings
Xenopus laevis oocytes were placed in a recording chamber containing a bath solution (100 mM KCl, 1 mM MgCl2, 10 mM HEPES, pH 7.2) at 20 to 22°C. The patch pipettes were made of thick-walled borosilicate glass (Sutter Instruments, Novato, CA). Pipettes typically had resistances of 2–4 MQ. The pipette solution contained 100 mM KCl, 10 mM HEPES, 10 mM EGTA, pH 7.2) and 4 or 100 μM ACh. All experiments were performed in the cell-attached configuration. Single-channel currents were recorded using an Axopatch 200B patch clamp amplifier (Axon Instruments), filtered at 5 kHz and stored on VHS tapes using a digital data recorder (VR-10B, Instrutech Corp., Mineola, NY). The data traces were played back into a Pentium IV-based computer through a DigiData 1322A interface (Axon Instruments) and digitalized at 50 kHz using the winEDR v2.4.3 software (Strathclyde Electrophysiology Software).
Kinetic analysis
The mean open durations of single-channel events elicited by 4 μM ACh was determined using the QuB software (www.qub.buffalo.edu). At 100 μM ACh concentration, all the channels in the pipette are desensitized. However, individual receptors randomly revert to the non-desensitized state and the kinetic behavior of the open and closed states of only one channel can be measured as a burst of activity. Bursts of openings corresponding to a single-channel were defined as a series of openings separated by closed intervals greater than a critical duration (τcrit). Single-channel events at 100 μM ACh concentration were detected and idealized with a half-amplitude crossing criterion using the QuB software. Only bursts that exhibited durations longer than 100 ms and more than 10 openings per burst were used for further analysis. The kinetic scheme shown in Table 1 was fitted directly to the open and closed time intervals within bursts of activity and optimized using the program MIL (Maximum Interval Likelihood, QuB software).
Voltage-current relationships
The amplitudes of single-channel data obtained at low agonist concentration (4 μM) and various membrane potentials [(−60, −80, −100, −120 and −140) mV] were measured using the QuB software and plotted as a function of membrane potential using the GraphPad Prism 4 software. The slope of the line obtained through a linear regression corresponds to the single-channel conductance.
Imaging experiments
Acquisition of images
Xenopus laevis oocytes expressing the WT or the 0CC418W nAChRs were labeled using the α-BTX Alexa Fluor 488 conjugate prior to confocal microscopy experiments. This was achieved by incubating the oocytes in MOR2 buffer containing BSA (0.25 g/L) and the OC-BTX fluorescent conjugate (5 mg/L) for two hours and then washed. Labeled α-BTX bound to the nAChR was then excited at a wavelength of 488 nm using an Argon/2 laser and its emission acquired using a BP 500–550 or a LP 650 filter on a Zeiss LSM 510 Confocal Microscope. The magnification used was 63X. Images were acquired as a series of optical slices (Z-stack). The Z-stacks from clusters of nAChRs were used to generate 3-D projections in the Z-axis (Suppl. Fig. S1). Appropriate control experiments were performed to test for nonspecific binding and autofluorescence in each experiment. These controls showed no detectable fluorescence (Suppl. Fig. S2).
Cluster analysis
The rationale for this analysis was to measure and count the clusters of receptors which are characterized by their high intensity of fluorescence. Because the objective of this analysis was focused exclusively on the clusters, pixels outside of clusters had to be eliminated prior to the image processing described below. Circular inserts (50 μm in diameter) of labeled nAChR (WT or 0CC418W) acquired using a 63X objective were selected. In order to get rid of the fluorescence not originating from the clusters, a threshold was established so as to only retain pixels with intensities above the threshold. Due to the high intensity of fluorescence displayed by the clusters, establishing a threshold allows for the elimination of pixels outside the clusters while not modifying the area of the clusters. Indeed, the area of the clusters were not sensitive to the exact value of the threshold, nevertheless we applied the same threshold to all the circular inserts. The circular inserts were then converted to jpeg format for further analysis. Using the Image J program (http://rsb.info.nih.gov/ij/), the jpeg images were converted to 8-bit grayscale to allow further image processing. A scale was set to allow the interpretation of the number of pixels in terms of distance (μm). The grayscale images were then converted to binary format by defining a grayscale cutoff point. Grayscale values below the cutoff became black and those above became white. This procedure turned our original fluorescence images into black and white, thereby allowing the clusters to be counted and their sizes to be measured with ease. From each circular insert, the number of clusters per μm2 (clusters per area) and the mean cluster size were determined.
Fractionation of membrane rafts
Membrane isolation
Four batches of oocytes (100 oocytes/batch), two of which expressing the WT nAChR and two expressing the αC418W nAChR, were used for each gradient procedure. One batch of oocytes expressing the WT nAChR and one expressing the αC418W nAChR were incubated in 50 μM MβCD (300 μL/ooctyte) for 45 min whereas the remaining two batches were incubated in MOR2 buffer (control experiments) and then washed. Following the incubations, oocyte plasma membranes were isolated as described above but with minor modifications. Briefly, a two-phase sucrose gradient was prepared with 1.5 and 0.3 M sucrose buffers (20 mM Tris HCl, 50 mM KCl, 10 mM MgCl2, 2 mM DTT, 1 mM EGTA, and the protease inhibitor mixture III, pH 7.6) at a 1:2 ratio in 1.5-mL microtubes (~33 oocytes/microtube). The inhibitor mixture was purchased from Calbiochem-Novabiochem. The oocytes from each batch were manually disrupted with forceps, layered at the upper phase of the separation medium, and then centrifuged for 20 min at 12,000 × g (4°C). The interface between the phases containing the membranes was removed, washed (5.0 mM HEPES, 160 mM NaCl, and protease inhibitor mixture III, pH 7.4), and centrifuged for 10 min at 3,000 × g (4°C). The pellet was resuspended in lysis buffer [25 mM MES and 150 mM NaCl (MBS) containing 2% Triton X-100 and 1 mM PMSF] (200 μl) and sonicated.
Density gradient fractions
To generate the detergent-insoluble density gradient fractions, the Xenopus laevis oocyte plasma membranes were processed as previously described.25,26 Briefly, oocyte plasma membranes obtained as described above containing 2% Triton X-100 (lysis buffer) were separated over a discontinuous sucrose-density gradient, prepared by adjusting the oocyte membrane fraction to 40% sucrose by addition of 80% sucrose in MBS, overlaying with 4 mL of 30% sucrose in MBS, and 4 mL 5% sucrose in MBS. The sample was centrifuged at 100,000 × g for 22 h in a SW 40Ti rotor (Beckman Instruments). Twelve 1 mL fractions were collected from the top of the gradient, diluted three-fold with MBS, and centrifuged at 100,000 × g for 30 min at 4°C. The resulting pellets were resuspended in urea sample buffer (USB) (4% SDS, 8 M urea, 62 mM EDTA, 0.2% mercaptoethanol, 0.015% bromophenol blue) and stored at −80°C, or alternatively directly separated in a 12% SDS-PAGE.
SDS-PAGE and immunoblotting
SDS-PAGE and immunoblot analysis of the gradient fractions was done as previously described.26 In brief, equal volumes from the gradient fractions, plus the molecular weight standards, were separated using 12% SDS polyacrylamide gels (Bio-Rad Laboratories, Hercules, CA). After electrophoresis, proteins were transferred overnight to a PVDF membrane using a mini trans-blot apparatus (Bio-Rad Laboratories, Hercules, CA) at 4°C. PVDF membranes were stained with India ink to verify transfer efficiency. Subsequently, the membranes were incubated overnight (at 4°C) with a monoclonal antibody (clone mAb142) against the nAChR α-subunit (Sigma, Co.,) (1:3,000 dilution). After addition of the corresponding secondary antibody, membranes were processed using the enhanced chemiluminescence assay (SuperSignal1; Pierce, Rockford, IL) as described by the manufacturer.
Immunoprecipitations
For the co-immunoprecipitation experiments, the membranes were isolated from Xenopus laevis oocytes expressing the WT or the αC418W nAChR (100 oocytes each) exactly the same way as for the sucrose density gradients with the exception that DTT was absent in the sucrose solutions and the pellets were resuspended in TBS (150 mM NaCl, 50 mM Tris HCl, pH 8.0) plus 60 mM octyl-glucoside and protease inhibitor mixture III, and subsequently solubilized by mild occasional vortexing at 4°C for 30 min. The mixtures were then centrifuged at 10,000 × g for 10 min at 4°C and the resulting supernatants were incubated overnight with a polyclonal antibody against cav1 coupled to Protein A immobilized on polyacrylic beads. Upon the incubation, the beads were recovered by centrifugation at 10,000 × g for 5 min at 4°C, washed, resuspened in USB, boiled for 5 min and subjected to SDS-PAGE. The Western blots were performed exactly as described above and the intensities of the bands were quantified using the Image J program.
Supplementary Material
Acknowledgments
This work was supported by NIH Grants RO1GM56371-09, NCRR 1S0RR13705 and S06-GM08102-27 and SNRP U54NS0430311 to JAL-D, and in part by NIH Grant S06-GM08224 to WIS. Carlos A. Báez-Pagán and José D. Otero-Cruz were supported by the UPR-AGEP Program Grant HRD9817642 and by the NIH-MBRS Research Initiative for Scientific Enhancement Grant R25GM61151. Yaiza Martínez-Ortiz was supported by the NASA Training Grant NNG05GG78H.
Abbreviations
- nAChR
nicotinic acetylcholine receptor
- WT
wild-type
- ACh
acetylcholine
- CMS
congenital myasthenic syndrome
- cav1
caveolin-1
- CAV
caveolae
- α-BTX
α-bungarotoxin
- MβCD
methyl-β-cyclodextrin
- CBM
caveolin-binding motif
Footnotes
Note
Supplementary materials can be found at: www.landesbioscience.com/supplement/BaezCHAN2-3-Sup.pdf
References
- 1.Karlin A. Emerging structure of the nicotinic acetylcholine receptors. Nat Rev Neurosci. 2002;3:102–14. doi: 10.1038/nrn731. [DOI] [PubMed] [Google Scholar]
- 2.Corringer PJ, Le Novere N, Changeux JP. Nicotinic receptors at the amino acid level. Annu Rev Pharmacol Toxicol. 2000;40:431–58. doi: 10.1146/annurev.pharmtox.40.1.431. [DOI] [PubMed] [Google Scholar]
- 3.Le Novere N, Corringer PJ, Changeux JP. The diversity of subunit composition in nAChRs: evolutionary origins, physiologic and pharmacologic consequences. J Neurobiol. 2002;53:447–56. doi: 10.1002/neu.10153. [DOI] [PubMed] [Google Scholar]
- 4.Cockcroft VB, Osguthorpe DJ, Barnard EA, Friday AE, Lunt GG. Ligand-gated ion channels. Homology and diversity. Mol Neurobiol. 1990;4:129–69. doi: 10.1007/BF02780338. [DOI] [PubMed] [Google Scholar]
- 5.Unwin N. Nicotinic acetylcholine receptor at 9 A resolution. J Mol Biol. 1993;229:1101–24. doi: 10.1006/jmbi.1993.1107. [DOI] [PubMed] [Google Scholar]
- 6.Devillers Thiery A, Galzi JL, Eisele JL, Bertrand S, Bertrand D, Changeux JP. Functional architecture of the nicotinic acetylcholine receptor: a prototype of ligand-gated ion channels. J Membr Biol. 1993;136:97–112. doi: 10.1007/BF02505755. [DOI] [PubMed] [Google Scholar]
- 7.Unwin N. Acetylcholine receptor channel imaged in the open state. Nature. 1995;373:37–43. doi: 10.1038/373037a0. [DOI] [PubMed] [Google Scholar]
- 8.Miyazawa A, Fujiyoshi Y, Unwin N. Structure and gating mechanism of the acetylcholine receptor pore. Nature. 2003;423:949–55. doi: 10.1038/nature01748. [DOI] [PubMed] [Google Scholar]
- 9.Blanton MP, Cohen JB. Mapping the lipid-exposed regions in the Torpedo californica nicotinic acetylcholine receptor. Biochemistry. 1992;31:3738–50. doi: 10.1021/bi00130a003. [DOI] [PubMed] [Google Scholar]
- 10.Blanton MP, Cohen JB. Identifying the lipid-protein interface of the Torpedo nicotinic acetylcholine receptor: secondary structure implications. Biochemistry. 1994;33:2859–72. doi: 10.1021/bi00176a016. [DOI] [PubMed] [Google Scholar]
- 11.Engel AG, Ohno K, Sine SM. The spectrum of congenital myasthenic syndromes. Mol Neurobiol. 2002;26:347–67. doi: 10.1385/MN:26:2-3:347. [DOI] [PubMed] [Google Scholar]
- 12.Shen XM, Deymeer F, Sine SM, Engel AG. Slow-channel mutation in acetylcholine receptor alphaM4 domain and its efficient knockdown. Ann Neurol. 2006;60:128–36. doi: 10.1002/ana.20861. [DOI] [PubMed] [Google Scholar]
- 13.Santiago J, Guzman GR, Rojas LV, Marti R, Asmar Rovira GA, Santana LF, McNamee M, Lasalde Dominicci JA. Probing the effects of membrane cholesterol in the Torpedo californica acetylcholine receptor and the novel lipid-exposed mutation alpha C418W in Xenopus oocytes. J Biol Chem. 2001;276:46523–32. doi: 10.1074/jbc.M104563200. [DOI] [PubMed] [Google Scholar]
- 14.Hamill OP, Marty A, Neher E, Sakmann B, Sigworth FJ. Improved patch-clamp techniques for high-resolution current recording from cells and cell-free membrane patches. Pflugers Arch. 1981;391:85–100. doi: 10.1007/BF00656997. [DOI] [PubMed] [Google Scholar]
- 15.Williams TM, Lisanti MP. The caveolin proteins. Genome Biol. 2004;5:214. doi: 10.1186/gb-2004-5-3-214. [DOI] [PMC free article] [PubMed] [Google Scholar]
- 16.Ikonen E, Parton RG. Caveolins and cellular cholesterol balance. Traffic. 2000;1:212–7. doi: 10.1034/j.1600-0854.2000.010303.x. [DOI] [PubMed] [Google Scholar]
- 17.Ohtani Y, Irie T, Uekama K, Fukunaga K, Pitha J. Differential effects of alpha-, beta- and gamma-cyclodextrins on human erythrocytes. Eur J Biochem. 1989;186:17–22. doi: 10.1111/j.1432-1033.1989.tb15171.x. [DOI] [PubMed] [Google Scholar]
- 18.Christian AE, Haynes MP, Phillips MC, Rothblat GH. Use of cyclodextrins for manipulating cellular cholesterol content. J Lipid Res. 1997;38:2264–72. [PubMed] [Google Scholar]
- 19.Anderson TG, Tan A, Ganz P, Seelig J. Calorimetric measurement of phospholipid interaction with methyl-beta-cyclodextrin. Biochemistry. 2004;43:2251–61. doi: 10.1021/bi0358869. [DOI] [PubMed] [Google Scholar]
- 20.Niu SL, Mitchell DC, Litman BJ. Manipulation of cholesterol levels in rod disk membranes by methyl-beta-cyclodextrin: effects on receptor activation. J Biol Chem. 2002;277:20139–45. doi: 10.1074/jbc.M200594200. [DOI] [PubMed] [Google Scholar]
- 21.Ohlsson RI, Lane CD, Guengerich FP. Synthesis and insertion, both in vivo and in vitro, of rat-liver cytochrome P-450 and epoxide hydratase into Xenopus laevis membranes. Eur J Biochem. 1981;115:367–73. doi: 10.1111/j.1432-1033.1981.tb05247.x. [DOI] [PubMed] [Google Scholar]
- 22.Lee YH, Li L, Lasalde J, Rojas L, McNamee M, Ortiz Miranda SI, Pappone P. Mutations in the M4 domain of Torpedo californica acetylcholine receptor dramatically alter ion channel function. Biophys J. 1994;66:646–53. doi: 10.1016/s0006-3495(94)80838-0. [DOI] [PMC free article] [PubMed] [Google Scholar]
- 23.Barish ME. A transient calcium-dependent chloride current in the immature Xenopus oocyte. J Physiol. 1983;342:309–25. doi: 10.1113/jphysiol.1983.sp014852. [DOI] [PMC free article] [PubMed] [Google Scholar]
- 24.Mishina M, Kurosaki T, Tobimatsu T, Morimoto Y, Noda M, Yamamoto T, Terao M, Lindstrom J, Takahashi T, Kuno M, et al. Expression of functional acetylcholine receptor from cloned cDNAs. Nature. 1984;307:604–8. doi: 10.1038/307604a0. [DOI] [PubMed] [Google Scholar]
- 25.Silva WI, Maldonado HM, Lisanti MP, Devellis J, Chompre G, Mayol N, Ortiz M, Velazquez G, Maldonado A, Montalvo J. Identification of caveolae and caveolin in C6 glioma cells. Int J Dev Neurosci. 1999;17:705–14. doi: 10.1016/s0736-5748(99)00040-4. [DOI] [PubMed] [Google Scholar]
- 26.Silva WI, Maldonado HM, Velazquez G, Rubio Davila M, Miranda JD, Aquino E, Mayol N, Cruz Torres A, Jardon J, Salgado Villanueva IK. Caveolin isoform expression during differentiation of C6 glioma cells. Int J Dev Neurosci. 2005;23:599–612. doi: 10.1016/j.ijdevneu.2005.07.007. [DOI] [PubMed] [Google Scholar]
- 27.Sadler SE. Low-density caveolae-like membrane from Xenopus laevis oocytes is enriched in Ras. J Cell Biochem. 2001;83:21–32. doi: 10.1002/jcb.1207. [DOI] [PubMed] [Google Scholar]
- 28.Guzmán GR, Ortiz Acevedo A, Santiago J, Rojas LV, Lasalde Dominicci JA. Regulation of acetylcholine receptor function by cholesterol. Recent Res Devel Membrane Biol. 2002;1:127–46. [Google Scholar]
- 29.Murata M, Peranen J, Schreiner R, Wieland F, Kurzchalia TV, Simons K. VIP21/caveolin is a cholesterol-binding protein. Proc Natl Acad Sci USA. 1995;92:10339–43. doi: 10.1073/pnas.92.22.10339. [DOI] [PMC free article] [PubMed] [Google Scholar]
- 30.Ikonen E, Heino S, Lusa S. Caveolins and membrane cholesterol. Biochem Soc Trans. 2004;32:121–3. doi: 10.1042/bst0320121. [DOI] [PubMed] [Google Scholar]
- 31.Pike LJ. Rafts defined: a report on the Keystone Symposium on Lipid Rafts and Cell Function. J Lipid Res. 2006;47:1597–8. doi: 10.1194/jlr.E600002-JLR200. [DOI] [PubMed] [Google Scholar]
- 32.Jacobson K, Mouritsen OG, Anderson RG. Lipid rafts: at a crossroad between cell biology and physics. Nat Cell Biol. 2007;9:7–14. doi: 10.1038/ncb0107-7. [DOI] [PubMed] [Google Scholar]
- 33.Malinska K, Malinsky J, Opekarova M, Tanner W. Visualization of protein compartmenta-tion within the plasma membrane of living yeast cells. Mol Biol Cell. 2003;14:4427–36. doi: 10.1091/mbc.E03-04-0221. [DOI] [PMC free article] [PubMed] [Google Scholar]
- 34.Razani B, Woodman SE, Lisanti MP. Caveolae: from cell biology to animal physiology. Pharmacol Rev. 2002;54:431–67. doi: 10.1124/pr.54.3.431. [DOI] [PubMed] [Google Scholar]
- 35.Hnasko R, Lisanti MP. The biology of caveolae: lessons from caveolin knockout mice and implications for human disease. Mol Interv. 2003;3:445–64. doi: 10.1124/mi.3.8.445. [DOI] [PubMed] [Google Scholar]
- 36.McNerney ME, Pardi D, Pugh PC, Nai Q, Margiotta JF. Expression and channel properties of alpha-bungarotoxin-sensitive acetylcholine receptors on chick ciliary and choroid neurons. J Neurophysiol. 2000;84:1314–29. doi: 10.1152/jn.2000.84.3.1314. [DOI] [PubMed] [Google Scholar]
- 37.Albuquerque EX, Barnard EA, Porter CW, Warnick JE. The density of acetylcholine receptors and their sensitivity in the postsynaptic membrane of muscle endplates. Proc Natl Acad Sci USA. 1974;71:2818–22. doi: 10.1073/pnas.71.7.2818. [DOI] [PMC free article] [PubMed] [Google Scholar]
- 38.Margiotta JF, Berg DK, Dionne VE. The properties and regulation of functional acetylcholine receptors on chick ciliary ganglion neurons. J Neurosci. 1987;7:3612–22. doi: 10.1523/JNEUROSCI.07-11-03612.1987. [DOI] [PMC free article] [PubMed] [Google Scholar]
- 39.Santiago J, Guzman GR, Torruellas K, Rojas LV, Lasalde Dominicci JA. Tryptophan scanning mutagenesis in the TM3 domain of the Torpedo californica acetylcholine receptor beta subunit reveals an alpha-helical structure. Biochemistry. 2004;43:10064–70. doi: 10.1021/bi0362368. [DOI] [PubMed] [Google Scholar]
- 40.Tamamizu S, Guzman GR, Santiago J, Rojas LV, McNamee MG, Lasalde Dominicci JA. Functional effects of periodic tryptophan substitutions in the alpha M4 transmembrane domain of the Torpedo californica nicotinic acetylcholine receptor. Biochemistry. 2000;39:4666–73. doi: 10.1021/bi992835w. [DOI] [PubMed] [Google Scholar]
- 41.Gasset M, Killian JA, Tournois H, de Kruijff B. Influence of cholesterol on gramicidin-induced HII phase formation in phosphatidylcholine model membranes. Biochim Biophys Acta. 1988;939:79–88. doi: 10.1016/0005-2736(88)90049-1. [DOI] [PubMed] [Google Scholar]
- 42.Carozzi AJ, Roy S, Morrow IC, Pol A, Wyse B, Clyde Smith J, Prior IA, Nixon SJ, Hancock JF, Parton RG. Inhibition of lipid raft-dependent signaling by a dystrophy-associated mutant of caveolin-3. J Biol Chem. 2002;277:17944–9. doi: 10.1074/jbc.M110879200. [DOI] [PubMed] [Google Scholar]
- 43.Okamoto T, Schlegel A, Scherer PE, Lisanti MP. Caveolins, a family of scaffolding proteins for organizing “preassembled signaling complexes” at the plasma membrane. J Biol Chem. 1998;273:5419–22. doi: 10.1074/jbc.273.10.5419. [DOI] [PubMed] [Google Scholar]
- 44.Couet J, Li S, Okamoto T, Ikezu T, Lisanti MP. Identification of peptide and protein ligands for the caveolin-scaffolding domain. Implications for the interaction of caveolin with caveolae-associated proteins. J Biol Chem. 1997;272:6525–33. doi: 10.1074/jbc.272.10.6525. [DOI] [PubMed] [Google Scholar]
- 45.Carman CV, Lisanti MP, Benovic JL. Regulation of G protein-coupled receptor kinases by caveolin. J Biol Chem. 1999;274:8858–64. doi: 10.1074/jbc.274.13.8858. [DOI] [PubMed] [Google Scholar]
- 46.Lasalde JA, Tamamizu S, Butler DH, Vibat CR, Hung B, McNamee MG. Tryptophan substitutions at the lipid-exposed transmembrane segment M4 of Torpedo californica acetylcholine receptor govern channel gating. Biochemistry. 1996;35:14139–48. doi: 10.1021/bi961583l. [DOI] [PubMed] [Google Scholar]
- 47.Guzman GR, Santiago J, Ricardo A, Marti Arbona R, Rojas LV, Lasalde Dominicci JA. Tryptophan scanning mutagenesis in the alphaM3 transmembrane domain of the Torpedo californica acetylcholine receptor: functional and structural implications. Biochemistry. 2003;42:12243–50. doi: 10.1021/bi034764d. [DOI] [PubMed] [Google Scholar]
- 48.Otero Cruz JD, Baez Pagan CA, Caraballo Gonzalez IM, Lasalde Dominicci JA. Tryptophan-scanning mutagenesis in the alphaM3 transmembrane domain of the muscle-type acetylcholine receptor. A spring model revealed. J Biol Chem. 2007;282:9162–71. doi: 10.1074/jbc.M607492200. [DOI] [PubMed] [Google Scholar]
- 49.Bruses JL, Chauvet N, Rutishauser U. Membrane lipid rafts are necessary for the maintenance of the (alpha)7 nicotinic acetylcholine receptor in somatic spines of ciliary neurons. J Neurosci. 2001;21:504–12. doi: 10.1523/JNEUROSCI.21-02-00504.2001. [DOI] [PMC free article] [PubMed] [Google Scholar]
- 50.Oshikawa J, Toya Y, Fujita T, Egawa M, Kawabe J, Umemura S, Ishikawa Y. Nicotinic acetylcholine receptor alpha 7 regulates cAMP signal within lipid rafts. Am J Physiol Cell Physiol. 2003;285:567–74. doi: 10.1152/ajpcell.00422.2002. [DOI] [PubMed] [Google Scholar]
- 51.Zhu D, Xiong WC, Mei L. Lipid rafts serve as a signaling platform for nicotinic acetylcho-line receptor clustering. J Neurosci. 2006;26:4841–51. doi: 10.1523/JNEUROSCI.2807-05.2006. [DOI] [PMC free article] [PubMed] [Google Scholar]
- 52.Marchand S, Devillers Thiery A, Pons S, Changeux JP, Cartaud J. Rapsyn escorts the nicotinic acetylcholine receptor along the exocytic pathway via association with lipid rafts. J Neurosci. 2002;22:8891–901. doi: 10.1523/JNEUROSCI.22-20-08891.2002. [DOI] [PMC free article] [PubMed] [Google Scholar]
Associated Data
This section collects any data citations, data availability statements, or supplementary materials included in this article.