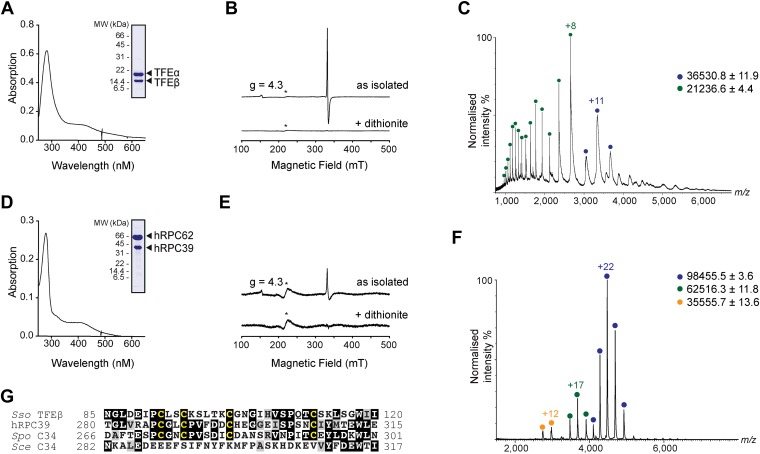
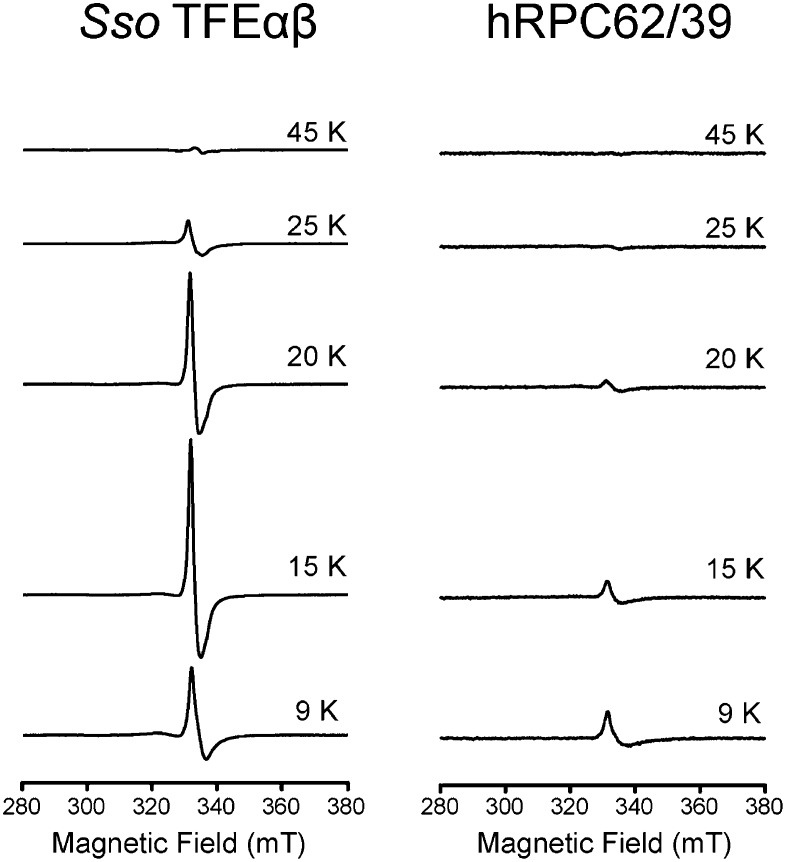
Figure 2. The C-terminal domain of Sso TFEβ harbours a 4Fe-4S cluster that is conserved in human RNAPIII subcomplex hRPC62/39.
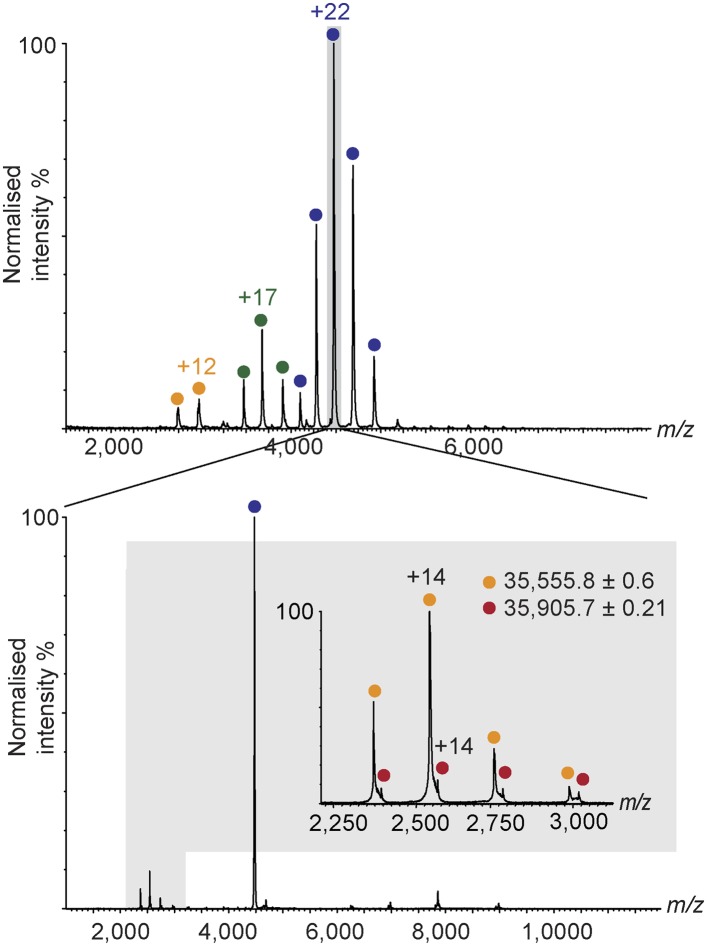
(A) UV-vis spectrum of TFEα/β-His. (B) Cw-EPR spectra of TFEα/β prepared in the presence of 1 mM DTT with or without the addition of 20 mM Na-dithionite. Besides the main [3Fe-4S]+ cluster signal at g = 2.01, a small amount of spurious high spin Fe3+ at g = 4.3 was also detected. The asterisks denote a background signal. (C) Nano-electrospray ionization (nESI) mass spectrum of TFEα/β-His. Filled circles indicate the different charge state series: TFEα/β-His + Zn ion + 4Fe-4S cluster (blue), TFEα + Zn ion (green). (D) UV-vis spectrum of recombinant human RNAP III subcomplex hRPC62/C39. (E) Cw-EPR spectra of hRPC62/39 prepared in the presence of the reducing agent Na-dithionite. The asterisks denote a background signal. (F) nESI mass spectrum of recombinant human hRPC62/C39. Filled circles indicate the different charge state series: hRPC62/C39 complex + 4Fe-4S cluster (blue), monomeric hRPC62 (green), monomeric hRPC39 (yellow). (G) Sequence alignment of the C-terminal domains of S. solfataricus TFEβ (gene id: 1455187), H. sapiens hRPC39 (gene id: 10621), Schizosaccharomyces pombe C34 (gene id: 2538992), and S. cerevisiae C34 (gene id: 855737). Identical and similar residues are shaded in black and grey, respectively. The four cysteine residues coordinating the FeS cluster are highlighted in yellow.
DOI: http://dx.doi.org/10.7554/eLife.08378.008


