

Abstract
Experiments were performed to size, count, and obtain shell parameters for individual ultrasound contrast microbubbles using a modified flow cytometer. Light scattering was modeled using Mie theory, and applied to calibration beads to calibrate the system. The size distribution and population were measured directly from the flow cytometer. The shell parameters (shear modulus and shear viscosity) were quantified at different acoustic pressures (from 95 to 333 kPa) by fitting microbubble response data to a bubble dynamics model. The size distribution of the contrast agent microbubbles is consistent with manufacturer specifications. The shell shear viscosity increases with increasing equilibrium microbubble size, and decreases with increasing shear rate. The observed trends are independent of driving pressure amplitude. The shell elasticity does not vary with microbubble size. The results suggest that a modified flow cytometer can be an effective tool to characterize the physical properties of microbubbles, including size distribution, population, and shell parameters.
I. INTRODUCTION
Ultrasound contrast agents (UCAs) are micrometerscale gas bubbles encapsulated in a thin stabilization coating (e.g., lipid, albumin, or polymer) that helps prevent bubble dissolution. Injected into the bloodstream, they are used in diagnostic ultrasound to enhance contrast of specific cardiographic or radiologic features [1]. More recently, the potential therapeutic applications of UCAs relevant to ultrasound-induced bioeffects have also been investigated both in vitro and in vivo [2]–[4]. New generations of agents are being developed for molecular imaging and therapy that incorporate targeting ligands. In particular, the UCAs can be conjugated with ligands that are specific to a disease protein’s receptor. Imaging of the much larger microbubbles is thus associated with molecular imaging of the disease protein. Characterization of UCAs is needed to optimize their sensitivity and specificity. Current static characterization provides information about the size distribution and population density, but these methods say nothing about the shell to which the ligands are attached. We propose a dynamic light scattering system modified from an off-the-shelf flow cytometer that can characterize a microbubble’s specific physical properties.
Characterization of the physical properties of UCA microbubbles involves measuring their population density (i.e., number of bubbles per milliliter) and size distribution. One method uses direct optical imaging under a microscope. However, this technique has a slow data acquisition speed, and cannot clearly resolve small microbubbles. Electrical sensing is another technique. In the Coulter method, microbubbles pass through an aperture that registers a voltage signal proportional to the volume of the microbubble. The Coulter Multisizer (Beckman Coulter, Brea, CA) with a 30-μm aperture can size microbubbles from about 0.6 to 18 μm. Light scattering can also size and count microbubbles [5], [6]. One off-the-shelf system is the Horiba (Horiba Ltd., Kyoto, Japan) LA300 (0.1 to 600 μm dynamic range). Both the Coulter and light scattering methods are high-throughput systems capable of sizing and counting thousands of bubbles in relatively short time frames.
The population number and size distribution are important characteristics of UCAs; however, the characterization of shell properties is also important for determining many functional properties of shelled microbubbles. Gorce et al. [7] performed attenuation measurements on SonoVue bubble populations and deduced an average shell elasticity χ = 0.55 N/m and shell viscosity κs = 7.2 × 10⁻⁹ kg/s. Chang et al. [8] used acoustic scattering to estimate the shell elasticity of Albunex and an experimental agent. Sboros et al. [9] interrogated the properties of bi-Sphere microbubble shells with atomic force microscopy and estimated the range of the shell stiffness in the static regime to be between 1 to 6 N/m. Morgan et al. [10], Dayton et al. [11], and van der Meer et al. [12] used direct optical imaging to measure the response of SonoVue microbubbles to incident acoustic fields, reporting that the shell viscosity increases with the initial bubble size.
We have previously shown that light scattering from a table-top setup can also be used to obtain shell-specific information from acoustically-activated microbubbles [5]. In particular, we found the same trend in shell viscosity that was reported with direct optical imaging [6]. However, Doinikov et al. suggest that the apparent trend in shell viscosity and elasticity with microbubble size is an artifact caused by incomplete formulation of a proper shell model [13].
Given the confusion over shell models, and the importance of shells for microbubble stability, volumetric response to incident acoustic waves, and for molecular targeting and therapy, there is a need to measure their properties easily and quickly. Toward that goal, we have carried the concept of light scattering to an off-the-shelf system for measuring microbubble parameters. A flow cytometer was modified to measure the light signals scattered from individual microbubbles as they passed through the interrogation region while being activated by ultrasound. A flow cytometer provides the following advantages: real-time detection, straightforward and quick measurements, high throughput, and a single bubble in the region of interest (ROI) under well-controlled flow conditions. Furthermore, a flow cytometer can also count and size microbubbles, thus providing an all-in-one system for characterizing the physical properties of ultrasound contrast agents. Although not considered here, it may be possible to use fluorescence detection from the cytometer to assess chemical properties of the agents as well.
The paper is organized as follows: The experimental setup section describes the flow cytometer and its calibration. The model is then described. We use a model that has worked well for SonoVue microbubbles. In the results section, we measure the ambient bubble size distribution without ultrasound exposure. We then record the microbubble response to a 1-MHz pulse under various driving voltages. The shell parameters of Definity microbubbles are quantified as a function of equilibrium bubble radius by comparing their response to a bubble dynamics model. We found that the shell viscosity increases with increasing ambient bubble size, and decreases with increasing shear rate, suggesting that the shell undergoes shear thinning. We found also that the elasticity parameter remains constant, which is counter to previous results that utilize simpler models.
II. EXPERIMENTAL SETUP
The agent studied throughout most of this paper is Definity (Lantheus Medical Imaging, North Billerica, MA), a commonly used new-generation UCA. Definity microbubbles are filled with octafluoropropane gas encapsulated by a very thin lipid shell. They have a mean diameter of ~2 μm, and a concentration of ~1010 bubbles/ml, according to manufacturer specifications. Later, a comparison is made with SonoVue microbubbles (Bracco Diagnostics Inc., Princeton, NJ). SonoVue agents are filled with sulfur hexafluoride, and also use a thin lipid shell coating.
A. Flow Cytometer Setup
A diagram of the flow cytometer is shown in Fig. 1. An InFlux cell sorter (BD Biosciences, San Jose, CA) was modified to include a custom square quartz flow cell (Hamamatsu Photonics, Hamamatsu City, Japan) with a 150-μm flow channel as a measurement chamber in place of the standard nozzle and fluid jet. Acoustic coupling to the carrier sheath fluid and microbubble samples occurred through a 0.7-mm piezoelectric element that was bonded to one side of the flow cell with epoxy. The source signal to acoustically drive the flow cell assembly was generated by in-house equipment: a function generator (HP 33120a, Agilent Technologies, Palo Alto, CA) connected to an RF amplifier (A150, ENI, Rochester, NY) though an RF step attenuator (837 Attenuator, Kay Elemetrics Corp., Lincoln Park, NJ).
Fig. 1.

Diagram of a flow cytometer. Incident laser light scatters off particles in a flow channel. The scattered light is collected and focused onto a field stop. Light diverging from the field stop is split by a glass coverslip used as a ~6% beam splitter to be collected by side-scatter and fluorescence PMT detectors. Our implementation uses the side-scatter PMT for light detection. Our modification is to the flow channel: we added a small PZT transducer bonded to the side of a custom-built quartz flow cell with a 150-μm flow channel. As the UCAs flow through the cell, the incident acoustic energy forces their radial motion. The instantaneous change in their size is characterized by a change in the amount of scattering detected by the side-scatter PMT.
The InFlux standard side-scatter (90°) optical path and side-scatter detector were used for light collection. The optical excitation source was from a 500-mW 488-nm laser (sapphire 488–500, Coherent Inc., Santa Clara, CA) focused to an approximately 65 μm diameter focal point by a 75 mm focal length lens.
PMT signals were routed to a custom high-bandwidth (−6 dB at 5 MHz) current-to-voltage converter and logarithmic preamplifier similar to that described by Shapiro [14]. The Spigot software package provided with the InFlux cytometer was used to control the side-scatter PMT tube gain setting. A National Instruments PXI data acquisition system (National Instruments, Austin, TX) was used for pulse digitization and storage. Digitization was performed by a 12 bit PXI-5105 at a 10 MHz sampling rate with 302 points collected per sampling sequence for the calibration yellow-green fluorescent microspheres (YG beads) and at a 25 MHz sampling rate with 1002 points collection for UCAs, then saved to a computer for postprocessing.
B. Calibration
The flow cytometer PMT voltage output is converted to a radius using Mie scattering theory. A modification of Mie scattering theory, applicable to a coated sphere, was first developed by Aden and Kerker [15] and later applied to coated bubbles by Marston et al. [16], [17]. Our implementation of the model for UCAs is based on the equations in the book by Bohren and Huffman [18].
Normally, separate scattering coefficients should be applied to the shell and gas to calculate the relative scattering intensity from UCA bubbles [16], [17]. However, the scattering features of thin lipid-shelled UCA bubbles (shell thickness less than 15 nm) are almost identical to that of free gas bubbles [5], which means the shell of Definity (and SonoVue) microbubbles can be neglected in the calculations. Because the mathematical derivation for the scattering coefficient is cumbersome, it is not described in this paper; interested readers can refer to the references for the details [18]–[20].
Generally, the scattered light intensity is a complicated function of both bubble radius and scattering angle. In a flow cytometer, the PMTs are located at the forward (forward scatter) and quadrature (side-scatter) positions. For this work, we use only the quadrature PMT located at 90° from the incident laser. The PMT collects light from a finite angle centered at 90° determined by the numerical aperture (NA) of the objective (NA = nsin θ1/2 = 0.42), which is taken into account by summing up the scattered light at all these angles. We use calibration YG beads (Invitrogen, Carlsbad, CA) with radii of 0.25, 0.5, 1, 2.9, and 5 μm to calibrate the scattered light intensity. A MatLab program (The MathWorks, Natick, MA) was used to determine the scattering coefficients.
In Fig. 2, the solid dots represent the measured relative light intensities from the calibration YG beads. The measured data are fitted with the theoretical calculation curve (solid line) where the refractive indices of water and beads are nw = 1.33, nb = 1.59, respectively. Then, by setting the refractive index of a gas bubble to nuca = 1, the relative light intensity scattered from the UCAs can be calculated and plotted as a function of bubble radius (dashed line). Note that the scattered light intensity of UCAs exhibits a monotonic trend with increasing bubble radius, allowing us to assign a specific bubble radius to a specific scattered light intensity value.
Fig. 2.
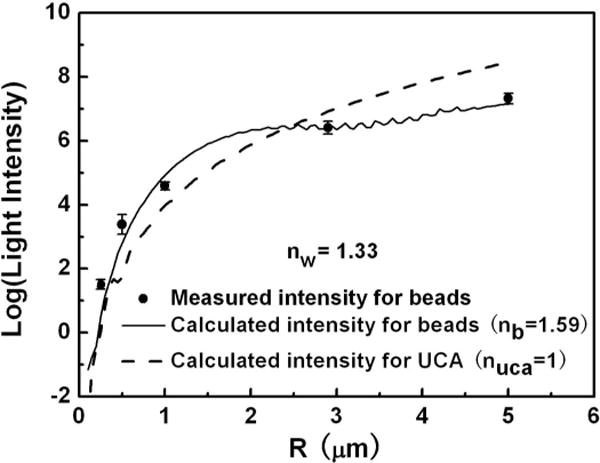
Relative scattered light intensity calculations and measurements as a function of bubble radius. The solid dots represent the measured light intensity scattered from the calibration beads. The solid line is the calculated Mie scattering intensity from the beads. The dashed line represents the calculated scattering intensity from a UCA.
III. MICROBUBBLE MODEL
To obtain shell-specific information, we fit a bubble dynamics equation to the radius-response data obtained from the flow cytometer. There are several models that describe the dynamic response of shelled UCA microbubbles, considering shell properties such as shell thickness, viscosity, stiffness, friction parameter, and/or surface tension [13], [21]–[26].
To be consistent with our previous work on SonoVue microbubbles, we use the theoretical model proposed by Marmottant et al. [26] that describes even large amplitude oscillations of microbubbles encapsulated with thin lipid shells. In that paper, they suggest that for phospholipid monolayer coatings, the surface area available per phospholipid molecule varies as the microbubble oscillates. The model considers that the microbubble shell buckles as the bubble radius R < Rbuckling and breaks up for R > Rbreak-up. In other words, it suggests that the shell elasticity can be modeled with a radius-dependent surface tension that takes into account shell buckling and rupture. The dynamic equation of Marmottant’s model is
| (1) |
For simplicity, (1) is referred to throughout this paper as Marmottant’s model, where R and R0 are the instantaneous and ambient bubble radius, the dots over the R represent time derivatives, ρl and ηl are the density and viscosity of a newtonian liquid, P0 is the ambient pressure, γ is the polytropic exponent of the gas, c is the acoustic velocity in the liquid, κs is the shell dilatational viscosity, and the acoustic driving pressure Pa(t) is the sinusoidal incident acoustic pressure. The surface tension σ(R) is modeled as
| (2) |
where χ is the shell elastic compression modulus.
For large amplitude oscillations, the surface tension varies within an elastic regime until the shell breaks at R = Rbreak-up. Although the initial should be greater than σwater because of shell cohesion, the surface tension would relax to the value of an un-coated bubble (σwater) after break-up and remain at this value for all R > Rrupture. Afterwards, the surface tension reversibly returns to the elastic regime during the compression phase as Rbuckling ≤ R < Rrupture, and remains a constant σwater during each subsequent expansion phase as R ≥ Rrupture. Here, Rrupture is defined as the bubble radius that can be reached during each oscillation following initial break-up when σ(R) = σwater. For the value of Rbreak-up, two cases are considered in the present work: one is the case in which the shell surface tension σ reaches the critical value of σbreak-up; the other is the case in which the shell breaks up due to violent collapse. Flynn and his coworker [27], [28] established a radial oscillation threshold of R > 2R0 for inertial cavitation of free bubbles. Therefore, we set Rbreak-up to be min in the present work. The value of σbreak-up is set to be 1 N/m, reported by Marmottant et al. for the resistant shell [26].
IV. RESULTS AND DISCUSSION
A. Size Distribution of Definity Microbubbles
We begin with the ultrasound turned off. Highly diluted Definity suspensions were injected into the flow-cytometry system. When an individual microbubble enters into the focused laser beam, the scattered voltage increases. When the bubble exits, the scattered voltage decreases. A typical voltage versus time data set for a Definity microbubble is shown in Fig. 3. The peak amplitude corresponds to the bubble size, whereas the pulse duration is related to the velocity of the bubble transiting the laser beam. To obtain the equilibrium radius R0, we low-pass filter the signal, shown as a dashed line. We then apply the calibration obtained from Fig. 2 to extract R0. Fig. 3(b) shows a sample histogram of Definity microbubbles obtained in our system. In our study of 20 000 Definity microbubbles obtained over a ~5 min period, the mean diameter was measured to be 1.8 μm, with 99% smaller than 10 μm. This agrees well with the manufacturer’s specifications (1.1 to 3.3 μm average diameter and 98% smaller than 10 μm). We note that the application of a low-pass filter is not necessary under these conditions. We use it here because we also have performed sizing measurements when the ultrasound is turned on. Under those conditions, there is a high-frequency modulation of this low-frequency signal that must be filtered out (see Section IV-B).
Fig. 3.
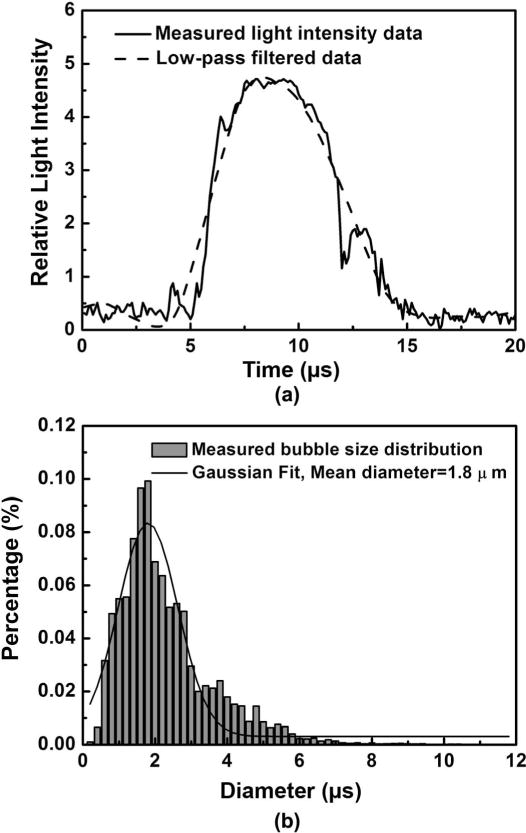
(a) A typical scatter vs. time curve for a bubble transiting the laser beam. To minimize the influence of high-frequency noise, a low-pass filter process was applied to the measured curve by reconstructing the low-frequency components using the MatLab Wavelet toolbox (dashed line). The bubble size is then calculated from the UCA calibration curve (Fig. 2). (b) Size distribution for Definity microbubbles measured with flow cytometry, along with a Gaussian fit. The height of each bin shows the percentage of bubbles within each 0.2-μm bin interval. The distribution and mean diameter are similar to manufacturer specifications.
Although these results are not unexpected, they show that an off-the-shelf flow cytometer can be a tool for characterizing the size and population of UCAs. In section IV-B, we will show that flow cytometers can also be used to characterize the shell properties, providing an all-in-one system that extracts population, size, and shell properties.
B. Shell Characterization of a Definity Microbubble
Fig. 4(a) illustrates how the cytometer signal changes when the ultrasound is turned on. UCAs transiting the laser beam are driven by the ultrasound, resulting in a modulation of the signal [compare with Fig. 3(a)]. The amplitude of this oscillation depends on the driving pressure. At this stage, we can low-pass filter the signal to pull out R0 (an alternative procedure to that described previously), or we can high-pass filter the data to generate a radius-time curve, using the calibration from Fig. 2. The results of both procedures are shown in Fig. 4(b). This data can then be fitted to the bubble dynamics model that we described in section III to extract shell properties.
Fig. 4.
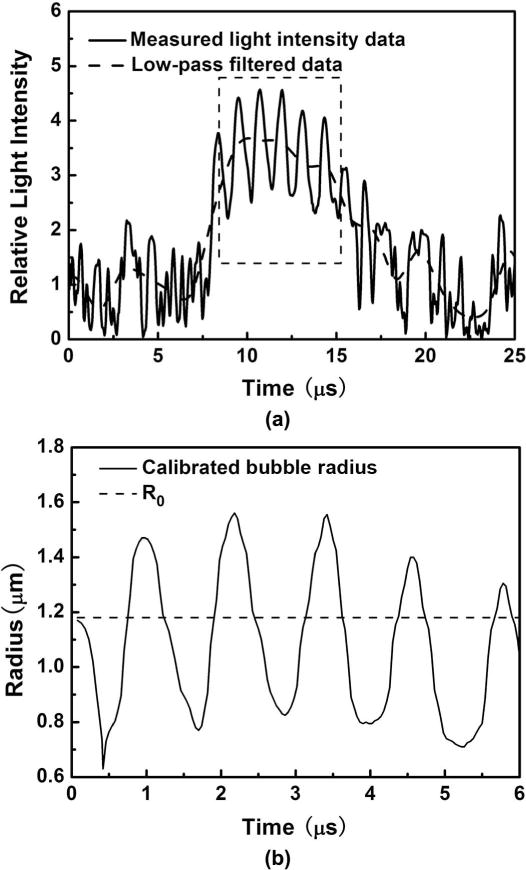
(a) Measured relative intensity scattered from a Definity microbubble driven by a 1-MHz ultrasound pulse. The signal within the rectangle was high-pass filtered and converted to a radius, shown in (b). The equilibrium radius R0 was determined from the low-pass filtered data, using the calibration data in Fig. 2.
The parameters for the model include the equilibrium radius, driving frequency, driving pressure, shell viscosity, and shell elasticity. The equilibrium radius R0 was measured as described previously. The applied driving frequency was 1 MHz. We were unable to insert a hydrophone into the small flow cell channel to measure the pressure. The pressure amplitude was obtained as follows: During the experiments, the driving pressures were measured as voltage amplitudes from the function generator. We fitted the initial experimental pressure Pa = kVa, where k is a scale value with the units of kilopascals per millivolt. The value of k was thus treated initially as a fitting parameter. After several numerical iterations with different data sets, this parameter converged to a value of 0.95 kPa/mV. In all subsequent experiments, we measured the pressure by applying this fitted calibration constant to the voltage signals. That is, knowing the applied voltage, and having found the constant k = 0.95 kPa/mV through iteration, the applied pressure can be determined. That leaves two unknown parameters, the shell viscosity and shell elasticity.
Definity microbubbles were driven at 1 MHz with pressures ranging from 95 kPa < Pa < 333 kPa. The shell parameters (χ, κs) for the Marmottant’s model were optimized with minimum standard deviation (STD). The STD value is defined as
| (3) |
where tstart and tend are the starting and ending points of the fitting region; Rexp,i and Rcal,i are the ith measured and simulated microbubble radius along the time span, respectively; and N is the total number of the fitting points. The following are some physical constants used for the simulation: P0 = 1.013 × 10⁵ Pa, Pv = 2.33 kPa, ρg = 1.161 kg/m3, γ = 1.07, ρL = 103 kg/m3, c = 1500 m/s, ηl = 2 × 10⁻³ Pa·s (effective liquid viscosity accounts for thermal damping [12]).
An example of a best-fit R(t) curve is shown in Fig. 5. The corresponding best-fit parameters are also listed in the figure legend. The Definity microbubble R(t) curve can be fitted well with the Marmottant’s model. Gorce et al. [7] deduced an average shell elasticity χ = 0.55 N/m and shell dilatational viscosity κs = 7.2 × 10⁻⁹ kg/s from attenuation measurements on lipid-shell SonoVue microbubble populations whose size distribution extends from ~0.7 to 10 μm. By fitting the R(t) curve measured with microbubble spectroscopy technology, van der Meer et al. [12] reported the best fit χ = 0.54 ± 0.10 N/m and the value of κs should range from 10−9 to 10−8 kg/s, for the lipid-shell BR14 microbubbles. In this particular example, the best-fit shell parameters are χ = 0.5 N/m and κs = 2.8 × 10⁻⁹ kg/s, which is consistent with previous reports. This is a typical result that suggests flow cytometry can be used to estimate shell properties of UCAs.
Fig. 5.
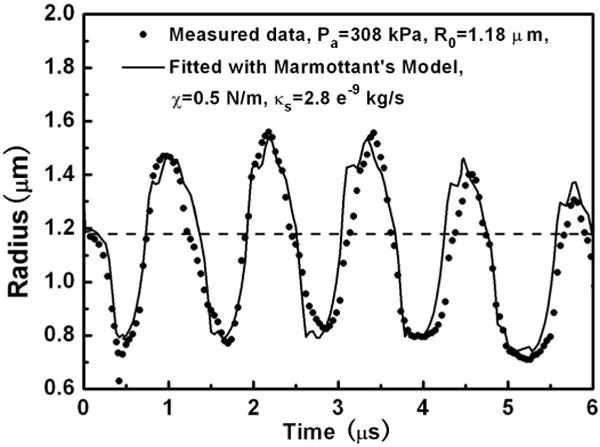
A sample best-fit response for a Definity microbubble using Marmottant’s model. The bubble was driven at 1 MHz with Pa = 308 kPa. The best-fit shell parameters are χ = 0.5 N/m and κs = 2.8 × 10⁻⁹ kg/s, with R0 = 1.18 μm. The dashed line indicates the position of R0.
C. Shell Parameters Versus Initial Microbubble Radius
Having shown that the bubble response curves measured with flow cytometry can be fitted with Marmottant’s model to estimate the shell parameters for Definity microbubbles, we applied this formalism to a series of Definity microbubbles to investigate the relationship between shell parameters (χ and κs) and the initial bubble radius R0. In this set of experiments, bubbles were driven with 1-MHz sinusoidal ultrasound pulses with driving pressures ranging from 95 to 333 kPa. At each pressure level, the data from a total of 40 bubbles were collected. Not every bubble produced an R(t) curve. The number of data sets with observable oscillations varied between 22 to 30 out of 40 bubbles at different driving pressure levels. The relative low percentage of active bubbles may be due to experimental conditions. The ultrasound pulse is much longer than the transit time of the bubble through the laser; it may be that the bubble fragmented before it entered the interrogation region. It may also be that there were excessive amounts of lipid material that didn’t form microbubbles. If this is the case, it suggests that there is room for improving the manufacture and/or administration of these agents.
To verify whether or not the current analysis strategy works for different types of lipid-shell UCA bubbles, the same method was also applied to a series of 84 data sets previously measured for SonoVue microbubbles exposed to ultrasound pulses driven at 2.5-MHz frequency and about 150-kPa pressure amplitude. The experimental details are described elsewhere [5], [6].
Within experimental error, the shell elastic compression modulus χ of lipid-shell UCA microbubbles is a constant 0.70 and 0.46 N/m for definity and SonoVue, respectively (see Fig. 6). It has been reported that the shell elastic compression modulus χ of lipid-shell UCA microbubbles varies with R0 if fitted to the Doinikov model [13], or the linearized Marmottant model [6]. However, when the full Marmottant model is used, as we did in the present work, the elastic modulus is nearly constant. The possible explanation for this disparity might arise from the selection of the bubble dynamics model. Because of complicated rheological changes of the lipid shell, UCA microbubbles can generate stronger nonlinear responses when insonified by stronger ultrasound pulses, leading to a different assessment of the shell properties. In our previous work with SonoVue [6], we used the linearized Marmottant’s model, which is not strictly valid for the stronger forcing conditions we used. In Doinikov et al.’s study, the experimental R(t) curves were fitted with a zero-thickness encapsulation model simplified from church’s equation based on the thin-shell assumption. They reported that the shell elasticity χ increases with increasing R0, but they suggested that the dependence of shell elasticity on bubble radius could be an artifact, because as a fundamental surface physical constant of a material, χ should be independent of the total amount of shell material or its surface area. They specifically pointed out in their paper that the simplified model might not be able to account for the complicated rheological characteristics of the lipid shell, leading to a misinterpretation of the dependence of shell elasticity on the bubble size. Using a more nonlinear model, our current results suggest that lipid-shelled UCA microbubbles should have a relatively uniform shell elastic modulus for different bubble sizes.
Fig. 6.
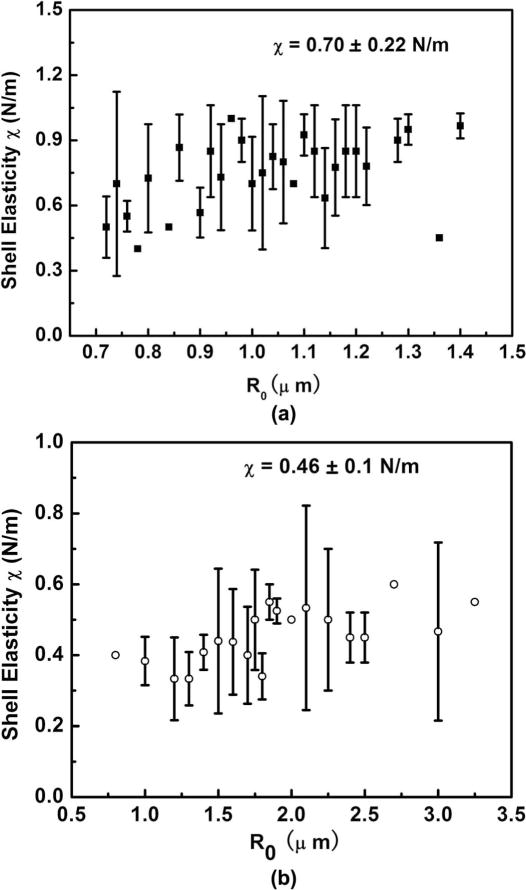
The relationship between shell elasticity and R0 for (a) Definity microbubbles and (b) SonoVue microbubbles. The shell elasticity estimation obtained from fitting the experimental R(t) curves with Marmottant’s model. Standard deviation error bars are used when multiple bubbles have the same radius.
As for the shell viscosity, the best-fit results suggest that the shell dilatational viscosity κs increases with increasing R0 for both definity and SonoVue microbubbles (see Fig. 7), which is consistent with previous experimental observations on lipid-shelled microbubbles [6], [10]–[13]. Van der Meer et al. [12] hypothesizes that the variation of shell viscosity with R0 should be attributed to rheological effect of shear thinning because of the dependence of shell viscosity on the dilatational shear rate, which is proportional to Ṙ/R.
Fig. 7.

The relationship between shell dilatational viscosity and R0 for (a) Definity microbubbles and (b) SonoVue microbubbles from a labbench light scattering system [6]. The shell dilatational viscosity estimation obtained from fitting the experimental R(t) curves with Marmottant’s model. Standard deviation error bars are used when multiple bubbles have the same radius.
D. Shell Viscosity Versus Maximum Shear Rate
There are examples in the literature that show the shell viscosity decreases with maximum shear rate [12], [13]. Such a relationship is a rheological manifestation of shear thinning. In Fig. 8, we plot the relationship between shell viscosity and the maximum shear rate Ṙ/R (calculated from the bubble’s R(t) curve) for both Definity and SonoVue microbubbles. As before, the values of shear viscosity κs were evaluated by fitting the experimental data with the Marmottant’s model. The maximum shear rates were estimated as (Ṙ/R)max ≈ 2π f0ΔRmax/R0, where ΔRmax is the maximum amplitude of the radial oscillations [12]. For a given driving pressure, the shell viscosity does indeed decrease with the increasing maximum shear rate, in agreement with previously published data that also used a single driving pressure [12], [13]. However, the maximum shear rate also increases with acoustic driving pressure, which is consistent with larger acoustic driving amplitudes inducing more severe bubble oscillations. Further, a family of shear-thinning curves is generated that apparently depends on the driving pressure.
Fig. 8.
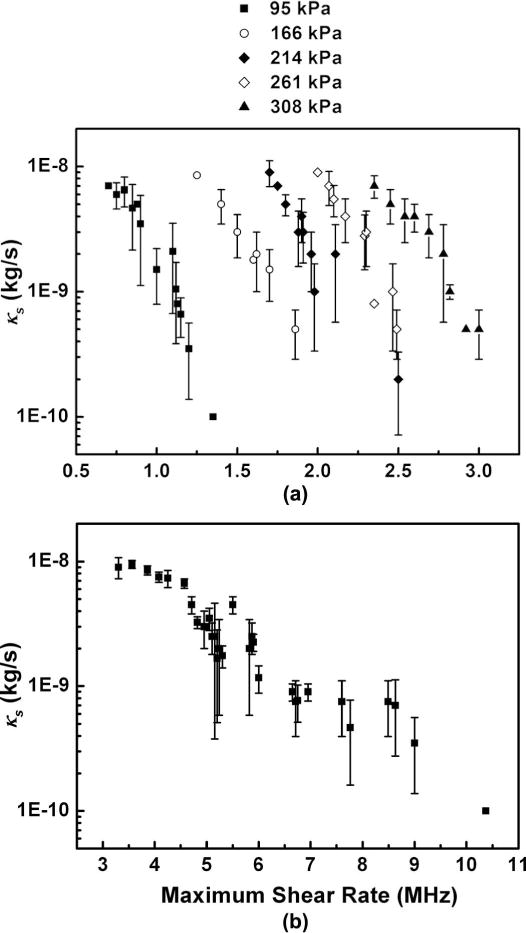
The relationship between the shell dilatational viscosity parameter and the measured maximum shear rate. (a) Definity microbubbles were exposed to pressures from 95 to 308 KPa, excited at 1-MHz using the modified flow cytometer. (b) SonoVue microbubbles were exposed to 2.5-MHz ultrasound at 150 kPa driving amplitude, and measured using a table-top light scattering setup (described in [6]).
One explanation for the family of curves is that the yield stress may depend on the applied pressure, manifested by realignment of the lipids during compression and expansion. As an example, hydrocarbons are predicted to have a family of shear thinning curves that depend on the pressure [29]. Another possible explanation may lie in the simplified shell viscous term adopted in the Marmottant’s model, which might not account for a more complicated rheological nature of viscous stress acting inside the lipid shell. Doinikov et al. has suggested that the linear shell viscous term used in the simplified bubble dynamic model might suffer from an incomplete description of the full complexity of the rheological properties of the coating [13]. They point out that the shear-thinning behavior can be better modeled by adopting a more appropriate function (e.g., the Cross Law) to account for the nonlinear viscous stress. They also state that an explicit form of the function requires experimental data. Our ability to generate thousands of data sets at different pressures makes it possible to obtain these experimental data, which is important for improving the bubble dynamic model by accounting for a more complete rheological behavior of the shell.
Two final points are worth mentioning. First, it is possible to incorporate ultrasound into a variety of flow systems, possibly also the Coulter Multisizer and other commercial light scattering systems. Second, it is possible to add fluorescence and sorting to a flow cytometer system. Fluorescence and sorting can be used to selectively sort microbubbles that are tagged, enhancing their concentration. In combination with cells, one can also identify tagging and/or therapeutic efficacy. We are currently working on expanding this area of research.
V. CONCLUSION
An off-the-shelf flow cytometer was modified with an ultrasound transducer to activate microbubbles passing through the sensing region of the cytometer. The temporal evolution of individual Definity microbubbles were measured in real-time, and then converted to R(t) curves. The shell parameters of Definity microbubbles were quantified by fitting the measured R(t) curves with Marmottant’s model. The results show that the shell dilatational viscosity κs increases with increasing initial bubble radius, and decreases with increasing shear rate. The shell elastic modulus χ remains constant. We also compared the shell parameters for SonoVue with Definity microbubbles. Without ultrasound exposure, the size and population of Definity were measured. Flow cytometry can thus be used to size, count, and obtain shell parameter information for ultrasound contrast agents.
Acknowledgments
We thank K. Crawford for help in the lab.
This work was funded in part by NIH 5r01EB000350 (NIBIB), the National Basic Research Program 973 of China (Grant No. 2011CB707900), the National Natural Science Foundations of China (Grant No. 10434070, 10704037, and 11074123), and the Research Fund for the Doctoral Program (for new scholar) of Higher Education of China (20070284070).
Biographies
Juan Tu was born in July 1976, in Nanjing, Jiangsu, China. She received the B.S. and M.S. degrees from the Department of Electronic Science and Engineering at Nanjing University, China, in 1998 and 2001, respectively. In 2002, she received the M. S. degree from the Department of Mechanical Engineering at Yale University. Then she studied in the Applied Physics Laboratory at the University of Washington and finally received the Ph. D. degree from the Department of Bioengineering in 2006. Since 2007, she has moved back to China and obtained a faculty position at Nanjing University. She is currently an associate professor if the Department of Acoustics in the School of Physics. Her research interests are the nonlinear acoustics, medical ultrasound, bubble dynamics, and the mechanisms and related bioeffects of ultrasound-induced cavitation activities. She is the member of Acoustical Society of China, and the International Society for Therapeutic Ultrasound.

Jarred Swalwell was born on March 18 in Seattle, WA. He earned a B.S. degree in physics from the University of Washington (Seattle, WA) in 1997, and an M.S. degree in mechanical engineering/acoustics from the University of Texas at Austin (Austin, TX) in 2000. From 2000 to 2002 he worked as a Transducer Engineer and engineering project manager for Bose corporation, Boston, MA. From 2003 to 2008 he worked as a Research Engineer at the Applied Physics Laboratory at the University of Washington, designing and constructing experimental equipment for research in high-intensity ultrasonics. In 2008, he accepted a position as Research Scientist within the School of Oceanography at the University of Washington, and has developed a novel flow cytometer for oceanographic field research. He has applied for three patents for flow cytometry technology and instrument automation.

David Giraud was born in Rochester, MN, in 1984 and spent his childhood in Tigard, OR. He graduated from the University of Washington in 2008 with B.S. degrees in physics and applied and computational mathematical sciences. After graduating, he worked at the University of Washington Applied Physics Laboratory as a research engineer in the Center for Industrial and Medical Ultrasound. His projects included the study of cavitation, shock waves in water, and encapsulated microbubbles by taking measurements using optical techniques such as high-speed imaging and light scattering. He is currently pursuing a Ph.D. degree in mechanical engineering at Boston University with support of a graduate teaching fellowship.
Weicheng Cui was born in September 1985 in Jiangsu, China. He received a B.S. degree from the Department of Electronic Science and Engineering at Nanjing University, China, in 2007. He is currently a Ph.D. degree candidate in the Department of Electronic science and Engineering. Since 2006, he has worked as a graduate student in the Key Laboratory of Modern Acoustics (MOE), China, and his research projects focus on the theoretical and experimental studies of bubble dynamics and sonoluminescence.
Weizhong Chen was born in July 1959, in Zhejiang, China. In 1982, he received a B. S. degree from the Department of Physics in Zhejiang Normal University. He received an M.S. degree from the Department of Physics at Huazhong Normal University in 1987. Since 1994, he has joined the Key Laboratory of Modern Acoustics at Nanjing University and received a Ph.D. degree from the Department of Electronic Science and Engineering in 1996. He is currently a professor of the Department of Acoustics in the School of Physics at Nanjing University. He had been the director of the State Key Laboratory of Modern Acoustics and the vice-Director of the Institute of Acoustics at Nanjing University. He is a fellow in the Acoustical Society of China. His research interests are nonlinear acoustics, acoustic cavitation, and sonoluminescence. He has published more 100 academic literatures and received the Science and Technology Progress Award from the Ministry of Education, China, in 1998.

Thomas J. Matula earned his Ph.D. degree in physics at Washington State University, Pullman, WA. His research project, under the guidance of Professor Philip Marston, concerned the generation, diffraction, and radiation of subsonic flexural waves on membranes and plates. He then moved to the Applied Physics Laboratory (APL) in Seattle, WA, to work under Dr. Ron Roy in the field of sonoluminescence. There, he also worked with Larry Crum, Willy Moss, and Kenneth Suslick on a variety of sonoluminescence and sonochemistry projects. These led to honors from the Department of Defense (Young Scientist and Engineer Award), and the prestigious Presidential Early Career Award.
His current research interests include ultrasound contrast agents for molecular imaging and therapy, shock wave therapy, and applications of ultrasound to industrial problems. He enjoys both the fundamental physics of ultrasound and the commercialization of ultrasound-based technologies. Dr. Matula is currently the Director of the Center for Medical and Industrial Ultrasound (CIMU). He is also the Executive Director of the Center for Ultrasound-Based Molecular Imaging and Therapy, dedicated to the commercialization of ultrasound-based technologies. He holds several patents, and has a startup company dedicated to the development of ultrasound-based technologies.
Contributor Information
Juan Tu, Key Laboratory of Modern Acoustics (Ministry of Education), Department of Physics, Nanjing University, Nanjing, P. R. China.
Jarred E. Swalwell, Center for Industrial and Medical Ultrasound and the Center for Ultrasound-Based Molecular Imaging and Therapy, Applied Physics Laboratory, University of Washington, Seattle, WA
David Giraud, Center for Industrial and Medical Ultrasound and the Center for Ultrasound-Based Molecular Imaging and Therapy, Applied Physics Laboratory, University of Washington, Seattle, WA.
Weicheng Cui, Key Laboratory of Modern Acoustics (Ministry of Education), Department of Physics, Nanjing University, Nanjing, P. R. China.
Weizhong Chen, Key Laboratory of Modern Acoustics (Ministry of Education), Department of Physics, Nanjing University, Nanjing, P. R. China.
Thomas J. Matula, Email: matula@apl.washington.edu, Center for Industrial and Medical Ultrasound and the Center for Ultrasound-Based Molecular Imaging and Therapy, Applied Physics Laboratory, University of Washington, Seattle, WA.
References
- 1.Goldberg BB, Raichlen JS, Forsberg F. Ultrasound Contrast Agents—Basic Principles and Clinical Applications. 2. London: Martin Dunitz; 2001. [Google Scholar]
- 2.Ferrara K, Pollard R, Borden M. Ultrasound microbubble contrast agents: Fundamentals and application to gene and drug delivery. Annu Rev Biomed Eng. 2007;9:415–447. doi: 10.1146/annurev.bioeng.8.061505.095852. [DOI] [PubMed] [Google Scholar]
- 3.Mitragotri S. Innovation—Healing sound: The use of ultrasound in drug delivery and other therapeutic applications. Nat Rev Drug Discov. 2005 Mar;4(3):255–260. doi: 10.1038/nrd1662. [DOI] [PubMed] [Google Scholar]
- 4.Stride E, Saffari N. On the destruction of microbubble ultrasound contrast agents. Ultrasound Med Biol. 2003 Apr;29(4):563–573. doi: 10.1016/s0301-5629(02)00787-1. [DOI] [PubMed] [Google Scholar]
- 5.Guan JF, Matula TJ. Using light scattering to measure the response of individual ultrasound contrast microbubbles subjected to pulsed ultrasound in vitro. J Acoust Soc Am. 2004 Nov;116(5):2832–2842. doi: 10.1121/1.1795334. [DOI] [PubMed] [Google Scholar]
- 6.Tu J, Guan JF, Qiu YY, Matula TJ. Estimating the shell parameters of SonoVue(r) microbubbles using light scattering. J Acoust Soc Am. 2009 Dec;126(6):2954–2962. doi: 10.1121/1.3242346. [DOI] [PMC free article] [PubMed] [Google Scholar]
- 7.Gorce JM, Arditi M, Schneider M. Influence of bubble size distribution on the echogenicity of ultrasound contrast agents—A study of SonoVue(TM) Invest Radiol. 2000 Nov;35(11):661–671. doi: 10.1097/00004424-200011000-00003. [DOI] [PubMed] [Google Scholar]
- 8.Chang PH, Shung KK, Wu SJ, Levene HB. Second-harmonic imaging and harmonic Doppler measurements with Albunex(r) IEEE Trans Ultrason Ferroelectr Freq Control. 1995 Nov;42(6):1020–1027. [Google Scholar]
- 9.Sboros V, Glynos E, Pye SD, Moran CM, Butler M, Ross J, Short R, McDicken WN, Koutsos V. Nanointerrogation of ultrasonic contrast agent microbubbles using atomic force microscopy. Ultrasound Med Biol. 2006 Apr;32(4):579–585. doi: 10.1016/j.ultrasmedbio.2005.12.016. [DOI] [PubMed] [Google Scholar]
- 10.Morgan KE, Allen JS, Dayton PA, Chomas JE, Klibanov AL, Ferrara KW. Experimental and theoretical evaluation of microbubble behavior: Effect of transmitted phase and bubble size. IEEE Trans Ultrason Ferroelectr Freq Control. 2000 Nov;47(6):1494–1509. doi: 10.1109/58.883539. [DOI] [PubMed] [Google Scholar]
- 11.Dayton PA, Morgan KE, Klibanov AL, Brandenburger GH, Ferrara KW. Optical and acoustical observations of the effects of ultrasound on contrast agents. IEEE Trans Ultrason Ferroelectr Freq Control. 1999 Jan;46(1):220–232. doi: 10.1109/58.741536. [DOI] [PubMed] [Google Scholar]
- 12.van der Meer SM, Dollet B, Voormolen MM, Chin CT, Bouakaz A, de Jong N, Versluis M, Lohse D. Microbubble spectroscopy of ultrasound contrast agents. J Acoust Soc Am. 2007 Jan;121(1):648–656. doi: 10.1121/1.2390673. [DOI] [PubMed] [Google Scholar]
- 13.Doinikov AA, Haac JF, Dayton PA. Modeling of nonlinear viscous stress in encapsulating shells of lipid-coated contrast agent microbubbles. Ultrasonics. 2009 Feb;49(2):269–275. doi: 10.1016/j.ultras.2008.09.007. [DOI] [PMC free article] [PubMed] [Google Scholar]
- 14.Shapiro HM. Practical Flow Cytometry. New York, NY: Wiley; 2003. pp. 190–194. [Google Scholar]
- 15.Aden AL, Kerker M. Scattering of electromagnetic waves from 2 concentric spheres. J Appl Phys. 1951;22(10):1242–1246. [Google Scholar]
- 16.Marston PL. Colors observed when sunlight is scattered by bubble clouds in seawater. Appl Opt. 1991 Aug 20;30(24):3479–3484. doi: 10.1364/AO.30.003479. [DOI] [PubMed] [Google Scholar]
- 17.Marston PL, Billette SC, Dean CE. Scattering of light by a coated bubble in water near the critical and Brewster scattering angles. Ocean Optics IX. 1988;925:308–316. [Google Scholar]
- 18.Bohren CF, Huffman DR. Absorption and Scattering of Light by Small Particles. New York: Wiley; 1988. [Google Scholar]
- 19.Kerker M. The Scattering of Light and Other Electromagnetic Radiation. New York, NY: Academic; 1969. [Google Scholar]
- 20.Guan JF. Ph.D. Thesis. Electrical Engineering Dept., Univ. of Washington; Seattle, WA: 2005. Light scattering and imaging techniques applied to sonoluminescence and ultrasound contrast bubbles. [Google Scholar]
- 21.Dejong N, Cornet R, Lancee CT. Higher harmonics of vibrating gas-filled microspheres. 1. Simulations. Ultrasonics. 1994 Nov;32(6):447–453. [Google Scholar]
- 22.Dejong N, Cornet R, Lancee CT. Higher harmonics of vibrating gas-filled microspheres. 2. Measurements. Ultrasonics. 1994 Nov;32(6):455–459. [Google Scholar]
- 23.Church CC. The effects of an elastic solid-surface layer on the radial pulsations of gas-bubbles. J Acoust Soc Am. 1995 Mar;97(3):1510–1521. [Google Scholar]
- 24.Chatterjee D, Sarkar K. A Newtonian rheological model for the interface of microbubble contrast agents. Ultrasound Med Biol. 2003 Dec;29(12):1749–1757. doi: 10.1016/s0301-5629(03)01051-2. [DOI] [PubMed] [Google Scholar]
- 25.Hoff L. Acoustic Characterization of Contrast Agents for Medical Ultrasound Imaging. Dordrecht, The Netherlands: Kluwer Academic; 2001. [Google Scholar]
- 26.Marmottant P, van der Meer S, Emmer M, Versluis M, de Jong N, Hilgenfeldt S, Lohse D. A model for large amplitude oscillations of coated bubbles accounting for buckling and rupture. J Acoust Soc Am. 2005;118(6):3499–3505. [Google Scholar]
- 27.Flynn HG. Cavitation dynamics. 1. Mathematical formulation. J Acoust Soc Am. 1975;57(6):1379–1396. [Google Scholar]
- 28.Flynn HG, Church CC. Transient pulsations of small gasbubbles in water. J Acoust Soc Am. 1988 Nov;84(5):1863–1876. doi: 10.1121/1.397253. [DOI] [PubMed] [Google Scholar]
- 29.Kioupis LI, Maginn EJ. Impact of molecular architecture on the high-pressure rheology of hydrocarbon fluids. J Phys Chem B. 2000;104(32):7774–7783. [Google Scholar]