Abstract
Objective
To propose a standard measure of absenteeism (the work lost rate [WLR]) be included in future research to facilitate understanding and allow for translation of findings between scientific disciplines.
Methods
Hourly payroll data derived from “punch clock” reports was used to compare various measures of absenteeism used in the literature and the application of the proposed metric (N = 4000 workers).
Results
Unpaid hours and full absent days were highly correlated with the WLR (r = 0.896 to 0.898). The highest percentage of unpaid hours (lost work time) is captured by absence spells of 1 and 2 days duration.
Conclusion
The proposed WLR metric captures: 1) The range and distribution of the individual WLRs, 2) the percentage of subjects with no unpaid hours, and 3) the population WLR and should be included whenever payroll data is used to measure absenteeism.
Absenteeism, when studied by researchers in occupational medicine, human resources, social epidemiology, and labor economics, encompasses several distinct issues: 1) An indirect cost of disease and injury, 2) lost productivity, and 3) an indicator of social disengagement. 1 Although many researchers have focused on health and medical reasons for absenteeism, others have emphasized personal and social factors. Chadwick-Jones2 proposes that the choice to attend work is the result of 1) the individual act of choice between alternative activities, 2) a withdrawal or escape from surveillance, or 3) an individual or group’s resistance to an inflexible system. Goodman3 further classifies absenteeism as either 1) an approach-avoidance behavior (which includes the Steers and Rhodes attendance model4), 2) the result of a decision process, 3) the outcome of an adjustment process, 4) a habit, 5) a consequence of an apparently unrelated event, or 6) a unique phenomenon. More remarkable than these diverse interpretations, is that the measure of absenteeism has also been variably defined, in part, to fit the various needs and objectives of divergent interested parties and researchers, and in part, due to the available sources of information.
Consumers of absenteeism research are myriad and include government agencies looking to reduce absenteeism rates by changing wage replacement and social insurance programs; disability carriers looking to maximize profit while still meeting the standard of care of return to work; employers looking to minimize absenteeism by local administrative controls and policies; physicians tasked with determining the timeline for return to work; and labor economists working to optimize economic incentives to encourage attendance. As a result, each of these consumers have measured and predicted absenteeism using their own metrics, each with its own unique definition, numerator, and denominator. Commonly used absenteeism outcomes include hours absent,5–8 days absent2,9–17, and duration of absence spells2,10,13,15,18–21 either as the sole measure of absenteeism or in some combination. The metrics previously used in these studies has been recently and comprehensively reviewed.22,23
In addition to the confusion brought about by competing absenteeism metrics, further difficulty arises due to the often overlooked distinction between absenteeism (defined as time missed from work when one is scheduled to work) and sickness absence. Sickness absence (aka “sick-leave”), a popular term in Europe, has been defined, in research and in practice, as absence from work due to sickness.24 Research on sickness absence has been facilitated by the fact that most national social insurance programs require medical certification to qualify for benefits10,18,25. However, while it is often assumed that absence measured in these registries is due to ill health, researchers have shown poor correlation between actual illness and physician certification of illness for the purposes of obtaining wage replacement.26 Because the majority of administrative rules only allow for approved absence due to illness, most absences will then be reported by the employee as due to sickness.
Given the divergent (yet complimentary) research fields in absenteeism, it is our opinion that a standardized measure of absenteeism is needed to help translate findings across disciplines. Moreover, due to the competing definitions currently in use for an “absence day”, “sick-listed period”, “sick-day”, “long-term”, and “short-term absences” etc., it is our belief that a standardized, cross-discipline measure of absenteeism can be accomplished only by using a straightforward and readily calculated measure based solely on hours worked and hours not worked.
There are two main objectives of this article: 1) To introduce and demonstrate the calculation of a metric (the Work Lost Rate [WLR]) that can be easily derived from hourly payroll data, and 2) show how the WLR compares to other measures of absenteeism (absence days and duration of absence spell) that are currently in use. We hope that the WLR will be included in all studies that utilize payroll data, not as a replacement of existing measures of absenteeism, but as a standard metric which will facilitate interdisciplinary research and collaboration on absenteeism or sickness absence.
Materials and Methods
As part of a longstanding research relationship between Yale University and Aloca, various administrative data sets were available for this work and have been described elsewhere.27 Research utilizing this administrative data is under the approval of both Yale’s Human Investigation Committee and the company’s Occupational and Environmental Health Advisory Committee.
To demonstrate the relationship between various measures of absenteeism, we created a study file of three plant years using hourly payroll data derived from “punch clock” reports from three primary aluminum production facilities beginning on Monday, January 1, 2001 and ending Sunday, December 30, 2001. These data were used to create 52 consecutive work weeks (364 days) as defined by the United Steel Workers of America Union master agreement with Alcoa, which defines the work-week as the shift beginning the closest to midnight Sunday and ending the following Sunday. Calendar work weeks were therefore defined as seven consecutive calendar days (Monday to Sunday) for the plant year as defined by the labor agreement. The same labor agreement also covers overtime, incentives, scheduled vacation days, and holiday pay for all plants. All three plants share the same health care benefits and are engaged in similar production activities.
For each individual in the data set, daily payroll data consisting of the number of hours recorded for each calendar day (none to 24 hours) and pay-type associated with the hours (work, vacation, unpaid) in the study set was linked to human resource data which updates any time a status change occurs for an individual worker (example: retirement, change in job, disability, etc). Any worker can potentially receive all three pay types (and corresponding hours) on any given day.
Paid hours in the daily payroll data are paid work hours. Vacation hours are paid vacation hours and includes both plant wide holidays (example: 4th of July) and personal vacation days as defined by the labor agreement. Unpaid hours are the hours a worker was scheduled to work on a given calendar day, but was not at work. There are no paid “sick days” or “personal days” in the Alcoa workforce, therefore, we considered all unpaid hours as absent hours. No separate measures of shift, hourly rate, usual work hour versus overtime hour, or reason for absence is included in the payroll data. If a worker is scheduled to work on a holiday and does not show up at work, the hours they were suppose to have worked are recorded as unpaid hours. Notably, workers may or may not receive wage replacement, such as short-term disability or worker’s compensation, for some or all of the absent hours. Hence, the definition reflects scheduled, but lost work time to the company, irrespective of the reason.
To demonstrate the impact of changing the definitions of absence and to remove possible confounding by persons leaving the workforce (due to serious illness, death, retirement etc), the decision was made to limit the study set to hourly workers who were actively employed as of the first day of the plant year (January 01, 2001) and the last day of the plant year (December 30, 2001) as defined by the human resources data.
The Work Lost Rate
By modifying the current Bureau of Labor Statistics metric [(hr absent/hr usually worked) × 100] to include a more explicit definition of the denominator, we used daily hourly payroll data to calculate the following absenteeism metric for each subject:
For this article, the WLR was used as the standard measure of absenteeism for each hourly worker in the study set. (Note: We considered including vacation hours in the denominator as a way to adjust for tenure and thus an individual’s available vacation time since, a worker with 5 weeks of vacation could potentially reduce his or her potential hours worked in a year by approximately 200 hours compared to a worker with no weeks of personal vacation days. The WLR with the inclusion of paid vacation hours in the denominator was also calculated and is highly correlated with the proposed WLR (R2 = 0.9979) (data not shown). Paid work hours, paid vacation hours, and unpaid hours were defined by the individual payroll department at each plant and were brought into the study set without modification.
Other Measures of Absenteeism
To compare the WLR with other measures of absenteeism that are currently in use, the same payroll data that was used to calculate the WLR was also used to calculate both absent days and duration of absence spell. As there is no universally agreed upon method to transform hourly payroll data into absent days, several different definitions were considered and the results of using various definitions of an absent day are shown in Table 1. For calculation of duration of absence spell, the most restrictive definition of a full absent day (definition #1) was used. Note that the decision to count a worker absent on a given calendar day is dependent on the total amount of unpaid hours on a given day and the absence of any other pay type designations for that given day.
TABLE 1.
Twenty-fifth, 50% (Median), 75% Percentile, and Total Number of Absence Days in the Study Set Using Various Definitions of a Full Absence Day
| Definition | N | 25% | 50% | 75% | Sum (d) |
|---|---|---|---|---|---|
| 1. Greater than or equal to 8 unpaid hr with no paid or vacation hr | 4,000 | 0 | 2.0 | 6.0 | 19,943 |
| 2. Greater than or equal to 4 unpaid hr with no paid or vacation hr | 4,000 | 0 | 2.0 | 6.0 | 20,039 |
| 3. Any unpaid hr with no paid or vacation hr | 4,000 | 0 | 2.0 | 6.0 | 20,274 |
| 4. Any unpaid hr on a calendar day regardless of other paid hr | 4,000 | 1.0 | 4.0 | 10.0 | 31,739 |
Reported from the most restrictive definition (definition 1) to the least restrictive definition of a full absence day (definition 4).
Using definition #1 of a full absent day, the duration of each absence spell was then calculated as the number of consecutive workdays absent (ie, days that met the above definition of a full absent day). Consecutive workdays are defined by the payroll data, specifically, if a worker is not scheduled to work, has no paid vacation hours, and has no unpaid hours for a given calendar day, that calendar day is not included in the payroll data, and therefore not a part of the calculation of absence duration. To illustrate the absence duration calculation, a worker who had at least eight unpaid hours (with no paid hours or paid vacation hours) for two consecutive workdays, who then had any paid or unpaid vacation hours or both on the third workday would be counted as having a two-day absence. Days where a worker left work early the workday before a full absent day or returned to work late after a full absent workday but still received any paid hours on that consecutive workday are not included in the calculation of absence duration. In addition, since only consecutive workdays were used to calculate absence duration, absence duration does not take into account routine days off, such as weekends. For example, if a worker was absent on Friday, not scheduled to work on Saturday or Sunday, absent on Monday, and returned to work on Tuesday, they would also be counted as having a two-day absence.
If a worker received paid hours or paid vacation hours on a given day, in addition to unpaid hours, (or less than 8 hours unpaid with no paid or paid vacation days) this was not considered a full absent day; instead, this was counted as a partial absent day (note that no measure of duration is captured in the measure of partial absent days). For example, if a worker left early or arrived late to work on three consecutive days, they were counted as having three partial absent days and not as having an absence duration of 3 days.
Statistical Methods
Data analysis and record linkage was performed using SAS (Cary, NC) and Microsoft Excel. Correlation coefficients were used to determine the association between the WLR and the various measures of absenteeism. Density plots were also used to demonstrate how the patterns and distributions of absence duration change across the population. The percentiles for the density plots were determined using a univariate procedure on the number of total unpaid hours per individual worker. Absenteeism rank was calculated from best (lowest WLR [in this study set, WLR = 0]) to worst (highest WLR) by cumulative percentages (frequency). Age was stratified by the individual’s age as of the first day of the plant year (January 01, 2001). Because of the small number of individuals less than 21-years old, they were combined into one stratum of individuals less than 30 years of age.
Results
The final data set consists of 4000 hourly workers (3748 male [93.7%], 248 female [6.2%], missing = 4) at the three US locations. Average tenure was 20.95 years (median, 24.15; SD, 10.95; range, 0.03 to 59.63 years) and average age was 48.38 (median, 49.79; SD, 8.81; range, 18.76 to 80.79).
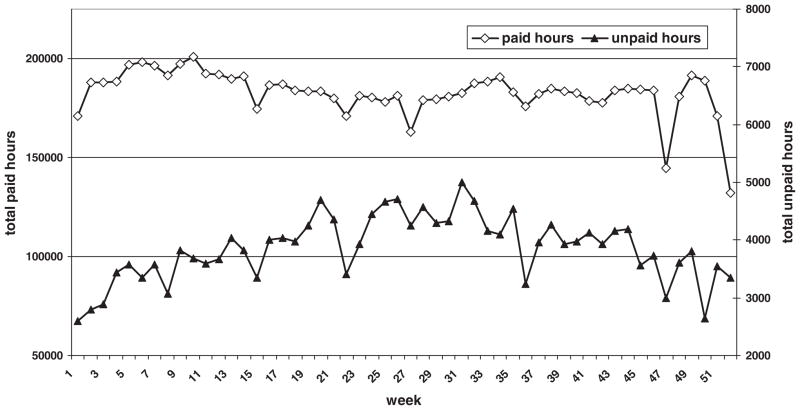
A basic plot of paid work hours and unpaid hours by calendar week are shown in Fig. 1. This figure provides a picture of the overall production cycles, and differences by calendar work weeks. Drops seen in paid work hours typically correspond to scheduled plant-wide defined vacations, with the largest drops seen around Thanksgiving (2-day holiday) and Christmas (2-day holiday). This is reflected in the increase in paid vacations hours for the same weeks during the year (data not shown). Of note is the relatively low number of unpaid hours around the holidays, likely due to the contract language which specifies attendance requirements for holiday pay where workers have to work the five previous scheduled workdays before the holiday to qualify for this benefit.
Fig. 1.
Paid and unpaid hours for 52 consecutive work weeks beginning January 1, 2001 at three primary aluminum manufacturing sites (N = 4000).Total paid hours = 9,499,060, and total unpaid hours = 200,618.
The Work Lost Rate
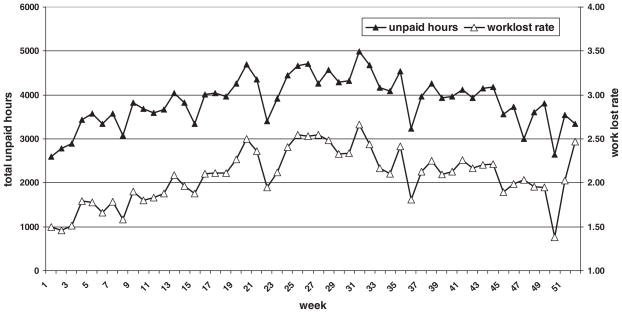
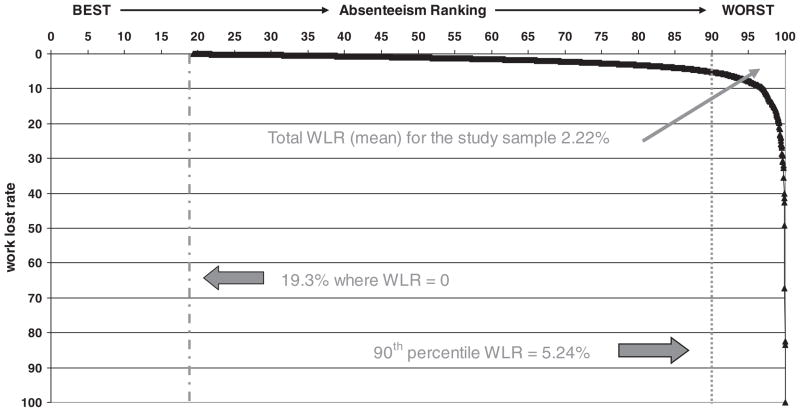
Total unpaid hours versus average WLR by calendar week is presented in Fig. 2. The measures are highly correlated (r = 0.898) with some departure seen around the December–January holidays. Figure 3 shows the individual WLRs by calendar year for the entire population (N = 4000) by cumulative percentage. Encompassed in Fig. 3 is 1) the range and distribution of the individual WLR for all 4000 workers, 2) the percentage of subjects with no unpaid hours (WLR = 0, in this set, 19.3%), and 3) the population WLR, which is equal to the area over the curve for the study population (in this set 2.22%). Using the data to inform us as to where absenteeism may be due to illness or injury, we can use the percentile distribution to place a theoretical line where absence becomes more likely due to illness or injury. For purposes of illustration, we have chosen the 90th percentile for this study population, which has a WLR of 5.24%.
Fig. 2.
Unpaid hours and WLR [(unpaid hours)/(unpaid hours + paid work hours)] × 100 for 52 consecutive work weeks beginning January 1, 2001 at three primary aluminum manufacturing sites (N = 4000). Mean WLR by week: 2.07, median 2.10, SD 0.31, range, 1.38 to 2.66. Correlation coefficient = 0.898.
Fig. 3.
WLR by absenteeism rank (N = 4000). Note: 1) the percentage of the work force with no unpaid hours (WLR = 0) (19.3%) and 2) the range and distribution of the WLR. The total WLR (mean) for the sample is the area over the curve.
Comparing the WLR to Other Measures of Absenteeism
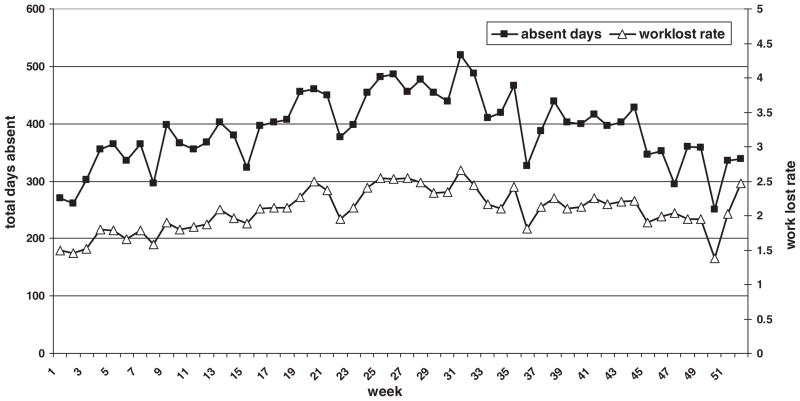
Figure 4 shows the relationship between the WLR and full absent days (definition #1). As shown in Fig. 4, WLR and full absent days are highly correlated (r = 0.896). In addition, given that the WLR and full absent days are highly correlated, the WLR likewise captures the same information as absent days in this workforce.
Fig. 4.
Absence days (using definition I) and WLR for 52 consecutive work weeks beginning January 1, 2001 at three primary aluminum manufacturing sites (N = 4000). Mean absent days per week: 390, median 397, SD 61.9, range, 250 to 519. Correlation coefficient = 0.896.
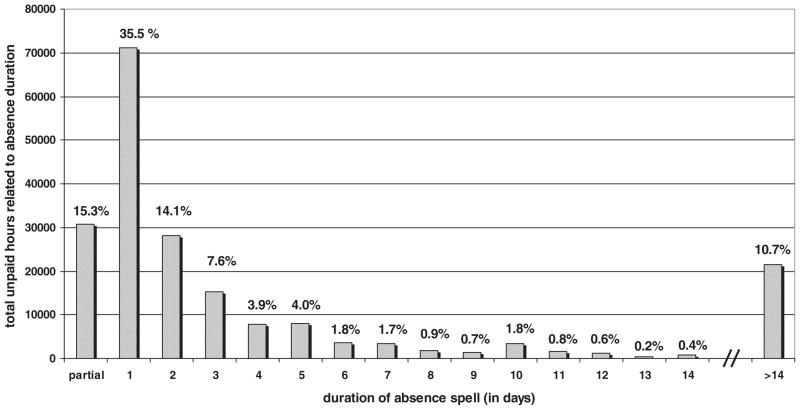
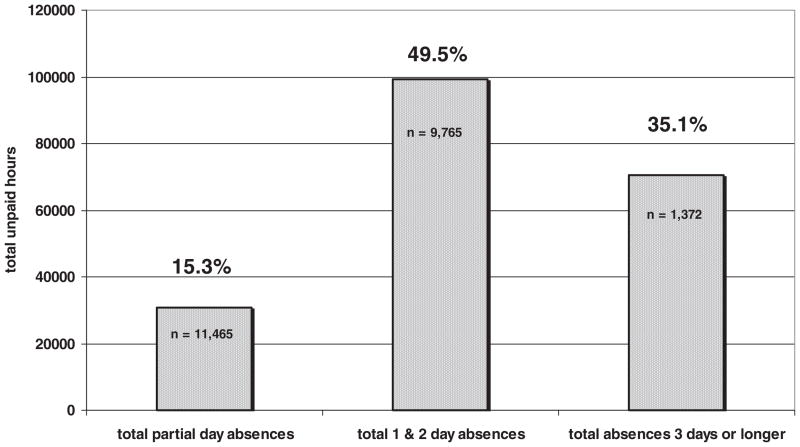
The percentage of unpaid hours and the overall distribution of absence spells by duration of absence spell is shown in Fig. 5. The percentage of unpaid hours by absence spell duration can be collapsed into three groups based on the current literature: partial, 1 and 2 days, and 3 days or longer (Fig. 6). These data show that 49.5% of the lost work hours in this population are due to 1 and 2 day absences and 35.1% of the lost work hours are explained by absences of 3 days or longer. Absences meeting the Whitehall II definition of a long-term absence (≥7 days) account for approximately 25% of the total absence spells (and 50% of the hours) lasting 3 days or longer, but only 17% of the total lost work hours (data not shown).
Fig. 5.
Distribution and percentage of total unpaid hours by duration of absence spell. There were 11,465 partial absence days, 8086 1-day absences, 1679 2-day absences, and 601 3-day absences. Eighty-five absences lasted greater than 14 days with a median of 200 unpaid hours per spell (range, 120 to 1712 hours).
Fig. 6.
Total unpaid hours by absence spell duration (partial days absent, 1 and 2 days absences, absences lasting 3 days or longer). Percentage of total absence hours and number of occurrences is reported (N = 4000).
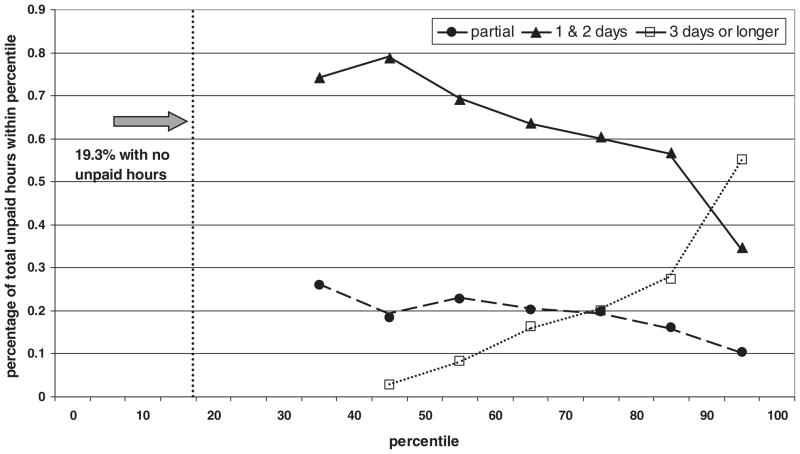
Stratifying the population from the lowest to highest percentages of total unpaid hours, the distribution of unpaid hours by absence duration changes and is shown in Fig. 7. Among the workers with the greatest number of total unpaid hours, the 91st–100th percentile groups (the 10% of the subjects with the most unpaid hours), most unpaid hours are due to spells of 3 days or longer. Between the 80th and 90th percentiles, the most unpaid hours are contained in the 1 and 2 days absences. Partial absence days are distributed evenly throughout the percentiles and there are no absences lasting 3 days or longer below the 40th–50th percentile.
Fig. 7.
Percent distribution of unpaid hours by percentile (density) as determined by total unpaid hours (N = 4000). 19.3% of employees (N = 773) had no unpaid hours during the year (0 to 20th percentile). The 21 to 30th percentile had no 1-day or 2-day absences.
An Application of the WLR
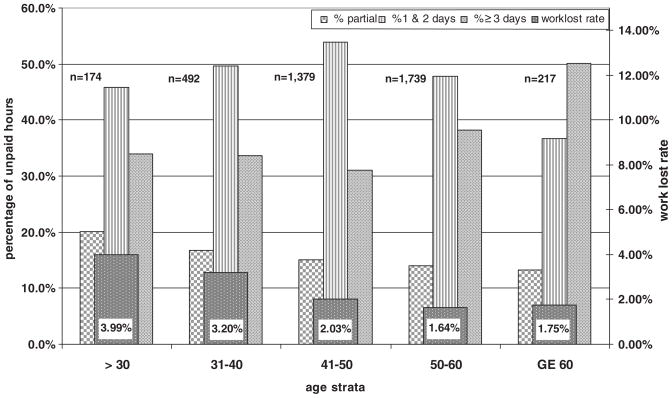
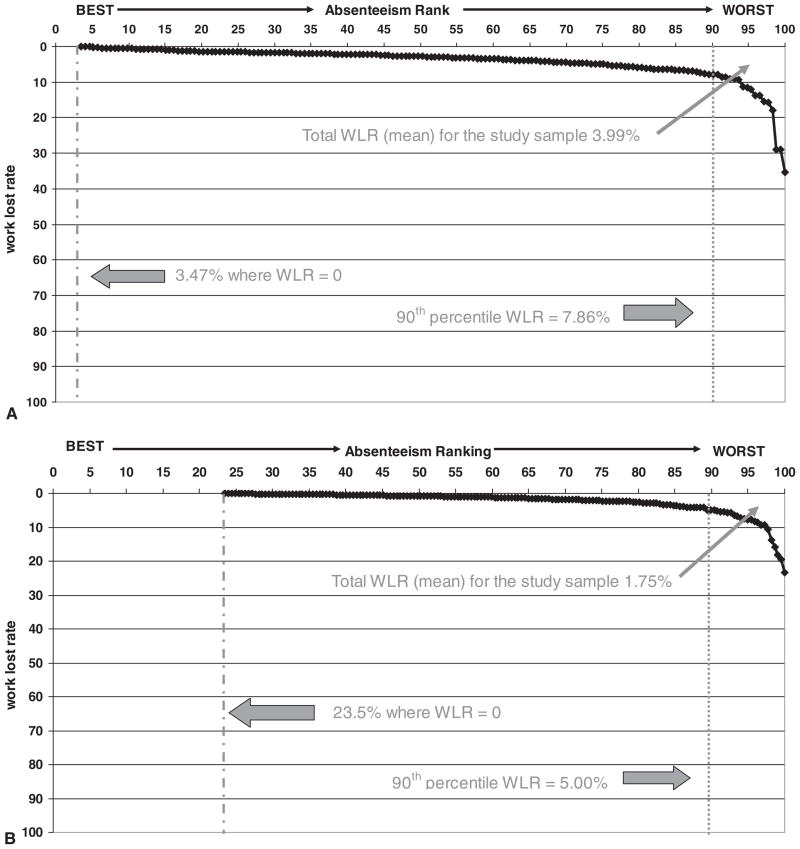
Figure 8 illustrates a singular application of this approach. Although the WLR by strata declines by age-strata from the youngest to oldest workers, the distribution of absence spell duration changes. Workers aged 60 and older, while having a relatively low WLR, have a higher percentage of unpaid hours explained by absences last 3 days or longer compared to the other age groups. This can be readily shown by adopting the approach proposed in Figure 3. In Figures 9A and B, we report the WLR distribution by groups. Workers less than 30 years old (N = 174) have a higher total WLR (3.99%), which is evenly distributed throughout, whereas workers greater than 60 years old (N = 217) have a lower total WLR (1.75%), mostly captured in a small number of workers with large losses.
Fig. 8.
Distribution of unpaid hours by duration of absence spell (partial, 1 and 2 day, and 3 days or longer) stratified by age. The WLR for each group is shown for each age strata (N = 4000).
Fig. 9.
A, WLR by absenteeism rank for workers less than 30 years old as of January 1, 2001 (N = 174). Note: 1) the percentage of the work force with no unpaid hours (WLR = 0) (3.47%) and 2) the range and distribution of the WLR. The total WLR (mean) for the sample is the area over the curve. B, Work lost rate (WLR) by cumulative percentage for workers 60 years or older as of January 1, 2001 (N = 217). Note: 1) the percentage of the work force with no unpaid hours (WLR = 0) (23.5%) and 2) the range and distribution of the WLR. The total WLR (mean) for the sample is the area over the curve.
Discussion
Given the complex construct of absenteeism, it is unlikely that a standard definition of an “absence day”, “sick-listed period”, “sick-day”, “long-term” and “short-term absence” will ever be adopted by absenteeism researchers. For this reason, we feel that the best chance for standardizing absenteeism (both for internal and external validity reasons) is to use a measure that relies on hours worked and hours not worked.
There are several clear advantages of the proposed WLR: 1) It can be calculated from data that is already being collected by many employers, 2) no additional rules, definitions, or modifications or both to existing data are needed to calculate the method, and 3) the existing rules at a company for what constitutes work hours, excused absences (eg, vacation hours) and unexcused absences (eg, unpaid, uncompensated, absent hours) are already taken into account. In addition, the WLR accounts for overtime hours, variable work schedules, and can be calculated at both the population and individual levels. We hope that this paper will serve as a reference to absenteeism researchers, as we have been able to demonstrate the relationships between the distribution of WLRs, absence days, and the distribution of absence spells by duration, a necessary step toward understanding the effect that different measures may have on results.28 This has also been shown by Ichino and Riphahn, who reported similarities between number of days absent in a calendar week and occurrence of an absence episode in a banking workforce.29
Walsh et al postulated almost 20 years ago that to study the relationship between absence and illness three separate sources of data would need to combined: Medical claims data, data from third party vendors who manage short and long term disability policies, and the employer’s measure of absenteeism.1 The WLR proposed in this article provides employers with a simple way to calculate an absenteeism rate using hourly payroll data that already exists for hourly employees at most companies and organizations. This method also allows for the comparison between different organizations by industry and country as no external assumptions (such as a 40 hours workweek, 240 working days per year, or “usual hours worked”) or explanations such as “sickness” are needed to calculate the WLR. In addition, the administrative rules that allow one worker to use a personal day (ie, vacation day) for an absence whereas not allowing another worker (based on job title, tenure, amount of paid vacation etc.) should be reflected in the payroll data.
The most striking observation from our research is the percentage of unpaid hours contained within absence spells of 1 and 2 days duration in this study population. This is of particular interest, as this type of information is not traditionally captured by methods using registry data, which require a certain period of time to elapse before a person is eligible for benefits. Using the WLR, we have been able to capture both the percentage of time contained within 1 and 2 days absences and the percentage of lost work hours contained within partial absence days. Given that 15.3% of the lost work time is captured by partial days, failure to include this measure in research may substantially underestimate the amount of lost work time. The distribution of unpaid hours as shown in Fig. 7 suggest that while previous definitions of long-term absence (≥7 days) seem reasonable, 1 and 2 day absences and >3 day absences are distributed very differently in this population as a whole and in the subpopulation by age, and should not be grouped together.
Like the US Department of Labor (and some economic researchers), we utilized payroll data in contrast to national registries or studies using self-reported absence days or spells.5,6,30–34 Although a full discussion of the limitations of national registry databases to study absenteeism is beyond the scope of this article, in brief, there are three main concerns: 1) The inability to capture short-term absences (defined as absence spells of 1 and 2 days duration), 2) the lack of hourly data (and thus the loss of partial absent days), and 3) the fact that each social insurance registry maintains a different set of administrative rules for a person to be counted as “absent” on a given day, making comparisons between such registries problematic. In comparison, the use of daily data derived from punch clock records has several advantages over registry data. The administrative rules present at an individual’s workplace are already reflected in the daily payroll data as to whether or not a worker is counted as absent for any given predetermined fraction of a hour on any given day. Furthermore, using hourly data avoids the above assumptions inherent in selecting a reference week or collecting self-reported data on whether a worker was absent last week, last month, or last year.
Absenteeism, defined by lost hours (usually per week), has been the subject of analysis by labor economics with access to individual paid hours.6,30 –36 Although the choice of numerator has remained consistent (either absent hours per week or summary absent hours over a defined time period), the choice of denominator has been less clear. A common method has been the selection of a “reference week” which is used to determine usual hours worked (also defined as contracted hours).5,6 However, this method relies on an arbitrary “snapshot” in time and potentially ignores overtime hours in the workforce. Although this may not affect a primarily service related industry (such as banking), failing to account for overtime hours and seasonal production cycles may have large implications for industries such as manufacturing. In addition, reference weeks may change by country of origin, as both the major religious and political holidays or country-wide vacations may change.
While we are unaware of any universal method for converting hourly data to absent days, we have shown that various measures can be affected simply by changing the rules on when to count a subject as being absent on a particular day. Several methods have been used in the literature, including the parsing of absent days into counting partial days (including half days) and percentages of days missed and then summarizing total days missed.12,37 As the data has shown, when using the strictest definition of a full absent day by payroll data (a day in which a worker was scheduled to work (with corresponding unpaid hours) with no paid work hours and no paid vacations hours for that calendar day), all measures of an absent day are highly correlated and therefore little additional information is gained from the varying definitions of an absent day, especially when hourly data are available.
Duration of absence spells has been reported to be an important variable in understanding the factors that influence an individual’s reasons for absence.10,13,18,19 Whitehall II researchers and others have shown that different factors affect the occurrence of short- and long-term spells.2,18 A consensus is emerging too that long-term absences are more related to sickness then short-term absences (without mention of incidence and frequency), as discussed by Chadwich-Jones as “voluntary” versus “involuntary” absences.2 As discussed previously, the choice of what defines an absent day plays into the calculated duration of an absence spell, as the decision to both start and end an absence spell depends on the definition of an absence day. In addition, there exist several competing definitions of short-term versus long-term absence: 1 to 2 days, 3 to 5 days, greater than 5 days, greater than or less than 7 days, greater than 14 days etc, all of which are arbitrary. The only general consensus in the field seems to be that a short-term absence is between one and two consecutive workdays.
Whitehall II researchers, using their definition of short-term absences (less than 7 days) and long-term absences (7 days or longer), have shown that variables impacting absence duration varies between men and women, infectious diseases and accidents, injuries, and musculoskeletal injuries.22 Short-term absences are believed to a function of “voluntary absence” and in such a case, a nonmedically certified absence.2 These variables are likely to be related to our measure of partial days as well as 1 and 2 day absences and will be explored in future papers.
There are three limitations with our approach to measuring absenteeism using payroll data. First, we have no measure of so-called presenteeism, an often used term to describe lost productivity due to being at work but at decreased productivity. Presenteeism assumes in its basic definition that an objective, standardized measure of productivity exists for an individual worker against which performance while at work can be measured. Although such information may be available in a separate database, such data is not routinely available and may, for many work settings, represent more a theoretical concept rather than measurable construct.
A second potential limitation of our measure of absenteeism is that it does not readily calculate the standard epidemiological measures of prevalence, frequency, and incidence of absence in the usual sense. The five proposed measures by Hensing (frequency of sick leave, length of absence, incidence rate, cumulative incidence, and duration of absence), while consistent with usual epidemiological measures, have similar numerators and different denominators while at the same time measuring both absence days and absence spells.22 As the majority of absenteeism is both of short duration and may happen several times per year or study interval, standard epidemiologic methods approaches used for other health outcomes (and in this case, developed for sickness absence registry data) do not, in our view, seem well suited to the study of the absenteeism.
A third limitation of our approach is that it is not trivially applicable to salaried workers (as opposed to “pay by the hour” workers). As reported by Walsh et al, the majority, if not all absenteeism research not connected to registry data has concentrated on the hourly workforce.1 This is because payroll data reflects employee attendance for hourly workers; however, no counterpart typically exists for paying salaries. To study salaried workers, researchers would have to either 1) use self-reported data (and all of the inherent difficulties with self-reported data) or 2) study salaried workers for whom an external detailed attendance schema exists, such as school teachers.38,39 The proposed system using hourly payroll data cannot be easily modified to account for salaried workers. In addition, analysis of absenteeism among hourly workers may not be generalizable to a salaried workforce even after adjusting for education, income, age, and other socioeconomic factors.
Other limitations on the use of daily payroll data include the inability to capture long-term absence if employees transfer out of the payroll records during an absence due to a worker’s compensation or a short-term or long-term disability policy for payments. In theory, this could be addressed by linking payroll records with the third party data sources (if available). Also, as with all administrative data sets, our approach precludes reference to the reasons an individual might give for why they chose to attend or not attend work. Some insight may be gained by linkage to other external data sources such as health or worker’s compensation insurance claims, however, there is no existing system for classifying “reasons”. This is both the strength (“agnostic”) and potential limitation to using hourly punch clock payroll data to study absenteeism. As we have stated, the administrative rules present at an individual’s workplace are already reflected in the daily payroll data as to whether or not a worker is counted as absent for any given predetermined fraction of a hour on any given day. As such, it requires no artificial manipulation to calculate a WLR by those interested in studying absenteeism.
In the end of the day, the greatest potential benefit of a standard absenteeism measure is the ability to study the characteristics for each individual by providing a WLR over a predefined time period and the range and distribution of the WLR for each population. Having defined an absenteeism metric for this population using daily payroll data (and the relationship between unpaid hours, full absent days, and absence duration), we can now link to medical, personnel, and disability claims (or other available) databases to explore the complex relationships between absenteeism, work, and health and the role that personal factors, health behaviors, job characteristics, and work organization play in explaining an individual’s absence behavior or an organization’s absenteeism experience.
Acknowledgments
This study was funded in part by grants from NICHD/NCMRR K12HD01097-06 Rehabilitation Medical Scientist Training Program, NIA 1R01AG026291-01A1 Disease, Disability, and Death in an Aging Workforce, the Occupational Physicians Scholarship Fund, and the Network on Socioeconomic Status and Health, John D. and Catherine T. MacArthur Foundation.
Footnotes
Competing Interests: Dr Cullen, Mr. Slade, Ms. Cantley, Ms. Vegso, and Ms. Fiellin provide consultant services to Alcoa Inc, under a research or service agreement With Yale University.
References
- 1.Walsh DC, Conner E, Tracey LV, Goldberg GA, Egdahl RH. Posthospital convalescence and return to work. Health Aff. 1989;8:76–90. doi: 10.1377/hlthaff.8.3.76. [DOI] [PubMed] [Google Scholar]
- 2.Chadwick-Jones J. Social Psychology of Absenteeism. New York: Praeger; 1982. [Google Scholar]
- 3.Goodman RS. Absenteeism. San Francisco: Jossey-Bass Inc; 1984. [Google Scholar]
- 4.Steers RM, Rhodes SR. Major influences on employee attendance: a process model. J Appl Psychol. 1978;63:391–407. [Google Scholar]
- 5.Bureau of Labor Statistics. USDOL. Current Population Survey. Bureau of Labor Statistics; 2007. [Google Scholar]
- 6.Barmby T, Ercolani M, Treble J. Sickness absence in Great Britain: new quarterly and annual series from the GHS and LFS, 1971–1997. Labour Mark Trends. 1999:405–415. [Google Scholar]
- 7.CCH. 2004 Unscheduled Absence Survey. CCH; 2004. [Google Scholar]
- 8.Tackling absenteeism in the workplace. Manage Serv. 2006;50:44–45. [Google Scholar]
- 9.Loeppke R, Hymel PA, Lofland JH, et al. Health-related workplace productivity measurement: general and migraine-specific recommendations from the ACOEM expert panel. J Occup Environ Med. 2003;45:349–359. doi: 10.1097/01.jom.0000063619.37065.e2. [DOI] [PubMed] [Google Scholar]
- 10.Niedhammer I, Bugel I, Goldberg M, Leclerc A, Guéguen A. Psychosocial factors at work and sickness absence in the Gazel cohort: a prospective study. Occup Environ Med. 1998;55:735–741. doi: 10.1136/oem.55.11.735. [DOI] [PMC free article] [PubMed] [Google Scholar]
- 11.Ichino A, Riphahn RT. Absenteeism and employment protection: three case studies. Swed Econ Pol Rev. 2004;11:95–114. [Google Scholar]
- 12.Schwartz B, Stewart WF, Lipton RB. Lost workdays and decreased work effectiveness associated with headache in the workplace. J Occup Environ Med. 1997;39:320–327. doi: 10.1097/00043764-199704000-00009. [DOI] [PubMed] [Google Scholar]
- 13.Isacsson A, Hanson BS, Janzon L, Kugelberg G. The epidemiology of sick leave in an urban population in Malmo, Sweden. Scand J Soc Med. 1992;20:234–239. doi: 10.1177/140349489202000408. [DOI] [PubMed] [Google Scholar]
- 14.Spenser D, Steers RM. The influence of personal factors and perceived work experiences on employee turnover and absenteeism. Acad Manage J. 1980;23:567–572. [Google Scholar]
- 15.Chaudhury M, Ng I. Absenteeism predictors—least-squares, rank regression, and model selection results. Can J Econ-Revue Canadienne D Economique. 1992;25:615–634. [Google Scholar]
- 16.Nielsen ML, Rugulies R, Smith-Hansen L, Christensen KB, Kristensen TS. Psychosocial work environment and registered absence from work: estimating the etiologic fraction. Am J Ind Med. 2006;49:187–196. doi: 10.1002/ajim.20252. [DOI] [PubMed] [Google Scholar]
- 17.Voss M, Floderus B, Diderichsen F. Physical, psychosocial, and organisational factors relative to sickness absence: a study based on Sweden post. Occup Environ Med. 2001;58:178–184. doi: 10.1136/oem.58.3.178. [DOI] [PMC free article] [PubMed] [Google Scholar]
- 18.North F, Syme SL, Feeney A, Head J, Shipley MJ, Marmot MG. Explaining socioeconomic differences in sickness absence: the Whitehall II Study. BMJ. 1993;306:361–366. doi: 10.1136/bmj.306.6874.361. [DOI] [PMC free article] [PubMed] [Google Scholar]
- 19.Morikawa Y, Martikainen P, Head J, Marmot M, Ishizaki M, Nakagawa H. A comparison of socio-economic differences in long-term sickness absence in a Japanese cohort and a British cohort of employed men. Eur J Public Health. 2004;14:413–416. doi: 10.1093/eurpub/14.4.413. [DOI] [PubMed] [Google Scholar]
- 20.Allen WD. Family Illness and temporary work absence. Appl Econ. 1996;28:1177–1180. [Google Scholar]
- 21.Ichino A, Maggi G. Work environment and individual background: explaining regional shirking differentials in a large Italian firm. Q J Econ. 2000;115:1057–1090. [Google Scholar]
- 22.Hensing G, Alexanderson K, Allebeck P, Bjurulf P. How to measure sickness absence? Literature review and suggestion of five basic measures. Scand J Soc Med. 1998;26:133–144. doi: 10.1177/14034948980260020201. [DOI] [PubMed] [Google Scholar]
- 23.Hensing G. Methodological aspects in sickness-absence research. Scand J Public Health. 2004;32:44–48. doi: 10.1080/14034950410021844. [DOI] [PubMed] [Google Scholar]
- 24.Alexanderson K, Norlund A. Aim, background, key concepts, regulations, and current statistics. Scand J Public Health. 2004;32:12–30. doi: 10.1080/14034950410021808. [DOI] [PubMed] [Google Scholar]
- 25.Henrekson Magnus PM. The effects of sick leave of changes in the sickness insurance system. J Labor Econ. 2004;22:87–113. [Google Scholar]
- 26.Wahlstrom R, Alexanderson K. Physician’s sick-listing practices. Scand J Public Health. 2004;32:222–255. doi: 10.1080/14034950410021916. [DOI] [PubMed] [Google Scholar]
- 27.Cullen MR, Vegso S, Cantley L, et al. Use of medical insurance claims data for occupational health research. J Occup Environ Med. 2006;48:1054–1061. doi: 10.1097/01.jom.0000241049.23093.a4. [DOI] [PubMed] [Google Scholar]
- 28.Hensing G. Methodological aspects in sickness-absence research. Scand J Public Health. 2004;32:44–50. doi: 10.1080/14034950410021844. [DOI] [PubMed] [Google Scholar]
- 29.Ichino A, Riphahn RT. The effect of employment protection on worker effort: absenteeism during and after probation. J Eur Econ Assoc. 2005;3:120–143. [Google Scholar]
- 30.Barmby T. Worker absenteeism: a discrete hazard model with bivariate heterogeneity. Labour Econ. 2002;9:469–476. [Google Scholar]
- 31.Barmby T, Sibly S. Analysing absence behaviour using event history models. Manage Decis Econ. 2004;25:141–145. [Google Scholar]
- 32.Barmby T, Nolan M, Winkelmann R. Contracted workdays and absence. Manch Sch. 2001;69:269–275. [Google Scholar]
- 33.Barmby T, Sessions J, Treble J. Absenteeism, efficiency wages and shirking. Scand J Econ. 1994;96:561–566. [Google Scholar]
- 34.Barmby T, Stephan G. Worker absenteeism: why firm size may matter. Manch Sch. 2000;68:568–577. [Google Scholar]
- 35.Barmby T, Treble J. A note on absenteeism. Br J Ind Relat. 1989;27:155–158. [Google Scholar]
- 36.Barmby TA, Ercolani MG, Treble JG. Sickness absence: an international comparison. Econ J. 2002;112:F315–F331. [Google Scholar]
- 37.Lofland JH, Frick KD. Effect of health insurance on workplace absenteeism in the U.S. workforce. J Occup Environ Med. 2006;48:13–21. doi: 10.1097/01.jom.0000194150.06359.ab. [DOI] [PubMed] [Google Scholar]
- 38.Lindeboom M, Kerkhofs M. Multistate models for clustered duration data—an application to workplace effects on individual sickness absenteeism. Rev Econ Stat. 2000;82:668–684. [Google Scholar]
- 39.Brulin C, Goine H, Edlund C, Knutsson A. Prevalence of long-term sick leave among female home care personnel in northern Sweden. J Occup Rehabil. 1998;8:103–111. [Google Scholar]


