

Abstract
Structural asymmetry of whole brain white matter (WM) pathways, i.e., the connectome, has been demonstrated using fiber tractography based on diffusion tensor imaging (DTI). However, DTI-based tractography fails to resolve axonal fiber bundles that intersect within an imaging voxel, and therefore may not fully characterize the extent of asymmetry. The goal of this study was to assess structural asymmetry with tractography based on diffusional kurtosis imaging (DKI), which improves upon DTI-based tractography by delineating intravoxel crossing fibers. DKI images were obtained from 42 healthy subjects. By using automatic segmentation, gray matter (GM) was parcellated into anatomically defined regions of interest (ROIs). WM pathways were reconstructed with both DKI- and DTI-based tractography. The connectivity between the ROIs was quantified with the streamlines connecting the ROIs. The asymmetry index (AI) was utilized to quantify hemispheric differences in the connectivity of cortical ROIs and of links interconnecting cortical ROIs. Our results demonstrated that leftward asymmetrical ROIs and links were observed in frontal, parietal, temporal lobes, and insula. Rightward asymmetrical ROI and links were observed in superior frontal lobe, cingulate cortex, fusiform, putamen, and medial temporal lobe. Interestingly, these observed structural asymmetries were incompletely identified with DTI-based tractography. These results suggest that DKI-based tractography can improve the identification of asymmetrical connectivity patterns, thereby serving as an additional tool in the evaluation of the structural bases of functional lateralization.
Keywords: Diffusional kurtosis imaging, diffusion tensor imaging, structural asymmetry, MRI, connectivity, connectome
1. Introduction
Even though both hemispheres of the human brain share similar topographic and surface anatomy, quantitative studies have demonstrated hemispheric asymmetries that are related to functional lateralization (Hugdahl, 2005; Toga and Thompson, 2003). For example, language and auditory processing region, which have been known for leftward functional lateralization, show a larger volume on the left hemisphere (Foundas et al., 1998; Geschwind and Levitsky, 1968; Steinmetz, 1996; Watkins et al., 2001). The close association between hemispheric asymmetry and functional lateralization suggests that structural asymmetry may constitute the structural basis for functional lateralization. Similarly, structural asymmetry is altered by pathological conditions that preferentially lead to isolated neurological deficits. Abnormal patterns of structural asymmetries have been observed in patients with dyslexia (Hynd et al., 1990; Larsen et al., 1990), schizophrenia (Crow et al., 1989; Petty, 1999), autism (Herbert et al., 2005; Hier et al., 1979), and Alzheimer’s disease (Derflinger et al., 2011; Geroldi et al., 2000).
Previous studies have conventionally assessed structural asymmetry using volumetric MRI measured on cortical and subcortical gray matter (GM) regions. Nonetheless, the regional volumetric measurement does not assess neural circuitry architecture. Because brain functions involve physiological processes that are supported by neural network architecture, the identification of connectivity asymmetries may provide a deeper understanding of the structural and functional properties of the human brain.
Recent advances in diffusion MRI (dMRI) acquisition and post-processing allow the quantitative mapping of whole brain neural connectivity, known as the brain connectome (Hagmann et al., 2006). The neural connectivity is established through white matter tracts interconnecting cortical and subcortical regions. The orientation of white matter tracts in each image voxel is determined based on the measured anisotropic diffusion. The white matter tracts are then connected across image voxels by assuming the orientational coherence along the tracts, called tractography. Our group previously demonstrated structural asymmetry of neural network architecture in older individuals (Bonilha et al., 2014) using the connectome reconstructed from tractography based on diffusion tensor imaging (DTI) (Le Bihan, 2003; Mori and van Zijl, 2002). DTI assumes a single fiber orientation in an image voxel. Nonetheless, an image voxel is at a macroscopic millimeter scale and likely contain white matter tracts on the order of micrometers with multiple orientations, i.e. crossing fibers. Some subcortical areas have been shown to be densely populated by crossing fibers, such as the corona radiata, optic radiation, and the medial and posterior temporal lobes (Behrens et al., 2007; Wedeen et al., 2008). Thus, DTI tractography is limited in these areas (Tuch, 2004; Wedeen et al., 2005), and the connectome derived from DTI tractography may not fully identify asymmetrical neural circuitry involving fiber crossing areas.
To address the problem, in this study, we employ the connectome reconstructed from diffusional kurtosis imaging (DKI) tractography (Jensen et al., 2005; Jensen et al., 2014) to study the structural asymmetry of the human brain. Compared to conventional DTI (with b = 1000 s/mm2), DKI employs multiple b-values (up to 2000 s/mm2) to quantify the non-Gaussianity of water diffusion, called kurtosis, which may provide additional information about tissue microstructure (Jensen et al., 2010). DKI has been shown to better represent crossing fibers than DTI (Jensen et al., 2014). We assess the hemispheric asymmetry in the microstructural connectivity and compare the assessments with DKI-based and conventional DTI-based tractography in the brain of healthy subjects.
2. Results
With DKI-based tractography, leftward ROI asymmetry was identified in the inferior, posterior, orbital frontal lobes, parietal lobes, temporal lobe, and insula. Rightward ROI asymmetry was identified in the superior frontal lobe, anterior cingulated cortex, fusiform, putamen, medial temporal lobe (Table 1 and Fig. 1).
Table 1.
Values of asymmetry index (AI) of significantly asymmetrical ROIs across all subjects (N = 42) – mean (standard deviation). The AI quantifies the hemispheric asymmetry in the ROI connectivity derived from DTI- and DKI-based tractography; positive AI indicates leftward asymmetry, and negative AI indicates rightward asymmetry. The significant asymmetry was determined by comparing the mean AI to zero with the one-sample t-test (two-tailed). The significance level was adjusted with the Bonferroni correction; p-value = 6.17 × 10⁻⁴.
| Region | AI
|
p-value (mean AI compared to zero)
|
|||
|---|---|---|---|---|---|
| DTI | DKI | DTI | DKI | ||
| Leftward | |||||
| parstriangularis | 0.42 (0.55) | 0.33 (0.40) | 1.47 × 10⁻⁵ | 4.40 × 10⁻⁶ | |
| parsopercularis | 0.53 (0.43) | 0.33 (0.34) | 9.36 × 10⁻¹⁰ | 2.29 × 10⁻⁷ | |
| precentral | 0.31 (0.31) | 0.24 (0.26) | 8.23 × 10⁻⁸ | 4.74 × 10⁻⁷ | |
| postcentral | 0.30 (0.34) | 0.25 (0.29) | 1.63 × 10⁻⁶ | 3.01 × 10⁻⁶ | |
| supramarginal | 0.33 (0.31) | 0.38 (0.31) | 2.53 × 10⁻⁸ | 6.68 × 10⁻¹⁰ | |
| inferiorparietal | 0.23 (0.35) | 0.29 (0.31) | 7.79 × 10⁻⁵ | 3.24 × 10⁻⁷ | |
| middletemporal | 0.40 (0.28) | 0.34 (0.22) | 1.30 × 10⁻¹¹ | 1.24 × 10⁻¹² | |
| superiortemporal | 0.28 (0.25) | 0.16 (0.24) | 4.82 × 10⁻⁹ | 8.44 × 10⁻⁵ | |
| transversetemporal | 0.69 (0.49) | 0.60 (0.55) | 2.56 × 10⁻¹¹ | 1.17 × 10⁻⁸ | |
| insula | 0.36 (0.29) | 0.26 (0.29) | 6.42 × 10⁻¹⁰ | 5.81 × 10⁻⁷ | |
| lateralorbitofrontal | 0.29 (0.32) | 7.05 × 10⁻⁷ | |||
| inferiortemporal | 0.18 (0.29) | 2.16 × 10⁻⁴ | |||
| Rightward | |||||
| superiorfrontal | −0.25 (0.21) | −0.24 (0.17) | 2.37 × 10⁻⁹ | 1.34 × 10⁻¹¹ | |
| rostralanteriorcingulate | −0.46 (0.61) | −0.28 (0.48) | 1.47 × 10⁻⁵ | 4.00 × 10⁻⁴ | |
| fusiform | −0.27 (0.40) | −0.31 (0.28) | 1.00 × 10⁻⁴ | 8.08 × 10⁻⁹ | |
| putamen | −0.19 (0.25) | −0.20 (0.28) | 1.34 × 10⁻⁵ | 3.47 × 10⁻⁵ | |
| parahippocampal | −0.37 (0.50) | 2.66 × 10⁻⁵ | |||
Figure 1.
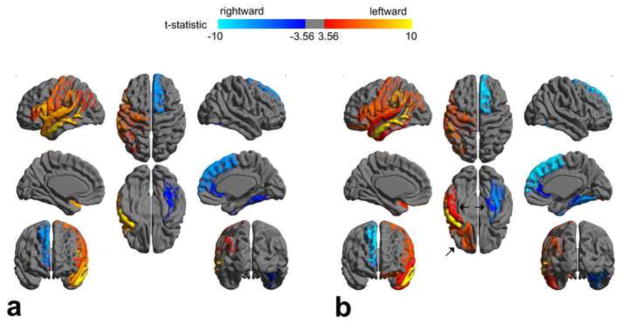
Significantly asymmetrical ROIs evaluated with DTI- (a) and DKI-based tractography (b). The arrows in (b) highlight the asymmetrical ROIs revealed only with DKI-based tractography. t statistic was derived from the one-sample t test (mean asymmetry index compared to zero). The threshold of t statistic: 3.56 was adjusted with the Bonferroni correction; p-value = 6.17 × 10⁻⁴.
Most asymmetrical ROIs were identified with both DTI- and DKI-based tractography. However, three asymmetrical ROIs were only identified with DKI-based tractography: lateral orbitofrontal (leftward), inferior temporal (leftward), and parahippocampal (rightward) regions.
With DKI-based tractography, the observed leftward asymmetrical links interconnect the leftward asymmetrical ROIs, including frontal, parietal, temporal lobes, and insula. Similarly, the observed rightward asymmetrical links interconnect the rightward asymmetrical ROIs, including superior frontal lobe, cingulate cortex, fusiform, putamen, and medial temporal lobe (Table 2 and Fig. 2).
Table 2.
Values of asymmetry index (AI) of significantly asymmetrical links across all subjects (N = 42) – mean (standard deviation). The link interconnects two cortical ROIs within the same hemisphere. The AI quantifies the hemispheric asymmetry in the link connectivity derived from DTI- and DKI-based tractography; positive AI indicates leftward asymmetry, and negative AI indicates rightward asymmetry. The significant asymmetry was determined by comparing the mean AI to zero with the one-sample t-test (two-tailed). The significance level was adjusted with the Bonferroni correction; p-value = 1.20 × 10⁻³.
| Link between | AI
|
p-value (mean AI compared to zero)
|
||||
|---|---|---|---|---|---|---|
| DTI | DKI | DTI | DKI | |||
| Leftward | ||||||
| postcentral | precentral | 0.43 (0.62) | 0.31 (0.43) | 5.66 × 10⁻⁵ | 2.62 × 10⁻⁵ | |
| supramarginal | postcentral | 0.43 (0.66) | 0.38 (0.56) | 1.45 × 10⁻⁴ | 6.69 × 10⁻⁵ | |
| inferiorparietal | superiorparietal | 0.54 (0.72) | 0.39 (0.58) | 1.80 × 10⁻⁵ | 7.60 × 10⁻⁵ | |
| middletemporal | inferiortemporal | 0.68 (0.72) | 0.61 (0.41) | 3.32 × 10⁻⁷ | 3.94 × 10⁻¹² | |
| superiortemporal | middletemporal | 0.29 (0.48) | 3.19 × 10⁻⁴ | |||
| insula | lateralorbitofrontal | 0.68 (0.62) | 1.11 × 10⁻⁸ | |||
| precentral | caudalmiddlefrontal | 0.43 (0.63) | 6.90 × 10⁻⁵ | |||
| superiortemporal | supramarginal | 0.71 (0.42) | 1.25 × 10⁻¹³ | |||
| lateraloccipital | inferiorparietal | 0.64 (0.66) | 1.80 × 10⁻⁷ | |||
| Rightward | ||||||
| caudalanteriorcingulate | superiorfrontal | −0.92 (0.54) | 9.03 × 10⁻¹⁴ | |||
| precuneus | isthmuscingulate | −0.30 (0.54) | 8.68 × 10⁻⁴ | |||
| parahippocampal | fusiform | −0.57 (0.55) | 5.70 × 10⁻⁸ | |||
| inferiortemporal | fusiform | −0.30 (0.51) | 5.33 × 10⁻⁴ | |||
| putamen | insula | −0.90 (0.56) | 4.33 × 10⁻¹³ | |||
Figure 2.

Significantly asymmetrical links evaluated with DTI- (a) and DKI-based tractography (b). The link interconnects two cortical ROIs within the same hemisphere. t statistic was derived from the one sample t test (mean asymmetry index compared to zero). The threshold of t statistic: 3.24 was adjusted with the Bonferroni correction; p-value = 1.20 × 10⁻³.
Interestingly, one leftward asymmetrical link was only shown by DTI-based tractography: superior temporal to middle temporal regions, whereas 4 leftward asymmetrical links that interconnect insula, frontal, temporal, and parietal regions, and all the rightward asymmetrical links were only shown by DKI-based tractography.
3. Discussion
In this study, we investigated hemispheric asymmetries of structural networks employing brain connectomes reconstructed from DKI- and DTI-based tractography. Our results demonstrated leftward asymmetry in language processing regions, including inferior frontal, superior temporal, and parietal gyrus, corroborating the well-known lateralized language function. The results are also consistent with previous findings with conventional DTI-based tractography (Catani et al., 2007; Glasser and Rilling, 2008; Powell et al., 2006). Furthermore, we observed that DKI-based tractography demonstrated several asymmetrical regions that were not identified with DTI-based tractography (Table 1 and 2). Notably, DKI analyses demonstrated asymmetrical ROIs and links in frontal, parietal, temporal lobes, insula, cingulated cortex, fusiform, and putamen. However, the asymmetrical links interconnecting frontal, temporal lobes, insula, cingulate cortex, and fusiform were not revealed by the conventional DTI-based tractography. These results suggest that DKI-based tractography may allow for a more complete characterization of asymmetrical neural networks.
We postulate that the different structural asymmetries revealed by DKI- and DTI-based tractography may be due to the better representation of crossing fibers with DKI-based tractography (Jensen et al., 2014). The assumption of single fiber orientation in DTI leads to a reduced number of tracts in areas of fiber crossing and might bias the calculations of structural asymmetries (Fig. 3). If the perceived number of fibers is reduced in only one hemisphere, an apparent yet false asymmetry may be detected. Conversely, if the reduction equalizes fibers from both hemispheres, an asymmetrical pattern is not detected. Our results showed that one asymmetrical link detected only with DTI-based tractography interconnects superior and middle temporal lobes and is known to be composed of crossing fibers (Behrens et al., 2007; Wedeen et al., 2008). However, more asymmetrical ROIs and links were detected only with DKI-based tractography and have been associated with crossing WM tracts, such as frontal, temporal lobes, insula, cingulate cortex, and fusiform (Behrens et al., 2007; Wedeen et al., 2008). Interestingly, these asymmetrical ROIs and links detected only with DKI-based tractography have been related to complex and lateralized brain functions, including emotion (orbitofrontal), visual processing (inferior temporal), and face and scene recognition (fusiform, parahippocampal). These results suggest that compared with DTI-based tractography, DKI-based tractography may better characterize the asymmetrical neural networks that are associated with lateralized brain functions.
Figure 3.

Hypothetical examples (a and b) of tractography, which assumes single fiber orientation, i.e. DTI tractography (left column), and tractography, which resolves crossing fibers, i.e. DKI tractography (right column). Tractography that assumes single fiber orientation failed to show the leftward asymmetry (a) and falsely showed the leftward asymmetry (b). Voxels 1 and 2 are regions with crossing fibers. Streamlines were seeded in voxel 1 and propagated through the voxels according to the FACT algorithm (Mori et al., 1999; Xue et al., 1999). Tractography that assumes single fiber orientation started with one streamline (in blue), whereas tractography that resolves crossing fibers started with two streamlines.
Our reported structural asymmetries with DKI-based tractography are consistent with previous results using volumetric and morphometric measurements. Our observed leftward asymmetrical ROIs and links are involved in language (parstriangularis, parsopercularis, superior temporal, supramarginal), motor (precentral), sensory (postcentral), memory (middle temporal, inferior temporal), and emotion (insula, inferior parietal) functions, and have been reported to be leftward volumetric asymmetry (Anderson et al., 1999; Chiarello et al., 2013; Foundas et al., 1998; Frederikse et al., 1999; Goldberg et al., 2013; Rademacher et al., 2001; Saenger et al., 2012). Our demonstrated rightward asymmetrical ROIs and links are involved in motor skills (putamen) and cognitive control (rostral anterior cingulate, and caudal anterior cingulate), and have been reported to be volumetric rightward asymmetry (Abedelahi et al., 2013; Huster et al., 2007). However, one previous postmortem study reported leftward volumetric asymmetry in fusiform and parahippocampal cortices (McDonald et al., 2000), whereas our results showed rightward asymmetry with DKI-based tractography (Table 1). This inconsistent asymmetry may arise from the different approaches used to assess the structural asymmetry. Volumetric measurements quantify macroscopic volumetric changes in cortices, whereas microstructural connectivity employed in our study quantifies WM pathways interconnecting cortices. Interestingly, fusiform and parahippocampal cortices, involved in face and scene recognition, have been presumed to be rightward asymmetry (Levine et al., 1988; Owen et al., 1996), which is consistent with our findings. This suggests that microstructural connectivity may serve as an additional structural basis for better understanding lateralized brain functions.
Another imaging method called diffusion spectrum imaging (DSI) (Wedeen et al., 2005) can represent multiple fiber orientations and generate a more complete neural network (Hagmann et al., 2007). It has been used to study the asymmetry of language processing WM pathways (Fernández-Miranda et al., 2014). Nonetheless, the data acquisition of DSI requires a long scan time and high gradient strength. Another advanced method called q-ball imaging (QBI) (Tuch, 2004) allows reconstructing WM pathways with less intensive scan time (Perrin et al., 2008; Sotiropoulos et al., 2010). In this study, we employed DKI-based connectome to demonstrate the asymmetrical neural network with a clinically feasible scan time (~7 mins), suggesting that DKI-based tractography may be useful to study disease processes that are associated with structural asymmetries.
In conclusion, we reconstructed whole-brain DKI-based tractography and demonstrated that the cortical ROIs and the links that are associated with lateralized brain functions were asymmetrical. These observed structural asymmetries were incompletely identified with conventional DTI-based tractography. These results suggest that asymmetrical neural network may be better assessed with DKI-derived tractography.
4. Experimental procedure
4.1 Participants
Forty-two right-handed healthy subjects (mean age ± standard deviation (SD) = 37.1 ± 11.7 years, 28 females) were included in this study. All subjects had no previous neurological or psychiatric disorders. All subjects signed an informed consent to participate this study, which was approved by the Institutional Review Board of the Medical University of South Carolina.
4.2 Image acquisition
Image acquisition was performed on a Verio 3 Tesla MRI scanner (Siemens Medical, Erlangen, Germany). All subjects underwent MRI scans with the same protocol, including diffusion-weighted images (DWIs) and T1 weighted images. DWIs were obtained using a twice-refocused, single-shot echo planar sequence with diffusion weightings b-value = 0, 1000, and 2000 s/mm2 applied along 30 non-collinear directions. Other imaging parameters were: repetition time (TR) = 8500 ms, echo time (TE) = 98 ms, field of view = 222 × 222 mm2, matrix size = 74 × 74, bandwidth = 1324 Hz/pixel, parallel imaging factor of 2, no partial Fourier encoding, number of excitations (NEX) = 10 for b = 0 s/mm2, and 1 for b = 1000, 2000 s/mm2, voxel size = 3 × 3 × 3 mm3, and 40 axial slices. T1 weighted images were obtained using a magnetization-prepared rapid gradient echo (MPRAGE) sequence with parameters: TR = 2250 ms, TE = 4.18 ms, flip angle = 6°, FOV = 256 × 256 mm2, matrix size = 256 × 256, NEX = 1, slice thickness: 1 mm and 192 sagittal slices.
4.3 Image processing
4.3.1 DKI processing and whole-brain tractography reconstruction
DKI processing was performed using in-house software package (http://nitrc.org/projects/dke) (Tabesh et al., 2011). The DWIs were first spatially aligned through a six-parameter rigid-body transformation and were fitted jointly with diffusion tensor (DT) and diffusional kurtosis tensor (DKT) for each voxel, generating whole brain maps of mean diffusivity, fractional anisotropy (FA), and mean kurtosis. The measured DT and DKT were used to compute the kurtosis diffusion orientation distribution function (dODF) with the radial weighting factor of 4 (Jensen et al., 2014). The local maxima of the kurtosis dODF represent multiple fiber orientations at each voxel and were determined with the quasi-Newton method (Jensen et al., 2014).
The measured voxelwise fiber orientations were used to reconstruct the whole brain DKI-based tractography. Streamlines of the tractography were seeded in WM regions, which were segmented from T1-weighted images using FreeSurfer [Martinos Center for Biomedical Imaging, Harvard-MIT, Boston USA] (Fischl et al., 2002) and transformed onto the space of DWIs through the linear registration using FSL FLIRT (Jenkinson et al., 2002). The streamlines propagated through WM regions according to the FACT algorithm (Mori et al., 1999; Xue et al., 1999), and were terminated when the changes in the direction were larger than 60° or values of FA were less than 0.2.
For comparison, whole brain DTI-based tractography was also reconstructed based on the Gaussian dODF (Jensen et al., 2014). The Gaussian dODF was derived from the measured DT assuming a single fiber orientation. Except for that, the algorithm and seed regions for DTI-based tractography were the same as those for DKI-based tractography.
4.3.2 Definitions of cortical ROIs and connectivity
For each subject, T1-weighted images were segmented into gray matter (GM) region. The GM region was parcellated into 82 cortical region-of-interests (ROIs) based on the lausanne2008 atlas in FreeSurfer [Martinos Center for Biomedical Imaging, Harvard-MIT, Boston USA] (Fischl et al., 2002). These defined ROIs on T1-weighed images were then transformed onto the space of DWIs through the linear registration using FSL FLIRT (Jenkinson et al., 2002). The connectivity between two cortical ROIs was defined as a link, and was assessed by the number of the streamlines ending within these two ROIs. The connectivity was then corrected accounting for the biases arising from the length of streamlines and volume sizes of the ROIs (Hagmann et al., 2007).
4.3.3 Assessments of ROI and link asymmetries
The ROI connectivity was defined as the sum of the links (defined above) connecting that ROI and all other ROIs. The ROI asymmetries were assessed by comparing the ROI connectivity in the left-hemisphere with the connectivity of the homologous ROI in the contralateral hemisphere. The comparison was done by the asymmetry index (AI): (left – right)/[0.5(left + right)] (Steinmetz, 1996).
The assessment of the link asymmetries focused on the intra-hemispheric links, i.e., the links connecting two ROIs within the same hemisphere. The inter-hemispheric links were excluded. The link in the left-hemisphere was compared with the homologous link in the right hemisphere by using the AI as described above.
4.3.4 Statistical analysis
The mean of the AI across all subjects was compared to zero using the one-sample t-test (two-tailed) to determine the significant asymmetry. The comparison was only performed on the ROIs and links showing non-zero connectivity across all subjects (N = 42), resulting in 81 comparisons in ROIs and 42 comparisons in links for the connectivity derived from DKI- and DTI-based tractography. We thereby adjusted the significance level of the one-sample t-test for multiple comparisons using the Bonferroni correction, yielding a corrected p-value of 6.17 × 10⁻⁴ for the ROI asymmetries and of 1.20 × 10⁻³ for the link asymmetries.
highlights.
Investigated structural asymmetry of whole brain white matter pathways
DKI-based tractography revealed asymmetrical cortical regions and links
These asymmetries were incompletely detected with DTI-based tractography
The differences may arise from resolving crossing fibers in DKI-based tractography
Asymmetrical neural networks may be better identified with DKI-based tractography
Acknowledgments
This work was supported in part by the South Carolina Clinical & Translational Research Institute through NIH grant numbers UL1 RR029882 and UL1 TR000062.
Footnotes
Disclosure of Conflicts of Interest
The authors report no financial or nonfinancial conflicts of interest associated with this study.
Publisher's Disclaimer: This is a PDF file of an unedited manuscript that has been accepted for publication. As a service to our customers we are providing this early version of the manuscript. The manuscript will undergo copyediting, typesetting, and review of the resulting proof before it is published in its final citable form. Please note that during the production process errors may be discovered which could affect the content, and all legal disclaimers that apply to the journal pertain.
References
- Abedelahi A, Hasanzadeh H, Hadizadeh H, Joghataie MT. Morphometric and volumetric study of caudate and putamen nuclei in normal individuals by MRI: Effect of normal aging, gender and hemispheric differences. Pol J Radiol. 2013;78:7–14. doi: 10.12659/PJR.889364. [DOI] [PMC free article] [PubMed] [Google Scholar]
- Anderson B, Southern BD, Powers RE. Anatomic asymmetries of the posterior superior temporal lobes: a postmortem study. Neuropsychiatry Neuropsychol Behav Neurol. 1999;12:247–254. [PubMed] [Google Scholar]
- Behrens TE, Berg HJ, Jbabdi S, Rushworth MF, Woolrich MW. Probabilistic diffusion tractography with multiple fibre orientations: what can we gain? Neuroimage. 2007;34:144–155. doi: 10.1016/j.neuroimage.2006.09.018. [DOI] [PMC free article] [PubMed] [Google Scholar]
- Bonilha L, Nesland T, Rorden C, Fridriksson J. Asymmetry of the structural brain connectome in healthy older adults. Front Psychiatry. 2014;4:186. doi: 10.3389/fpsyt.2013.00186. [DOI] [PMC free article] [PubMed] [Google Scholar]
- Catani M, Allin MP, Husain M, Pugliese L, Mesulam MM, Murray RM, Jones DK. Symmetries in human brain language pathways correlate with verbal recall. Proc Natl Acad Sci U S A. 2007;104:17163–17168. doi: 10.1073/pnas.0702116104. [DOI] [PMC free article] [PubMed] [Google Scholar]
- Chiarello C, Vazquez D, Felton A, Leonard CM. Structural asymmetry of anterior insula: behavioral correlates and individual differences. Brain Lang. 2013;126:109–122. doi: 10.1016/j.bandl.2013.03.005. [DOI] [PMC free article] [PubMed] [Google Scholar]
- Crow TJ, Ball J, Bloom SR, Brown R, Bruton CJ, Colter N, Frith CD, Johnstone EC, Owens DG, Roberts GW. Schizophrenia as an anomaly of development of cerebral asymmetry. A postmortem study and a proposal concerning the genetic basis of the disease. Arch Gen Psychiatry. 1989;46:1145–1150. doi: 10.1001/archpsyc.1989.01810120087013. [DOI] [PubMed] [Google Scholar]
- Derflinger S, Sorg C, Gaser C, Myers N, Arsic M, Kurz A, Zimmer C, Wohlschläger A, Mühlau M. Grey-matter atrophy in Alzheimer’s disease is asymmetric but not lateralized. J Alzheimers Dis. 2011;25:347–357. doi: 10.3233/JAD-2011-110041. [DOI] [PubMed] [Google Scholar]
- Fernández-Miranda JC, Wang Y, Pathak S, Stefaneau L, Verstynen T, Yeh FC. Asymmetry, connectivity, and segmentation of the arcuate fascicle in the human brain. [accessed 17 March 2014];Brain Struct Funct. 2014 doi: 10.1007/s00429-014-0751-7. [DOI] [PubMed] [Google Scholar]
- Fischl B, Salat D, Busa E, Albert M, Dieterich M, Haselgrove C, van der Kouwe A, Killiany R, Kennedy D, Klaveness S, Montillo A, Makris N, Rosen B, Dale A. Whole brain segmentation: automated labeling of neuroanatomical structures in the human brain. Neuron. 2002;33:341–355. doi: 10.1016/s0896-6273(02)00569-x. [DOI] [PubMed] [Google Scholar]
- Foundas AL, Eure KF, Luevano LF, Weinberger DR. MRI asymmetries of Broca’s area: the pars triangularis and pars opercularis. Brain Lang. 1998;64:282–296. doi: 10.1006/brln.1998.1974. [DOI] [PubMed] [Google Scholar]
- Frederikse ME, Lu A, Aylward E, Barta P, Pearlson G. Sex differences in the inferior parietal lobule. Cereb Cortex. 1999;9:896–901. doi: 10.1093/cercor/9.8.896. [DOI] [PubMed] [Google Scholar]
- Glasser MF, Rilling JK. DTI tractography of the human brain’s language pathways. Cerebral cortex. 2008;18:2471–2482. doi: 10.1093/cercor/bhn011. [DOI] [PubMed] [Google Scholar]
- Geroldi C, Akkawi NM, Galluzzi S, Ubezio M, Binetti G, Zanetti O, Trabucchi M, Frisoni GB. Temporal lobe asymmetry in patients with Alzheimer’s disease with delusions. J Neurol Neurosurg Psychiatry. 2000;69:187–191. doi: 10.1136/jnnp.69.2.187. [DOI] [PMC free article] [PubMed] [Google Scholar]
- Geschwind N, Levitsky W. Human brain: left-right asymmetries in temporal speech region. Science. 1968;161:186–187. doi: 10.1126/science.161.3837.186. [DOI] [PubMed] [Google Scholar]
- Goldberg E, Roediger D, Kucukboyaci NE, Carlson C, Devinsky O, Kuzniecky R, Halgren E, Thesen T. Hemispheric asymmetries of cortical volume in the human brain. Cortex. 2013;49:200–210. doi: 10.1016/j.cortex.2011.11.002. [DOI] [PubMed] [Google Scholar]
- Hagmann P, Jonasson L, Maeder P, Thiran JP, Wedeen VJ, Meuli R. Understanding diffusion MR imaging techniques: from scalar diffusion-weighted imaging to diffusion tensor imaging and beyond. Radiographics. 2006;26(Suppl 1):S205–S223. doi: 10.1148/rg.26si065510. [DOI] [PubMed] [Google Scholar]
- Hagmann P, Kurant M, Gigandet X, Thiran P, Wedeen VJ, Meuli R, Thiran JP. Mapping Human Whole-Brain Structural Networks with Diffusion MRI. PLoS ONE. 2007;2:e597. doi: 10.1371/journal.pone.0000597. [DOI] [PMC free article] [PubMed] [Google Scholar]
- Hugdahl K. Symmetry and asymmetry in the human brain. European Review. 2005;13(S2):119–133. [Google Scholar]
- Herbert MR, Ziegler DA, Deutsch CK, O’Brien LM, Kennedy DN, Filipek PA, Bakardjiev AI, Hodgson J, Takeoka M, Makris N, Caviness VS. Brain asymmetries in autism and developmental language disorder: a nested whole-brain analysis. Brain. 2005;128:213–226. doi: 10.1093/brain/awh330. [DOI] [PubMed] [Google Scholar]
- Hier DB, LeMay M, Rosenberger PB. Autism and unfavorable left-right asymmetries of the brain. J Autism Dev Disord. 1979;9:153–159. doi: 10.1007/BF01531531. [DOI] [PubMed] [Google Scholar]
- Hynd GW, Semrud-Clikeman M, Lorys AR, Novey ES, Eliopulos D. Brain morphology in developmental dyslexia and attention deficit disorder/hyperactivity. Arch Neurol. 1990;47:919–926. doi: 10.1001/archneur.1990.00530080107018. [DOI] [PubMed] [Google Scholar]
- Jenkinson M, Bannister P, Brady M, Smith S. Improved optimization for the robust and accurate linear registration and motion correction of brain images. NeuroImage. 2002;17:825–841. doi: 10.1016/s1053-8119(02)91132-8. [DOI] [PubMed] [Google Scholar]
- Jensen JH, Helpern JA, Ramani A, Lu H, Kaczynski K. Diffusional kurtosis imaging: the quantification of non-gaussian water diffusion by means of magnetic resonance imaging. Magn Reson Med. 2005;53:1432–1440. doi: 10.1002/mrm.20508. [DOI] [PubMed] [Google Scholar]
- Jensen JH, Helpern JA. MRI quantification of non-Gaussian water diffusion by kurtosis analysis. NMR Biomed. 2010;23:698–710. doi: 10.1002/nbm.1518. [DOI] [PMC free article] [PubMed] [Google Scholar]
- Jensen JH, Helpern JA, Tabesh A. Leading non-Gaussian corrections for diffusion orientation distribution function. NMR Biomed. 2014;27:202–211. doi: 10.1002/nbm.3053. [DOI] [PMC free article] [PubMed] [Google Scholar]
- Larsen JP, Høien T, Lundberg I, Odegaard H. MRI evaluation of the size and symmetry of the planum temporale in adolescents with developmental dyslexia. Brain Lang. 1990;39:289–301. doi: 10.1016/0093-934x(90)90015-9. [DOI] [PubMed] [Google Scholar]
- Le Bihan D. Looking into the functional architecture of the brain with diffusion MRI. Nat Rev Neurosci. 2003;4:469–480. doi: 10.1038/nrn1119. [DOI] [PubMed] [Google Scholar]
- Levine SC, Banich MT, Koch-Weser MP. Face recognition: a general or specific right hemisphere capacity? Brain Cogn. 1988;8:303–325. doi: 10.1016/0278-2626(88)90057-7. [DOI] [PubMed] [Google Scholar]
- McDonald B, Highley JR, Walker MA, Herron BM, Cooper SJ, Esiri MM, Crow TJ. Anomalous asymmetry of fusiform and parahippocampal gyrus gray matter in schizophrenia: A postmortem study. Am J Psychiatry. 2000;157:40–47. doi: 10.1176/ajp.157.1.40. [DOI] [PubMed] [Google Scholar]
- Mori S, Crain BJ, Chacko VP, van Zijl PC. Three-dimensional tracking of axonal projections in the brain by magnetic resonance imaging. Ann Neurol. 1999;45:265–269. doi: 10.1002/1531-8249(199902)45:2<265::aid-ana21>3.0.co;2-3. [DOI] [PubMed] [Google Scholar]
- Mori S, van Zijl PC. Fiber tracking: principles and strategies - a technical review. NMR Biomed. 2002;15:468–480. doi: 10.1002/nbm.781. [DOI] [PubMed] [Google Scholar]
- Owen AM, Milner B, Petrides M, Evans AC. A specific role for the right parahippocampal gyrus in the retrieval of object-location: a positron emission tomography study. J Cogn Neurosci. 1996;8:588–602. doi: 10.1162/jocn.1996.8.6.588. [DOI] [PubMed] [Google Scholar]
- Perrin M, Cointepas Y, Cachia A, Poupon C, Thirion B, Rivière D, Cathier P, El Kouby V, Constantinesco A, Le Bihan D, Mangin JF. Connectivity-based parcellation of the cortical mantle using q-ball diffusion imaging. Int J Biomed Imaging. 2008;2008 doi: 10.1155/2008/368406. [DOI] [PMC free article] [PubMed] [Google Scholar]
- Petty RG. Structural asymmetries of the human brain and their disturbance in schizophrenia. Schizophr Bull. 1999;25:121–139. doi: 10.1093/oxfordjournals.schbul.a033360. [DOI] [PubMed] [Google Scholar]
- Powell R, Parker G, Alexander D, Symms M, Boulby P, Wheeler-Kingshott C, Barker G, Noppeney U, Koepp M, Duncan J. Hemispheric asymmetries in language-related pathways: a combined functional MRI and tractography study. NeuroImage. 2006;32:388–399. doi: 10.1016/j.neuroimage.2006.03.011. [DOI] [PubMed] [Google Scholar]
- Rademacher J, Bürgel U, Geyer S, Schormann T, Schleicher A, Freund HJ, Zilles K. Variability and asymmetry in the human precentral motor system. A cytoarchitectonic and myeloarchitectonic brain mapping study. Brain. 2001;124:2232–2258. doi: 10.1093/brain/124.11.2232. [DOI] [PubMed] [Google Scholar]
- Huster RJ, Westerhausen R, Kreuder F, Schweiger E, Wittling W. Morphologic asymmetry of the human anterior cingulate cortex. Neuroimage. 2007;34:888–895. doi: 10.1016/j.neuroimage.2006.10.023. [DOI] [PubMed] [Google Scholar]
- Saenger V, Barrios F, Martínez-Gudiño ML, Alcauter S. Hemispheric asymmetries of functional connectivity and grey matter volume in the default mode network. Neuropsychologia. 2012;50:1308–1315. doi: 10.1016/j.neuropsychologia.2012.02.014. [DOI] [PubMed] [Google Scholar]
- Sotiropoulos S, Bai L, Morgan P, Constantinescu C, Tench C. Brain tractography using Q-ball imaging and graph theory: Improved connectivities through fibre crossings via a model-based approach. Neuroimage. 2010;49:2444–2456. doi: 10.1016/j.neuroimage.2009.10.001. [DOI] [PubMed] [Google Scholar]
- Steinmetz H. Structure, functional and cerebral asymmetry: in vivo morphometry of the planum temporale. Neurosci Biobehav Rev. 1996;20:587–591. doi: 10.1016/0149-7634(95)00071-2. [DOI] [PubMed] [Google Scholar]
- Tabesh A, Jensen JH, Ardekani BA, Helpern JA. Estimation of tensors and tensor-derived measures in diffusional kurtosis imaging. Magn Reson Med. 2011;65:823–836. doi: 10.1002/mrm.22655. [DOI] [PMC free article] [PubMed] [Google Scholar]
- Toga AW, Thompson PM. Mapping brain asymmetry. Nat Rev Neurosci. 2003;4:37–48. doi: 10.1038/nrn1009. [DOI] [PubMed] [Google Scholar]
- Tuch D. Q-ball imaging. Magn Reson Med. 2004;52:1358–1372. doi: 10.1002/mrm.20279. [DOI] [PubMed] [Google Scholar]
- Watkins KE, Paus T, Lerch JP, Zijdenbos A, Collins DL, Neelin P, Taylor J, Worsley KJ, Evans AC. Structural asymmetries in the human brain: a voxel-based statistical analysis of 142 MRI scans. Cereb Cortex. 2001;11:868–877. doi: 10.1093/cercor/11.9.868. [DOI] [PubMed] [Google Scholar]
- Wedeen VJ, Hagmann P, Tseng WY, Reese TG, Weisskoff RM. Mapping complex tissue architecture with diffusion spectrum magnetic resonance imaging. Magn Reson Med. 2005;54:1377–1386. doi: 10.1002/mrm.20642. [DOI] [PubMed] [Google Scholar]
- Wedeen VJ, Wang RP, Schmahmann JD, Benner T, Tseng WY, Dai G, Pandya DN, Hagmann P, D’Arceuil H, de Crespigny AJ. Diffusion spectrum magnetic resonance imaging (DSI) tractography of crossing fibers. Neuroimage. 2008;41:1267–1277. doi: 10.1016/j.neuroimage.2008.03.036. [DOI] [PubMed] [Google Scholar]
- Xue R, van Zijl PC, Crain BJ, Solaiyappan M, Mori S. In vivo three-dimensional reconstruction of rat brain axonal projections by diffusion tensor imaging. Magn Reson Med. 1999;42:1123–1127. doi: 10.1002/(sici)1522-2594(199912)42:6<1123::aid-mrm17>3.0.co;2-h. [DOI] [PubMed] [Google Scholar]