

Abstract
MicroRNAs are naturally occurring small RNA species that regulate gene expression and are frequently abnormally expressed in cancers. However, the role of microRNAs in lymphoma is poorly understood. Therefore, we undertook a comprehensive study of microRNA expression in two of the most common lymphomas: diffuse large B-cell lymphoma (DLBCL) (n= 80) and follicular lymphoma (FCL) (n= 18) using microarrays containing probes for 464 human microRNAs. Unsupervised cluster analysis revealed distinct expression patterns between these two lymphomas and specific microRNA signatures (including members of the miR-17–92 cluster) were derived that correctly predicted lymphoma type in >95% of cases. Furthermore, we identified microRNAs in de novo DLBCL (n= 64) associated with germinal centre-like and non-germinal centre-like immunophenotypes, international prognostic index status and event-free survival in CHOP and rituximab (R)-CHOP treated patients. Despite the indolent nature of FCL a significant proportion of cases undergo high-grade transformation to more aggressive DLBCL. In order to see if transformation is associated with changes in microRNA expression we compared transformed DLBCL cases (n= 16) with de novo DLBCL, as well as FCL cases that underwent subsequent transformation (n= 7) with FCL cases that had not transformed at a median follow-up of 60 months (n= 11). Differential expression of 12 microRNAs correctly predicted >85% of transformed versus de novo DLBCL cases; six microRNAs (miR-223, 217, 222, 221 and let-7i and 7b) were found which could similarly predict or transformation in FCL (P< 0.05). These data suggest that microRNAs have potential as diagnostic and prognostic markers in these lymphomas and may be used to identify FCL patients at risk of high-grade transformation.
Keywords: microRNA, lymphoma, diffuse large B-cell lymphoma, follicular lymphoma, transformation, survival, prognosis, immunophenotype
Introduction
MicroRNAs are a recently discovered class of naturally occurring short non-coding RNA molecules that regulate eukaryotic gene expression through binding to complementary sequences in the 3′UTR of target mRNA. There are currently over 600 annotated human microRNAs in the miRBase database (http://microrna.sanger.ac.uk/sequences/) although the true total number of microRNAs is predicted to be closer to 1000 [1, 2]. It is currently believed that between 10–30% of all human genes are a target for microRNA regulation [3]. MicroRNAs play key regulatory roles in a diverse range of pathways including control of haematopoiesis, developmental timing, cell differentiation, apoptosis, cell proliferation and organ development [4]. The potential importance of microRNAs in cancer is suggested by the finding that the majority of human microRNAs are located at cancer-associated genomic regions [5], and there is rapidly accumulating evidence to signify that dysfunctional expression of microRNAs is a common feature of malignancy [6, 7]. MicroRNAs have been demonstrated to have diagnostic and prognostic potential in cancer [8–11] and it has been suggested that microRNA expression profiling can distinguish cancers according to both the cellular nature and the developmental stage of the tumour with a greater degree of accuracy than traditional gene expression analysis [12].
Diffuse large B-cell lymphoma (DLBCL) is the most common form of adult lymphoma accounting for nearly 40% of all lym-phoid tumours [13]. Despite improvements in treatment regimes, the majority of patients succumb to this aggressive disease. DLBCL is characterized by marked clinical and pathological heterogeneity that is reflected at the molecular level. Gene expression and immunohistochemical studies have revealed the presence of at least two distinct molecular subtypes of DLBCL: those that are germinal centre B-cell-like (GCB) and those that are non-germinal centre-like (NGC) [14, 15]. Using a prototypic cell line model, we previously identified microRNAs associated with these two DLBCL subtypes [10]. However, the limitations of cell lines to model cancer are well known; therefore, we undertook a comprehensive study to elucidate the microRNA profile of clinical cases of DLBCL and identified microRNAs associated with clinical parameters including survival.
As well as presenting de novo, DLBCL can also present as a high-grade histological transformation from a previously diagnosed indolent lymphoma, most commonly follicular lymphoma (FCL). Therefore, to investigate this phenomenon we also examined DLBCL cases that had transformed from FCL, as well as archived FCL samples with and without a history of subsequent transformation.
Materials and methods
Patient samples
Details of the haematological cell lines (n= 40) and lymphocyte subsets (n= 12) used in unsupervised cluster analysis have been previously described [16]. The lymphocyte samples consisted of pre-B cells (CD19+/CD10+), resting B cells (CD19+), naïve B cells (CD19+), germinal centre B cells (CD19+/IgD−/CD39−), B cells activated in vitro by IL-2 and IgM stimulation (CD19+/CD30+), plasma cells (CD138+), memory B cells (CD19+/CD27+), CD3+ T cells, CD4+ T cells, CD8+ T cells and natural killer cells (CD56+).
Formalin-fixed paraffin-embedded (FFPE) biopsy samples of 98 patients were obtained from the Pathology Department of the John Radcliffe Hospital, Oxford, UK. Eighty patients were diagnosed histologically and clinically as having DLBCL; 64 de novo (DLBCL de novo) and 16 transformed cases with previously diagnosed FCL (DLBCL-t). A summary of DLBCL de novo patient details and treatment regimes is given in Table S1. Of the 18 cases of FCL used in this study, 7 subsequently underwent high-grade transformation (FCL-t) with a median time to transformation of 24 months (range 10–96 months) from initial diagnosis. The remaining 11 FCL cases (FCL-nt) had no recorded transformation events (median follow-up time 60 months; range 52–132 months). The FCL-t and DLBCL-t samples were not paired. All FCL cases were grade 1 or 2 at time of original diagnosis. All samples were collected at time of initial diagnosis (i.e. prior to treatment) with the exception of DLBCL-t cases. Samples had >80% of tumour cells as determined by haematoxylin and eosin staining (not shown). Relevant ethical permission was obtained for the use of all samples.
DLBCL de novo cases were classified immunohistochemically as GC- or NGC-type using monoclonal antibodies against CD10, BCL6 and melanoma associated antigen (mutated) 1 (MUM1) as previously described [15].
RNA purification and microarray analysis
Total RNA was purified from 4 × 20 μm FFPE sections using the Recoverall kit from Ambion (Huntington, UK) in accordance with the manufacturers’ instructions. RNA (3 μg) were labelled and hybridized to μRNA microarrays as previously described [16] using tonsillar material (pooled from 12 healthy individuals) as a common reference in a dye-balanced design.
Image analysis was carried out with BlueFuse software (BlueGnome, Cambridge, UK). Raw image data were global median-normalized within arrays and normalized between arrays using the limma package [17]. The normalized log ratios (average of four replicates per probe) were used for subsequent analysis in Genespring 7.2 (Agilent Technologies, CA, USA). anova analysis was used to identify microRNAs differentially expressed between sample types and P-values were adjusted using the Benjamini-Hodgberg correction method. Differentially expressed genes were tested for their ability to predict sample class using the leave-one-out cross-validation support vector machine (SVM) function in Genespring.
Survival analysis
Kaplan-Meier survival analysis was carried out on event-free survival (EFS) times of de novo DLBCL cases as a function of microRNA expression, using the median value as cutoff. EFS was calculated as the time of diagnosis to the date of clinical relapse, death or last contact. Patients who were relapse free at time of last contact were censored for analysis. Mean follow-up time was 22.5 months (range 1–60 months). Curves were compared by univariate (log-rank) analysis using GraphPad Prism version 4.00 (La Jolla, CA, USA).
Results
MicroRNA expression distinguishes normal lymphocyte subsets (and cell lines) from clinical lymphoma samples
Using unsupervised cluster analysis of the human probe set (n= 464) we found that the cell lines (n= 40), normal lymphocyte subsets (n= 12) and tumour samples (n= 98) have distinct microRNA profiles (Fig. 1A). Moreover, FCL and DLBCL clinical samples also generally clustered distinctly.
Figure 1.
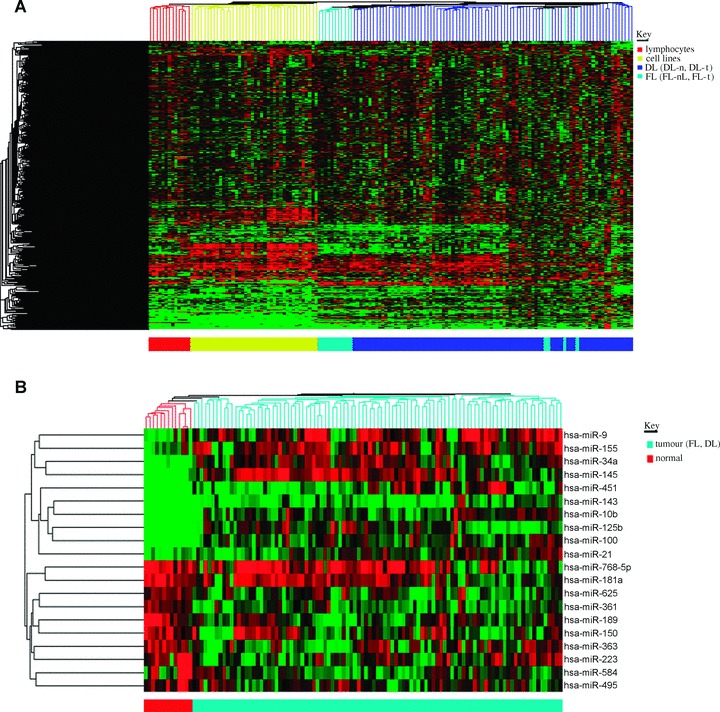
(A) Unsupervised cluster analysis of purified lymphocyte subsets (n= 12), haematological cell lines (n= 40) and clinical cases of FCL and DLBCL (n= 98). Cluster analysis was carried out on human probe set (n= 464). (B) Cluster analysis of top 10 up- and down-regulated microRNAs differentially expressed between normal lymphocyte subsets and tumour samples (DLBCL and FCL).
In order to identify lymphoma-associated microRNAs we compared expression levels in tumour samples (DLBCL and FCL) with those of normal B and T lymphocyte subsets. Forty and twenty microRNAs were found to be up- and down-regulated, respectively (P< 0.05) (data not shown). We took the 10 most discriminatory up- and down-regulated microRNAs (Table 1) and used them in cluster analysis. These 20 microRNAs produced distinct clustering of tumour samples as compared with normal samples. (Fig. 1B) and correctly predicted the malignant nature of 111/112 (99%) samples in leave-one-out cross-validation SVM analysis.
Table 1.
Top 10 up- and down-regulated microRNAs differentially expressed (P < 0.01) between tumour (n= 98) and normal lymphocyte populations (n= 12). Negative fold changes are down-regulated in tumour samples and positive values are up-regulated compared to lymphocyte subsets
| microRNA | P-value | Fold change |
|---|---|---|
| hsa-miR-125b | 2.07E-09 | 28.67 |
| hsa-miR-143 | 5.44E-06 | 14.22 |
| hsa-miR-451 | 3.65E-09 | 13.35 |
| hsa-miR-145 | 1.03E-07 | 11.36 |
| hsa-miR-10b | 5.73E-10 | 10.04 |
| hsa-miR-34a | 1.06E-09 | 8.62 |
| hsa-miR-100 | 1.63E-09 | 7.22 |
| hsa-miR-9 | 3.23E-04 | 4.01 |
| hsa-miR-155 | 3.11E-04 | 3.29 |
| hsa-miR-21 | 4.67E-04 | 2.11 |
| hsa-miR-189 | 5.22E-04 | −4.32 |
| hsa-miR-150 | 5.22E-04 | −3.58 |
| hsa-miR-363 | 1.14E-04 | −3.56 |
| hsa-miR-223 | 2.04E-02 | −3.55 |
| hsa-miR-584 | 3.25E-02 | −3.44 |
| hsa-miR-361 | 4.44E-08 | −3.39 |
| hsa-miR-768–5p | 9.22E-03 | −3.26 |
| hsa-miR-625 | 4.44E-08 | −3.24 |
| hsa-miR-495 | 8.39E-03 | −3.20 |
| hsa-miR-181a | 1.06E-03 | −2.88 |
MicroRNA expression is distinct between DLBCL and FCL
In order to investigate differences in microRNA expression between FCL and DLBCL samples, and because de novo and transformed DLBCL are indistinguishable histologically, we initially compared expression in all DLBCL cases (n= 80) with that of all FCL cases (n= 18). Thirty microRNAs were found to be differentially expressed (P< 0.05) (Table S2). Expression values of these microRNAs correctly predicted 95/97 (98%) of cases as DLBCL or FCL, and clustered the cases distinctly (Fig. 2A).
Figure 2.
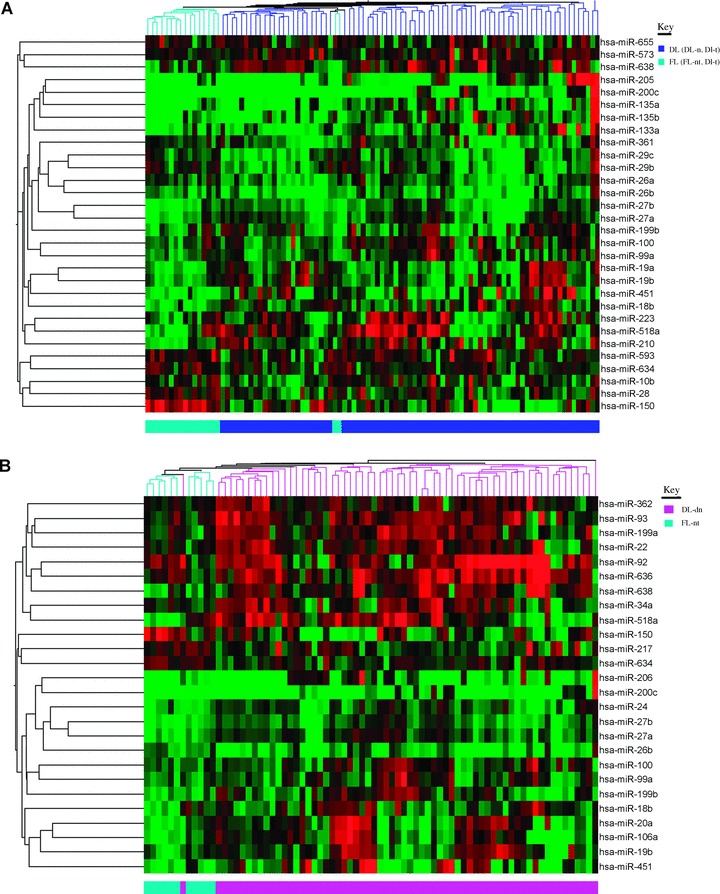
Cluster analysis of microRNAs differentially expressed between FCL and DLBCL. (A) All DLBCL cases (n= 80) and FCL cases (n= 18). (B) Only de novo cases (DLBCL de novo[n= 64]) and cases of FCL that did not undergo transformation (FCL-nt [n= 11]).
A study by Roehle et al. identified 10 microRNAs that were differentially expressed between FCL and DLBCL cases [18]. Only two of these microRNAs (miR-150 and miR-135a) were found to be differentially expressed (P< 0.05) in our patient cohort, although another two microRNAs, miR-92 and miR-125b, had P-values of < 0.1. These 10 microRNAs correctly predicted 74/97 (76%) of cases according to diagnosis.
Roehle’s study, however, compared de novo cases of DLBCL with FCL cases that did not undergo subsequent transformation. Therefore, in order to compare the data directly we used the same sample types (64 DLBCL de novo and 11 FCL-nt cases) to re-analyse the data. This resulted in 26 differentially expressed (P < 0.05) microRNAs (Table 2), 14 of which were also present in the previous list (Table S2). These microRNAs correctly predicted 73/75 (97%) of cases in this cohort (c.f. 60/75 (80%) with the 10 microRNA signature [18]) and 92/97 (95%) of cases in the extended cohort. Again, the two sets of samples were found to cluster distinctly using the 26-microRNA signature (Fig. 2B).
Table 2.
MicroRNAs differentially expressed (P< 0.05) between de novo DLBCL and non-transforming FCL cases. Members of the miR-17–92 cluster (and homologous clusters) are depicted in bold type
| microRNA | P-value | Up | Fold change |
|---|---|---|---|
| hsa-miR-200c | 4.58E-06 | DLBCL | 10.03 |
| hsa-miR-638 | 5.30E-04 | DLBCL | 3.31 |
| hsa-miR-518a | 3.85E-02 | DLBCL | 2.88 |
| hsa-miR-199a | 1.57E-02 | DLBCL | 2.67 |
| hsa-miR-93 | 3.74E-02 | DLBCL | 2.64 |
| hsa-miR-22 | 1.94E-02 | DLBCL | 2.46 |
| hsa-miR-34a | 3.92E-02 | DLBCL | 2.39 |
| hsa-miR-362 | 4.68E-02 | DLBCL | 2.30 |
| hsa-miR-206 | 3.93E-02 | DLBCL | 1.73 |
| hsa-miR-451 | 3.23E-03 | DLBCL | 1.49 |
| hsa-miR-636 | 8.55E-03 | DLBCL | 1.17 |
| hsa-miR-92 | 4.05E-02 | DLBCL | 1.08 |
| hsa-miR-27b | 6.85E-04 | DLBCL | 1.04 |
| hsa-miR-199b | 1.15E-04 | DLBCL | 1.03 |
| hsa-miR-27a | 4.03E-04 | DLBCL | 0.97 |
| hsa-miR-24 | 2.04E-02 | DLBCL | 0.75 |
| hsa-miR-106a | 1.16E-02 | DLBCL | 0.73 |
| hsa-miR-20a | 2.62E-02 | DLBCL | 0.67 |
| hsa-miR-19b | 4.95E-03 | DLBCL | 0.64 |
| hsa-miR-99a | 9.55E-03 | DLBCL | 0.56 |
| hsa-miR-18b | 3.27E-02 | DLBCL | 0.54 |
| hsa-miR-100 | 1.95E-02 | DLBCL | 0.43 |
| hsa-miR-26b | 1.88E-02 | FCL | 1.42 |
| hsa-miR-217 | 2.84E-02 | FCL | 2.44 |
| hsa-miR-634 | 9.50E-04 | FCL | 2.54 |
| hsa-miR-150 | 4.55E-02 | FCL | 3.46 |
MicroRNA expression varies between GC and NGC immunophenotypes of DLBCL
The DLBCL de novo cases were immunophenotyped as either GC-or NGC-like according to the algorithm of Hans et al. using CD10, BCL6 and MUM1 antibody staining [15]. Four cases were removed from subsequent analysis due to non-evaluable staining, resulting in 60 cases, 32 of which were GC- and 28 NGC-type. Twenty-six differentially expressed microRNAs were identified (P< 0.05) (Table 3), which correctly predicted the immunophenotype of 47/60 cases (78%) and clustered cases distinctly (Fig. S1).
Table 3.
MicroRNAs differentially expressed (P< 0.05) between GC- and NGC-immunophenotypes of DLBCL de novo cases
| microRNA | P-values | Up | Fold change |
|---|---|---|---|
| hsa-miR-518a | 7.90E-03 | NGC | 3.02 |
| hsa-miR-363 | 9.60E-03 | NGC | 2.94 |
| hsa-miR-21 | 8.95E-03 | NGC | 2.64 |
| hsa-miR-132 | 2.83E-03 | NGC | 2.59 |
| hsa-miR-340 | 2.11E-02 | NGC | 2.50 |
| hsa-miR-301 | 3.82E-04 | NGC | 2.46 |
| hsa-miR-30d | 4.72E-03 | NGC | 2.44 |
| hsa-miR-221 | 2.41E-02 | NGC | 2.32 |
| hsa-miR-422b | 2.50E-02 | NGC | 2.32 |
| hsa-miR-146b | 3.57E-03 | NGC | 1.01 |
| hsa-miR-155 | 1.85E-02 | NGC | 0.91 |
| hsa-miR-190 | 2.71E-02 | NGC | 0.69 |
| hsa-miR-194 | 1.33E-02 | NGC | 0.60 |
| hsa-miR-660 | 5.25E-03 | NGC | 0.52 |
| hsa-miR-213 | 1.91E-02 | NGC | 0.52 |
| hsa-miR-222 | 3.38E-02 | NGC | 0.40 |
| hsa-miR-186 | 2.09E-02 | NGC | 0.31 |
| hsa-miR-620 | 3.57E-03 | GC | 2.49 |
| hsa-miR-616 | 4.91E-03 | GC | 2.49 |
| hsa-miR-199b | 2.21E-02 | GC | 2.48 |
| hsa-miR-421 | 3.18E-02 | GC | 2.47 |
| hsa-miR-569 | 1.03E-02 | GC | 2.30 |
| hsa-miR-653 | 1.84E-02 | GC | 2.25 |
| hsa-miR-138 | 3.32E-02 | GC | 0.74 |
| hsa-miR-520h | 7.20E-03 | GC | 0.51 |
| hsa-miR-129 | 8.08E-03 | GC | 0.35 |
MicroRNA expression is associated with clinical outcome in de novo DLBCL
While some studies have found that GC- and NGC-immunopheno-types have a prognostic significance in DLBCL [15], other studies did not reach the same conclusion [19, 20]. We did not find an association between immunophenotype and outcome in our cohort (P= 0.265; Fig. S2), but there was an association between the international prognostic index (IPI) status and survival (P= 0.02; Fig. S3). Therefore, we next assessed the relationship between microRNA expression and the IPI status.
Clinical data was available for 61 of the DLBCL de novo cases. These cases were split into two groups consisting of cases with a low IPI score (0, 1 or 2) (n= 44) and those with a high IPI score (3, 4 or 5) (n= 17). Thirteen microRNAs were found to be differentially expressed (P> 0.05) (Table 4), which clustered samples distinctly (Fig. S4), and correctly predicted 52/61 (85%) of cases.
Table 4.
MicroRNAs differentially expressed (P< 0.05) between high (3 or 4) and low (0, 1 or 2) IPI status of DLBCL de novo cases
| microRNA | P-value | Up | Fold change |
|---|---|---|---|
| hsa-miR-223 | 9.33E-03 | low | 3.38 |
| hsa-miR-363 | 1.68E-02 | low | 3.11 |
| hsa-miR-767–5p | 3.83E-02 | low | 2.38 |
| hsa-miR-345 | 1.84E-02 | low | 2.28 |
| hsa-miR-146b | 3.10E-02 | low | 0.67 |
| hsa-miR-660 | 3.60E-02 | low | 0.65 |
| hsa-miR-28 | 6.25E-04 | low | 0.59 |
| hsa-miR-34c | 4.73E-02 | low | 0.55 |
| hsa-miR-578 | 4.58E-02 | low | 0.25 |
| hsa-miR-596 | 4.62E-02 | high | 0.39 |
| hsa-miR-197 | 1.96E-02 | high | 1.23 |
| hsa-miR-329 | 4.48E-03 | high | 2.30 |
| hsa-miR-659 | 2.79E-02 | high | 2.30 |
We attempted to assess differences in microRNA expression between poor outcome and good outcome de novo DLBCL, using EFS at median follow up of 22 months as our clinical criterion. Samples from patients with EFS (n= 29) were contrasted with those from patients who had relapsed or died in this interval (n= 23). Twenty-one microRNAs were identified which allowed separation of these groups (P< 0.05) (Table 5). These 21 microRNAs correctly predicted 51/62 (82%) of cases. To investigate the effect of individual microRNA expression levels on clinical outcome we carried out log-rank (univariate) survival analysis and found that 12/21 microRNAs were associated (P < 0.05) with EFS (Table 5 and Fig. 3). High expression of miR-637, miR-608 and miR-302 were associated with poor prognosis whereas high expression of miR-330, miR-30e, miR-425, miR-27a, miR-24, miR-23a, miR-199b, miR-199a* and miR-100 were associated with better outcome (Fig. 3).
Table 5.
MicroRNAs associated with event-free survival (EFS) in de novo DLBCL cases. anova analysis (P< 0.05) was carried out between cases that were event free and those with events (relapse or death). Univariate (log-rank) analysis was carried out on individual microRNA expression levels using the median value as a cutoff, those microRNAs that were significantly associated with EFS (P< 0.05) in this analysis are depicted in bold type
| microRNA | P-value (anova) | Event-free expression | Fold change | P-value (EFS association) |
|---|---|---|---|---|
| hsa-miR-199b | 1.69E-03 | High | 2.69 | <1.00E-04 |
| hsa-miR-330 | 2.82E-02 | High | 2.41 | 8.00E-04 |
| hsa-miR-27a | 3.34E-02 | High | 0.42 | 1.00E-03 |
| hsa-miR-23a | 8.38E-03 | High | 0.72 | 5.00E-03 |
| hsa-miR-24 | 1.88E-02 | High | 0.51 | 7.00E-03 |
| hsa-miR-100 | 2.97E-02 | High | 2.37 | 1.00E-02 |
| hsa-miR-425 | 2.10E-02 | High | 0.55 | 1.00E-02 |
| hsa-miR-30e-3p | 7.05E-03 | High | 0.53 | 3.00E-02 |
| hsa-miR-199a* | 1.47E-02 | High | 0.57 | 4.00E-02 |
| hsa-miR-23b | 1.63E-02 | High | 0.50 | 9.00E-02 |
| hsa-miR-19b | 4.78E-02 | High | 2.39 | 9.00E-02 |
| hsa-miR-222 | 4.24E-02 | High | 0.76 | 2.24E-01 |
| hsa-miR-199a | 4.18E-03 | High | 0.67 | 2.98E-01 |
| hsa-miR-21 | 4.58E-02 | High | 2.40 | 1.55E-01 |
| hsa-miR-637 | 1.51E-02 | Low | 2.33 | 1.00E-03 |
| hsa-miR-302b | 7.65E-03 | Low | 2.50 | 3.00E-03 |
| hsa-miR-608 | 2.51E-02 | Low | 2.40 | 3.00E-02 |
| hsa-miR-409–3p | 1.28E-02 | Low | 2.34 | 6.00E-02 |
| hsa-miR-519d | 7.54E-03 | Low | 2.42 | 9.00E-02 |
| hsa-miR-92 | 4.64E-02 | Low | 0.76 | 1.46E-01 |
| hsa-142–3p | 4.34E-02 | Low | 0.51 | 2.58E-01 |
Figure 3.
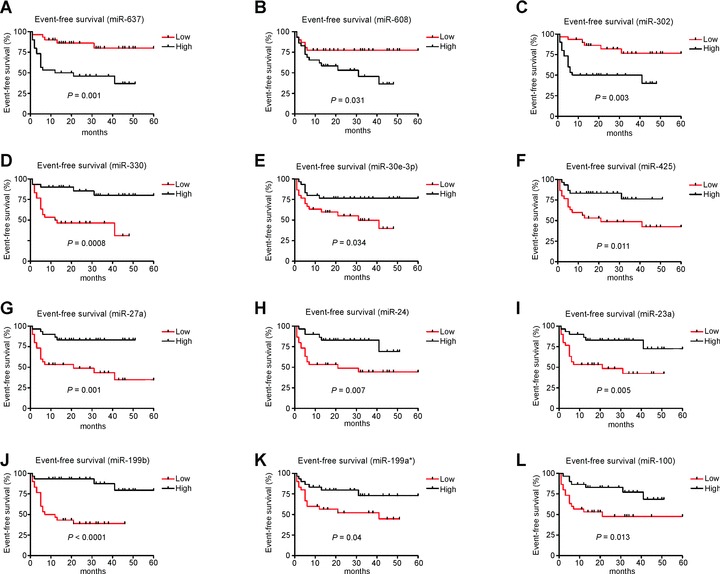
Kaplan–Meier survival curves of EFS in DLBCL patients based on high or low (median) expression levels of microRNAs (P < 0.05). Curves were compared by univariate (log-rank) analysis. (A) miR-637, (B) miR-608, (C) miR-302, (D) miR-330, (E) miR-30e-3p, (F) miR-425, (G) miR-27a, (H) miR-24, (I) miR-23a, (J) miR-199b, (K) miR-199a*and (L) miR-100.
Not all of the patients in this cohort, however, were treated with rituximab due to changes to in treatment regimens over the sample collection period. Rituximab-based treatment (R-CHOP) has been shown significantly to improve survival of DLBCL patients [21]. To address this issue we re-analysed the data using only patients treated with R-CHOP (n= 38). The 21-microRNA signature correctly predicted clinical outcome for 31/38 (82%) of these patients. Of the 12 microRNAs that were significantly associated with EFS by univariate analysis in the whole patient cohort, 5 microRNAs (miR-302, miR-330, miR-425, miR-27a and miR-199b) were still associated (P< 0.1) with EFS in patients treated with R-CHOP (Fig. 4). Additionally miR-142, miR-519 and miR-222 were associated with EFS in R-CHOP treated patients but not in the whole patient cohort. Use of these eight microRNAs resulted in correct prediction of 32/38 (84%) of cases by SVM analysis.
Figure 4.
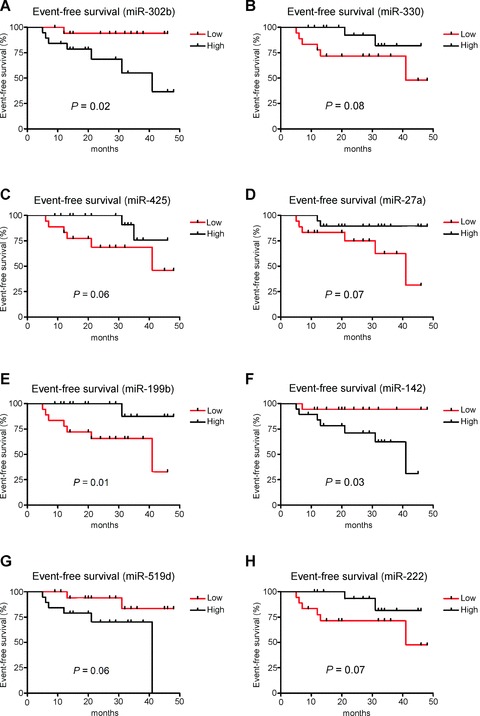
Kaplan–Meier survival curves of EFS in DLBCL patients treated with R-CHOP based on high or low (median) expression levels of microRNAs (P< 0.1). Curves were compared by univariate (log-rank) analysis. (A) miR-302b, (B) miR-330, (C) miR-425, (D) miR-27a, (E) miR-199b, (F) miR-142, (G) miR-519d and (H) miR-222.
High-grade transformation of FCL to DLBCL is associated with changes in microRNA expression
To investigate whether changes in microRNA expression were associated with transformation we first looked at differences between de novo (DLBCL de novo[n= 64]) and transformed (DLBCL-t [n= 16]) cases of DLBCL. Fourteen microRNAs (Table 6) were found to be differentially expressed (P< 0.05). These microRNAs correctly predicted transformation status in 73/80 (91%) of samples.
Table 6.
MicroRNAs differentially expressed (P < 0.05) between DLBCL de novo and DLBCL-t cases
| microRNA | P-value | Up | Fold change |
|---|---|---|---|
| hsa-miR-491 | 2.11E-02 | trans | 2.54 |
| hsa-miR-27a | 3.90E-02 | de novo | 0.47 |
| hsa-miR-19b | 3.77E-03 | de novo | 0.60 |
| hsa-miR-25 | 3.84E-02 | de novo | 0.67 |
| hsa-miR-18a | 1.24E-02 | de novo | 0.72 |
| hsa-miR-636 | 2.73E-02 | de novo | 1.06 |
| hsa-miR-92 | 1.94E-02 | de novo | 1.14 |
| hsa-miR-621 | 2.29E-02 | de novo | 1.98 |
| hsa-miR-526c | 2.44E-02 | de novo | 2.38 |
| hsa-miR-766 | 2.75E-02 | de novo | 2.58 |
| hsa-miR-299–5p | 4.76E-02 | de novo | 2.61 |
| hsa-miR-380–3p | 5.94E-03 | de novo | 2.65 |
| hsa-miR-129 | 2.98E-02 | de novo | 2.70 |
| hsa-miR-588 | 9.05E-03 | de novo | 2.80 |
Next we compared FCL cases that subsequently underwent high-grade transformation (FCL-t [n= 7]) with cases that did not (FCL-nt [n= 11]). Six microRNAs were differentially expressed (P< 0.05) between these two groups (Table S3), whose expression levels correctly predicted 16/18 (89%) of cases. All of these microRNAs had significantly (P< 0.05) different expression levels between FCL-t and FCL-nt cases as measured by independent t-test (Fig. S5).
Discussion
Aberrant expression of microRNAs is now well established in many cancer types [22]. Despite this, the role and identity of lymphoma-associated microRNAs is only poorly understood [23]. Therefore, we undertook a comprehensive investigation of microRNA expression in two of the most frequently occurring lymphomas, DLBCL and FCL, using a microRNA microarray platform containing 464 human probes (miRBase v.9.0) [16].
Although we had already made some progress in identifying lymphoma-associated microRNAs by profiling a large number of lymphoma cell lines [16], unsupervised cluster analysis showed that clinical samples had a discrete microRNA pattern from the cell lines (Fig. 1A), reinforcing the need for studies on clinical material. This analysis also showed that the microRNA profile of clinical cases of FCL and DLBCL were largely distinct.
MicroRNA expression classifies clinical samples according to diagnosis and sub-classifies DLBCL by immunophenotype
In order to identify lymphoma-associated microRNAs we compared the expression of all lymphoma samples with all the major subsets of B and T lymphocytes. The 10 most discriminatory up- and down-regulated microRNAs clustered the tumour and normal samples separately and were able to predict class in 99% of samples. Amongst the top 10 up-regulated microRNAs were miR-155, miR-21, miR-9, miR-143 and miR-145. MiR-155 has been found to increase lymphogenesis in a murine model [24] and miR-21 is up-regulated in many cancer types including lym-phoma [10, 25]. Interestingly miR-9 has been shown to target PRDM1/Blimp-1 in lymphomas [26] which is consistent with the down-regulation of PRDM1/Blimp-1 expression in DLBCL [27]. Although down-regulated in colorectal carcinoma [28] and some lymphomas [29] we found that miR-143 and miR-145 were up-regulated in DLBCL and FCL. MiR-150 has been demonstrated to be a key regulator of B-cell development [31, 32], and its down-regulation has previously been noted in DLBCL and FCL [10, 16]. Down-regulation of miR-223 has also been shown in hepatocellular carcinomas [33].
A recent study examined expression of 157 microRNAs in 58 DLBCL, and 46 FCL cases as well as 7 reactive lymph nodes [18]. This identified 12 microRNAs differentially expressed between lymphoma and reactive lymph node samples. Three of these microRNAs were included in our list of 20 most discriminatory microRNAs (miR-155, miR-150 and miR-145), and a further two (miR-99a and miR-10a) had a P-value of < 0.05. The 12-microRNAs identified by Roehle et al. correctly predicted samples as tumour or normal in 108/112 (96%) of cases.
We compared microRNA expression between FCL and DLBCL samples, comparing all cases irrespective of transformation state, and then assessing DLBCL de novo and FCL-nt only. Interestingly, 6 of the microRNAs that were identified as being up-regulated in DLBCL de novo cases compared to FCL-nt are encoded by the miR-17–92 and/or homologous clusters (average fold-increase of 1.05 [range 0.54–2.64]) [34]. The other four microRNAs encoded by these clusters, miR-17–5p, miR-19a, miR-25 and miR-106b, had P-values of 0.067, 0.087, 0.064 and 0.391, respectively. The miR-17–92 cluster is encoded at the 13q31 locus, a region commonly amplified in lymphomas and ectopic expression of miR-17–92 greatly accelerated lymphogenesis in a murine model [34]. Moreover, direct binding of the c-myc protein up-regulates miR-17–92 expression [35] and over-expression of c-myc has been demonstrated in the majority (66.6%) of DLBCL cases [36], which has also been associated with poorer outcome [37]. An increased level of this cluster in DLBCL compared to FCL is consistent with a more aggressive clinical phenotype of DLBCL.
As we had previously identified microRNAs associated with the two subtypes of DLBCL (GC- and NGC-type) in a cell line model, we sought to extend this work by looking for differences between clinical cases of DLBCL de novo that had been immunoclassified as GC- or NGC-type according to the Hans algorithm [15]. With the exception of miR-181a and miR-324, which are probably cell line specific, all of the microRNAs differentially expressed in the cell line model of GC- and NGC-type DLBCL [10, 16] were also differentially expressed in clinical cases. miR-155 expression has also been shown by other groups to be more highly expressed in DLBCL with a NGC-immunophenotype [38, 39]. Interestingly miR-221 and miR-222 have been found to target p27(Kip1)[40]. As p27 protein levels are higher in GC- than NGC-type DLBCL [41], these results are consistent with differential expression between the two immunophenotypes.
Roehle et al. reported that they could not readily discriminate between immunophenotype on the basis of their results although they did identify nine differentially expressed microRNAs, using a false discovery rate cutoff of 20%[18]. Four of these (miR-155, miR-199b, miR-138 and miR-129) had a P-value <0.05 in our patient cohort. This discrepancy may reflect differences in immunohistochemical staining of cases and/or the much larger probe set used in our study (464 c.f. 157 microRNA probes).
Expression levels of microRNAs are associated with survival in DLBCL patients
Despite the use of rituximab-based chemotherapy regimens that allow 60–80% of DLBCL patients to reach a complete remission, the response to treatment remains variable, and a substantial proportion of DLBCL patients will still succumb to this disease [13]. We therefore sought to identify microRNAs that were associated with outcome. As the gold-standard for prognostication of DLBCL remains the IPI, we firstly examined microRNAs associated with IPI status. Splitting the DLBCL de novo cases for which we had clinical data (n= 61) into low (0, 1, 2) and high (3, 4, 5) IPI class, we identified thirteen microRNAs that correctly predicted 85% of cases.
In order to see whether microRNA expression could predict outcome we analysed EFS in the DLBCL de novo patients and identified 21 differentially expressed microRNAs. 82% of cases had outcome predicted using these microRNAs. Seven of these (miR-23a, miR-27a, miR-19a, miR-21, miR-92, miR-222 and miR-142) were also found to be associated with survival by Roehle et al. [18]. We carried out univariate analysis on the expression levels of these microRNAs individually and found that 12 were significantly associated with EFS (Fig. 3). As not all of the patients in our cohort were treated with a rituximab containing regimen we re-applied univariate analysis for the 21 microRNAs to patients who were uniformly treated with R-CHOP (n= 38). Although the number of patients was small, eight of these microRNAs were still associated with EFS (Fig. 4). High expression of miR-142, miR-302b, and miR-519d and low expression of miR-330, miR-425, miR-27a, miR-199b and miR-222 were associated with poor outcome in these patients. Despite reportedly being oncogenic in breast cancer cell lines [42], our study and that of Roehle et al. [18] found that decreased expression of miR-27a was associated with poor prognosis. Recently miR-302b has been found to be expressed abundantly in embryonic stem cells and is capable of re-programming cancer cells into a pluripotent state [43]. Down-regulation of miR-199b was most significantly associated with poor outcome, whether patients received a rituximab-containing regimen or not (P < 0.0001 and 0.01, respectively). Interestingly, expression of miR-199b was also found to be associated with the GC-immunophenotype (Table 3), which in some studies is linked to a better outcome [15]. Consistent with these data, down-regulation of miR-199 has been associated with tumour progression through targeting of IKK-β[44], an enhancer of NF-κβ activity and constitutive NF-κβ activation is a hallmark of DLBCL with a poorer response to treatment [45].
Changes in microRNA expression are associated with transformation of FCL to DLBCL
Although considered an indolent disease (median survival <10 years), a significant proportion of FCL cases will undergo high-grade histological transformation to DLBCL, with poorer outcome [46]. The capacity to predict which FCL patients will transform to DLBCL has long been a goal for research that has remained stubbornly elusive. We therefore sought to determine whether microRNA expression was associated with transformation by elucidating the microRNA expression profile of DLBCL cases transformed from FCL, as well as FCL cases that subsequently underwent high-grade transformation.
Fourteen microRNAs were differentially expressed between de novo and transformed cases of DLBCL, only one of which was up-regulated in DLBCL-t (miR-491). Four of the microRNAs down-regulated in DLBCL-t are encoded by the miR-17–92 cluster suggesting an involvement of the cluster in high-grade transformation. An alternative explanation is that because the cluster was also found to be down-regulated in FCL compared with DLBCL de novo (Table 2), the expression pattern of these microRNAs in DLBCL-t cases reflects that of antecedent FCL. This latter hypothesis is consistent with gene expression profile studies that found that DLBCL-t cases were more closely related to FCL than DLBCL de novo cases [47].
A comparison of FCL-t and FCL-nt cases revealed six microRNAs that were differentially expressed that correctly predicted nearly 90% of cases. Let-7b, let-7i, miR-221 and miR-222 were up-regulated in FCL-t whereas miR-223 and miR-217 were down-regulated (Fig. S5). Members of the let-7 family have been shown to target c-myc expression in Burkitt lymphoma [48] and decreased c-myc expression has been associated with high-grade transformation of FCL to DLBCL [47]. Although the number of cases in this analysis was small, and requires further validation, these data open up the exciting possibility that microRNA expression could be used to predict FCL patients at risk of transformation that could benefit from an up-front aggressive therapy regimen.
In summary, we have carried out a comprehensive investigation of aberrantly expressed microRNAs in the most common forms of lymphoma and identified microRNAs that can discriminate between DLBCL and FCL. Different subtypes of DLBCL could also be predicted. Furthermore we have identified microRNAs associated with prognosis as well as microRNAs associated with high-grade transformation of FCL to DLBCL. Given the lack of functional information available for the majority of microRNAs identified, their role in these diseases can only be determined in future investigations, for which this study will prove an invaluable starting point.
Acknowledgments
This work was supported by the Leukaemia Research Fund and Julian Starmer-Smith Lymphoma Fund. We are very grateful to Dr. Graham Collins, Dr. Beena Pushkaran and Dr. Andrew Campbell of the Haematology Department, John Radcliffe Hospital, Oxford, UK, for all their help in retrieving clinical data.
Supporting Information
Fig. S1. Cluster analysis of microRNAs differentiallyexpressed between de novo DLBCL cases with a GC- and NGC-immunophe-notype.
Fig. S2. Kaplan-Mier survival curve of EFS in DLBCL patients based on GC- or NGC-immunophenotype. Curves were compared by univariate (log-rank) analysis.
Fig. S3. Kaplan-Mier survival curve of EFS in DLBCL patients based on IPI status. Curves were compared by univariate (log-rank) analysis.
Fig. S4. Cluster analysis of microRNAs associated with IPI status in DLBCL.
Fig. S5. Expression levels of microRNAs differentially expressed between FCL-t and FCL-nt cases. P-values were calculated by independent t-test.
Table S1. Summary of DLBCL de novo patient detailsfor whom clinical details were available (n= 61).
Table S2. MicroRNAs differentially expressed (P< 0.05) between DLBCL (DLBCL de novo and DLBCL-t) and FCL (FCL-nt and FCL-t) diagnoses.
Table S3. MicroRNAs differentially expressed (P< 0.05) between FCL cases that subsequently underwent high-gradetransformation (FCL-t) and those that did not (FCL-nt). Medianfollow-up time 60 months (range 52–132 months).
Please note: Wiley-Blackwell are not responsible for the content or functionality of any supporting materials supplied by the authors. Any queries (other than missing material) should be directed to the corresponding author for the article.
Supporting info item
References
- 1.Bentwich I, Avniel A, Karov Y, et al. Identification of hundreds of conserved and nonconserved human microRNAs. Nat Genet. 2005;37:766–70. doi: 10.1038/ng1590. [DOI] [PubMed] [Google Scholar]
- 2.Berezikov E, Guryev V, Van De Belt J, et al. Phylogenetic shadowing and computational identification of human microRNA genes. Cell. 2005;120:21–4. doi: 10.1016/j.cell.2004.12.031. [DOI] [PubMed] [Google Scholar]
- 3.Lewis BP, Burge CB, Bartel DP. Conserved seed pairing, often Flanked by adenosines, indicates that thousands of human genes are microRNA targets. Cell. 2005;120:15–20. doi: 10.1016/j.cell.2004.12.035. [DOI] [PubMed] [Google Scholar]
- 4.Kim VN. MicroRNA biogenesis: coordinated cropping and dicing. Nat Rev Mol Cell Biol. 2005;6:376–85. doi: 10.1038/nrm1644. [DOI] [PubMed] [Google Scholar]
- 5.Calin GA, Sevignani C, Dumitru CD, et al. Human microRNA genes are frequently located at fragile sites and genomic regions involved in cancers. Proc Natl Acad Sci USA. 2004;101:2999–3004. doi: 10.1073/pnas.0307323101. [DOI] [PMC free article] [PubMed] [Google Scholar]
- 6.Calin GA, Croce CM. MicroRNA-cancer connection: the beginning of a new tale. Cancer Res. 2006;66:7390–4. doi: 10.1158/0008-5472.CAN-06-0800. [DOI] [PubMed] [Google Scholar]
- 7.Lawrie CH. microRNAs and haematology: small molecules, Big function. Brit J Haematology. 2007;136:503–12. doi: 10.1111/j.1365-2141.2007.06611.x. [DOI] [PubMed] [Google Scholar]
- 8.Calin GA, Ferracin M, Cimmino A, et al. A MicroRNA signature associated with prognosis and progression in chronic lym-phocytic leukemia. N Engl J Med. 2005;353:1793–801. doi: 10.1056/NEJMoa050995. [DOI] [PubMed] [Google Scholar]
- 9.Iorio MV, Ferracin M, Liu CG, et al. MicroRNA gene expression deregulation in human breast cancer. Cancer Res. 2005;65:7065–70. doi: 10.1158/0008-5472.CAN-05-1783. [DOI] [PubMed] [Google Scholar]
- 10.Lawrie CH, Soneji S, Marafioti T, et al. MicroRNA expression distinguishes between germinal center B cell-like and activated B cell-like subtypes of diffuse large B cell lymphoma. Int J Cancer. 2007;121:1156–61. doi: 10.1002/ijc.22800. [DOI] [PubMed] [Google Scholar]
- 11.Lawrie CH, Gal S, Dunlop HM, et al. Detection of elevated levels of tumour-associated microRNAs in serum of patients with diffuse large B-cell lym-phoma. Br J Haematol. 2008;141:672–5. doi: 10.1111/j.1365-2141.2008.07077.x. [DOI] [PubMed] [Google Scholar]
- 12.Lu J, Getz G, Miska EA, et al. MicroRNA expression profiles classify human cancers. Nature. 2005;435:834–8. doi: 10.1038/nature03702. [DOI] [PubMed] [Google Scholar]
- 13.Coiffier B. Diffuse large cell lymphoma. Curr Opin Oncol. 2001;13:325–34. doi: 10.1097/00001622-200109000-00003. [DOI] [PubMed] [Google Scholar]
- 14.Alizadeh AA, Eisen MB, Davis RE, et al. Distinct types of diffuse large B-cell lym-phoma identified by gene expression profiling. Nature. 2000;403:503–11. doi: 10.1038/35000501. [DOI] [PubMed] [Google Scholar]
- 15.Hans CP, Weisenburger DD, Greiner TC, et al. Confirmation of the molecular classification of diffuse large B-cell lym-phoma by immunohistochemistry using a tissue microarray. Blood. 2004;103:275–82. doi: 10.1182/blood-2003-05-1545. [DOI] [PubMed] [Google Scholar]
- 16.Lawrie CH, Saunders NJ, Soneji S, et al. MicroRNA expression in lymphocyte development and malignancy. Leukemia. 2008;22:1440–6. doi: 10.1038/sj.leu.2405083. [DOI] [PubMed] [Google Scholar]
- 17.Smyth GK, Speed T. Normalization of cDNA microarray data. Methods. 2003;31:265–73. doi: 10.1016/s1046-2023(03)00155-5. [DOI] [PubMed] [Google Scholar]
- 18.Roehle A, Hoefig KP, Repsilber D, et al. MicroRNA signatures characterize diffuse large B-cell lymphomas and follicular lym-phomas. Br J Haematol. 2008;142:732–44. doi: 10.1111/j.1365-2141.2008.07237.x. [DOI] [PubMed] [Google Scholar]
- 19.De Paepe P, Achten R, Verhoef G, et al. Large cleaved and immunoblastic lym-phoma may represent two distinct clinico-pathologic entities within the group of diffuse large B-cell lymphomas. J Clin Oncol. 2005;23:7060–8. doi: 10.1200/JCO.2005.15.503. [DOI] [PubMed] [Google Scholar]
- 20.Colomo L, Lopez-Guillermo A, Perales M, et al. Clinical impact of the differentiation profile assessed by immunopheno-typing in patients with diffuse large B-cell lymphoma. Blood. 2003;101:78–84. doi: 10.1182/blood-2002-04-1286. [DOI] [PubMed] [Google Scholar]
- 21.Coiffier B, Lepage E, Briere J, et al. CHOP chemotherapy plus rituximab compared with CHOP alone in elderly patients with diffuse large-B-cell lym-phoma. N Engl J Med. 2002;346:235–42. doi: 10.1056/NEJMoa011795. [DOI] [PubMed] [Google Scholar]
- 22.Croce CM. Oncogenes and cancer. N Engl J Med. 2008;358:502–11. doi: 10.1056/NEJMra072367. [DOI] [PubMed] [Google Scholar]
- 23.Lawrie CH. MicroRNA expression in lym-phoma. Expert Opin Biolog Ther. 2007;7:1363–74. doi: 10.1517/14712598.7.9.1363. [DOI] [PubMed] [Google Scholar]
- 24.Costinean S, Zanesi N, Pekarsky Y, et al. Pre-B cell proliferation and lym-phoblastic leukemia/high-grade lymphoma in E(mu)-miR155 transgenic mice. Proc Natl Acad Sci USA. 2006;103:7024–9. doi: 10.1073/pnas.0602266103. [DOI] [PMC free article] [PubMed] [Google Scholar]
- 25.Si ML, Zhu S, Wu H, et al. miR-21-medi-ated tumor growth. Oncogene. 2006;26:2799–803. doi: 10.1038/sj.onc.1210083. [DOI] [PubMed] [Google Scholar]
- 26.Nie K, Gomez M, Landgraf P, et al. MicroRNA-mediated down-regulation of PRDM1/Blimp-1 in Hodgkin/Reed-Sternberg cells: a potential pathogenetic lesion in Hodgkin lymphomas. Am J Pathol. 2008;173:242–52. doi: 10.2353/ajpath.2008.080009. [DOI] [PMC free article] [PubMed] [Google Scholar]
- 27.Pasqualucci L, Compagno M, Houldsworth J, et al. Inactivation of the PRDM1/BLIMP1 gene in diffuse large B cell lymphoma. J Exp Med. 2006;203:311–7. doi: 10.1084/jem.20052204. [DOI] [PMC free article] [PubMed] [Google Scholar]
- 28.Michael MZ, SM OC, Van Holst Pellekaan NG, et al. Reduced accumulation of specific microRNAs in colorectal neoplasia. Mol Cancer Res. 2003;1:882–91. [PubMed] [Google Scholar]
- 29.Akao Y, Nakagawa Y, Kitade Y, et al. Downregulation of microRNAs-143 and -145 in B-cell malignancies. Cancer Sci. 2007;98:1914–20. doi: 10.1111/j.1349-7006.2007.00618.x. [DOI] [PMC free article] [PubMed] [Google Scholar]
- 30.Bruchova H, Merkerova M, Prchal JT. Aberrant expression of microRNA in poly-cythemia vera. Haematologica. 2008;93:1009–16. doi: 10.3324/haematol.12706. [DOI] [PubMed] [Google Scholar]
- 31.Zhou B, Wang S, Mayr C, et al. miR-150, a microRNA expressed in mature B and T cells, blocks early B cell development when expressed prematurely. Proc Natl Acad Sci USA. 2007;104:7080–5. doi: 10.1073/pnas.0702409104. [DOI] [PMC free article] [PubMed] [Google Scholar]
- 32.Xiao C, Calado DP, Galler G, et al. MiR-150 controls B cell differentiation by targeting the transcription factor c-Myb. Cell. 2007;131:146–59. doi: 10.1016/j.cell.2007.07.021. [DOI] [PubMed] [Google Scholar]
- 33.Wong QW, Lung RW, Law PT, et al. MicroRNA-223 is commonly repressed in hepatocellular carcinoma and potentiates expression of Stathmin1. Gastroenterology. 2008;135:257–69. doi: 10.1053/j.gastro.2008.04.003. [DOI] [PubMed] [Google Scholar]
- 34.He L, Thomson JM, Hemann MT, et al. A microRNA polycistron as a potential human oncogene. Nature. 2005;435:828–33. doi: 10.1038/nature03552. [DOI] [PMC free article] [PubMed] [Google Scholar]
- 35.O’Donnell KA, Wentzel EA, Zeller KI, et al. c-Myc-regulated microRNAs modulate E2F1 expression. Nature. 2005;435:839–43. doi: 10.1038/nature03677. [DOI] [PubMed] [Google Scholar]
- 36.Aref S, Mabed M, Zalata K, et al. The interplay between c-Myc oncogene expression and circulating vascular endothelial growth factor (sVEGF), its antagonist receptor, soluble Flt-1 in diffuse large B cell lymphoma (DLBCL): relationship to patient outcome. Leuk Lymphoma. 2004;45:499–506. doi: 10.1080/10428190310001607151. [DOI] [PubMed] [Google Scholar]
- 37.Pagnano KB, Vassallo J, Lorand-Metze I, et al. p53, Mdm2, and c-Myc overexpres-sion is associated with a poor prognosis in aggressive non-Hodgkin’s lymphomas. Am J Hematol. 2001;67:84–92. doi: 10.1002/ajh.1084. [DOI] [PubMed] [Google Scholar]
- 38.Eis PS, Tam W, Sun L, et al. Accumulation of miR-155 and BIC RNA in human B cell lymphomas. Proc Natl Acad Sci USA. 2005;102:3627–32. doi: 10.1073/pnas.0500613102. [DOI] [PMC free article] [PubMed] [Google Scholar]
- 39.Kluiver J, Poppema S, De Jong D, et al. BIC and miR-155 are highly expressed in Hodgkin, primary mediastinal and diffuse large B cell lymphomas. J Pathol. 2005;207:243–9. doi: 10.1002/path.1825. [DOI] [PubMed] [Google Scholar]
- 40.Le Sage C, Nagel R, Egan DA, et al. Regulation of the p27(Kip1) tumor suppressor by miR-221 and miR-222 promotes cancer cell proliferation. EMBO J. 2007;26:3699–708. doi: 10.1038/sj.emboj.7601790. [DOI] [PMC free article] [PubMed] [Google Scholar]
- 41.Paik JH, Jeon YK, Park SS, et al. Expression and prognostic implications of cell cycle regulatory molecules, p16, p21, p27, p14 and p53 in germinal centre and non-germinal centre B-like diffuse large B-cell lymphomas. Histopathology. 2005;47:281–91. doi: 10.1111/j.1365-2559.2005.02222.x. [DOI] [PubMed] [Google Scholar]
- 42.Mertens-Talcott SU, Chintharlapalli S, Li X, Safe S. The oncogenic microRNA-27a targets genes that regulate specificity protein transcription factors and the G2-M checkpoint in MDA-MB-231 breast cancer cells. Cancer Res. 2007;67:11001–11. doi: 10.1158/0008-5472.CAN-07-2416. [DOI] [PubMed] [Google Scholar]
- 43.Lin SL, Chang DC, Chang-Lin S, et al. Mir-302 reprograms human skin cancer cells into a pluripotent ES-cell-like state. RNA. 2008;14:2115–24. doi: 10.1261/rna.1162708. [DOI] [PMC free article] [PubMed] [Google Scholar]
- 44.Chen R, Alvero AB, Silasi DA, et al. Regulation of IKKbeta by miR-199a affects NF-kappaB activity in ovarian cancer cells. Oncogene. 2008;27:4712–23. doi: 10.1038/onc.2008.112. [DOI] [PMC free article] [PubMed] [Google Scholar]
- 45.Davis RE, Brown KD, Siebenlist U, Staudt LM. Constitutive nuclear factor kappaB activity is required for survival of activated B cell-like diffuse large B cell lymphoma cells. J Exp Med. 2001;194:1861–74. doi: 10.1084/jem.194.12.1861. [DOI] [PMC free article] [PubMed] [Google Scholar]
- 46.Montoto S, Davies AJ, Matthews J, et al. Risk and clinical implications of transformation of follicular lymphoma to diffuse large B-cell lymphoma. J Clin Oncol. 2007;25:2426–33. doi: 10.1200/JCO.2006.09.3260. [DOI] [PubMed] [Google Scholar]
- 47.Lossos IS, Alizadeh AA, Diehn M, et al. Transformation of follicular lymphoma to diffuse large-cell lymphoma: alternative patterns with increased or decreased expression of c-myc and its regulated genes. Proc Natl Acad Sci USA. 2002;99:8886–91. doi: 10.1073/pnas.132253599. [DOI] [PMC free article] [PubMed] [Google Scholar]
- 48.Sampson VB, Rong NH, Han J, et al. MicroRNA let-7a down-regulates MYC and reverts MYC-induced growth in Burkitt lymphoma cells. Cancer Res. 2007;67:9762–70. doi: 10.1158/0008-5472.CAN-07-2462. [DOI] [PubMed] [Google Scholar]
Associated Data
This section collects any data citations, data availability statements, or supplementary materials included in this article.
Supplementary Materials
Supporting info item