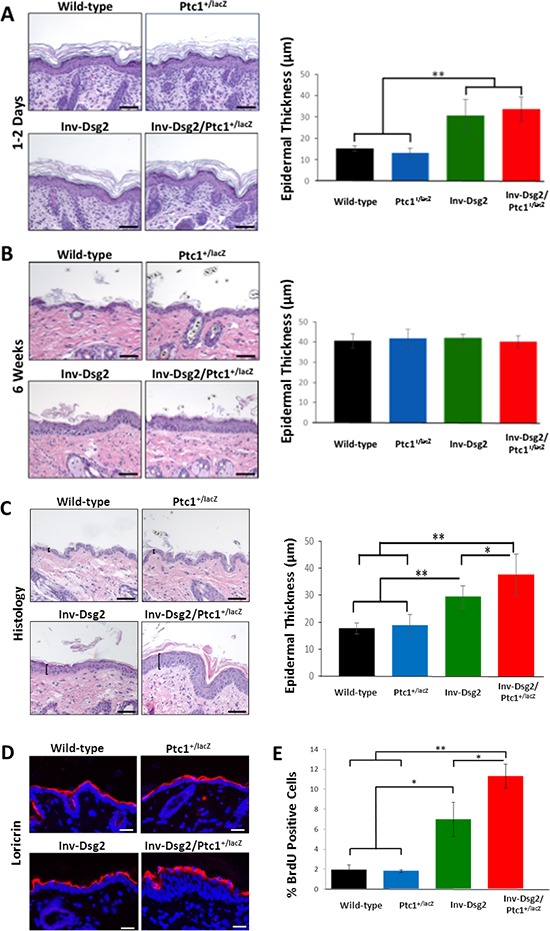
Figure 2. Inv-Dsg2/Ptc1+/lacZ mice exhibit epidermal hyperproliferation.

(A–C) Histological analysis of newborn mouse skin (A) 6 weeks (B) and 3-month (C) mouse backskin. Epidermal thickness was measured as indicated by brackets. Graphical representation of average epidermal thickness is presented in microns. Newborn: WT (n = 3); Ptc1+/lacZ (n = 4); Inv-Dsg2 (n = 6); Inv-Dsg2/Ptc1+/lacZ (n = 4); 6 week: WT (n = 5); Ptc1+/lacZ (n = 2); Inv-Dsg2 (n = 5); Inv-Dsg2/Ptc1+/lacZ (n = 5); 3 month: WT (n = 10); Ptc1+/lacZ (n = 6); Inv-Dsg2 (n = 4); Inv-Dsg2/Ptc1+/lacZ (n = 7). D. IF of the cornified envelop marker loricrin (red); nuclei counterstained with DAPI (blue). E. Graphical representation of number of BrdU positive cells per 100 basal keratinocytes. WT (n = 5); Ptc1+/lacZ (n = 3); Inv-Dsg2 (n = 3); Inv-Dsg2/Ptc1+/lacZ (n = 4). The data are shown as the mean ± SEM. *p < 0.05; **p < 0.01; t-test. Scale bar = 50 microns.
