
Figure 5. Activation of AKT induces stabilization of the MDMX/MDM2 heterocomplex and accumulation of cytoplasmic p53 due to PTPRO deletion.
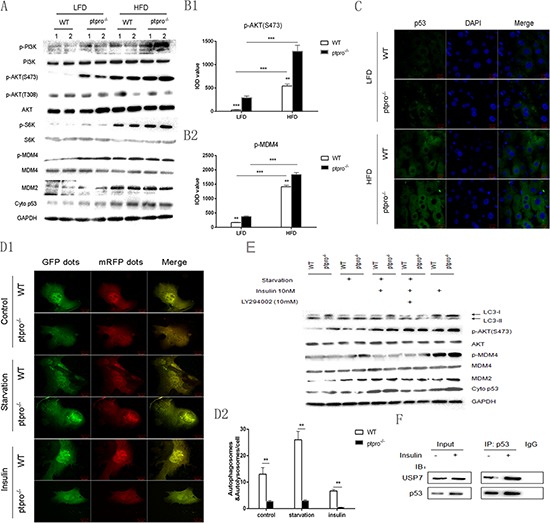
(A) Mice were fed a LFD or HFD, then liver tissues were collected and the protein extracts were analyzed by western-blot for p-PI3K, PI3K, p-AKT, AKT, p-S6K, S6K, p-MDM4, MDM2 and cytoplasmic (cyto) p53. (B) Average integrated optical density (IOD) was obtained by analyzing five fields for each slide evaluated by Image-Pro Plus software (version 5.0) for IHC staining of p-AKT and p-MDM4. (C) After 16 weeks of feeding a LFD or HFD, liver frozen sections were used to detect subcellular localization of p53 (green) by immunofluorescence, cells were counterstained with 4′,6-Diamidino-2-phenylindole (DAPI) to visualize the nuclei. Scale bar, 10 μm. (D1) Primary hepatocytes were plated onto glass-bottomed culture chambers for 12 h, followed by transfection with mRFP-GFP-LC3 labeled adenovirus. Cells were then treated with EBSS or insulin as previously described. mRFP-GFP-LC3 was visualized by confocal microscopy. Scale bar, 20 μm. (D2) Quantification analysis of autophagy dots in hepatocytes. Data represent mean ± SEM from three independent experiments. (E) Hepatocytes were isolated from both WT and ptpro−/− mice, the cells were treated with either DMEM or EBSS for 8 h, then insulin (10 nM) was added to the cell culture dish for 8 h. LY294002 (100 mM) was added to some of the cell cultures prior to insulin as noted. The protein levels of LC3-I and II, p-AKT, p-MDM4, MDM2 and cytoplasmic (cyto) p53 were detected by western blot. (F) Combination of p53 and USP7 in mouse hepatocytes treated with or without insulin, as detected by Co-IP. All data are expressed as mean ± SEM. *P < 0.05, **P < 0.01, ***P < 0.001.