

Abstract
Background and purpose
Low vitamin D levels, measured by serum 25-hydroxyvitamin D [25(OH)D], are associated with increased stroke risk. Less is known about whether this association differs by race or D binding protein (DBP) single nucleotide polymorphism (SNP) status. Our objective was to characterize the associations of and interactions between 25(OH)D levels and DBP SNPs with incident stroke. It was hypothesized that associations of low 25(OH)D with stroke risk would be stronger amongst persons with genotypes associated with higher DBP levels.
Methods
25(OH)D was measured by mass spectroscopy in 12 158 participants in the Atherosclerosis Risk in Communities (ARIC) study (baseline 1990–1992, mean age 57 years, 57% female, 23% black) and they were followed through 2011 for adjudicated stroke events. Two DBP SNPs (rs7041, rs4588) were genotyped. Cox models were adjusted for demographic/behavioral/socioeconomic factors.
Results
During a median of 20 years follow-up, 804 incident strokes occurred. The lowest quintile of 25(OH)D (<17.2 ng/ml) was associated with higher stroke risk [hazard ratio (HR) 1.34 (1.06–1.71) versus highest quintile]; this association was similar by race (P interaction 0.60). There was weak evidence of increased risk of stroke amongst those with 25(OH)D < 17.2 ng/ml and either rs7041 TG/GG [HR = 1.29 (1.00–1.67)] versus TT genotype [HR = 1.19 (0.94–1.52)] (P interaction 0.28) or rs4588 CA/AA [HR = 1.37 (1.07–1.74)] versus CC genotype [HR = 1.14 (0.91–1.41)] (P interaction 0.11).
Conclusions
Low 25(OH)D is a risk factor for stroke. Persons with low 25 (OH)D who are genetically predisposed to high DBP (rs7041 G, rs4588 A alleles), who therefore have lower predicted bioavailable 25(OH)D, may be at greater risk for stroke, although our results were not conclusive and should be interpreted as hypothesis generating.
Keywords: race, stroke, vitamin D
Introduction
Low levels of vitamin D, as measured by serum 25-hydroxy-vitamin D [25(OH)D], have been estimated to affect approximately 1 billion people worldwide [1] and are associated with increased risk of stroke [2–4]. However, most previous studies have been performed in older white populations [2–4]. Blacks tend to have lower levels of 25(OH)D compared to whites [5]. Little is known about potential racial differences in the association between 25(OH)D and stroke, although there is some evidence that low 25(OH)D is a stronger cardiovascular disease risk factor in whites than blacks [6–9].
Approximately 85%–90% of circulating 25(OH)D is tightly bound to vitamin D binding protein (DBP) and is generally believed to be inactive. Of the remaining circulating 25(OH)D, 10%–15% is loosely bound to albumin and <1% is free. Recent work has shown that bioavailable 25(OH)D – which includes free and albumin-bound 25(OH)D – is more tightly associated with clinical outcomes, including bone and mineral metabolism, than total 25(OH)D [10–12]. Blacks and whites are believed to have similar concentrations of estimated bioavailable 25(OH)D, because blacks have lower levels of both total 25(OH)D and DBP compared to whites [5]. There are two common single nucleotide polymorphisms (SNPs) on the DBP gene, rs7041 and rs4588, which have been shown to explain ∼80% of the variability in serum DBP levels [5]. Blacks have been shown to be more likely than whites to have a T allele at rs7041 and to have a C allele at rs4588, which both result in lower levels of serum DBP [5]. Although the DBP SNPs have not been independently associated with ischaemic stroke [13], it is possible that these SNPs modify the relationship between 25(OH)D levels and stroke risk, potentially reflecting differences in underlying bioavailable 25(OH)D.
Our objective was to characterize the associations of and interactions between 25(OH)D levels, race and DBP SNPs with incident stroke occurring over approximately 20 years of follow-up in the community-based Atherosclerosis Risk in Communities (ARIC) study. It was hypothesized that lower concentrations of 25(OH) D would be associated with greater stroke risk, and that these associations would be modified by race (higher risk in whites versus blacks) [6] and by rs7041 and rs4588 SNPs (higher risk with rs7041 G versus T allele and rs4588 A versus C allele, i.e. those genetically predisposed to higher DBP levels and thus those with lower levels of bioavailable vitamin D) [5].
Methods
Study population
The ARIC study is an ongoing, community-based prospective cohort of 15 792 adults aged 45–65 years at baseline (1987–1989) from four US communities: suburbs of Minneapolis, Minnesota, Washington County, Maryland, Forsyth County, North Carolina, and Jackson, Mississippi [14]. Four additional in-person study visits have taken place in 1990–1992 (visit 2), 1993–1995 (visit 3), 1996–1998 (visit 4) and 2011–2013 (visit 5). The ARIC study has been approved by the Institutional Review Boards of all participating institutions. Participants gave written informed consent at each study visit and for the use of genetic data.
25(OH)D levels were measured from serum samples obtained at visit 2 (1990–1992), which serves as the baseline for the present study. Of the 14 348 participants who attended visit 2, 275 with prevalent stroke, 1178 missing 25(OH)D data, 645 missing genetic data or who did not consent for the use of genetic data, and 92 missing other variables of interest were excluded, leaving a total of 12 158 included participants.
Measurement of 25(OH)D and associated biomarkers
25(OH)D2 and 25(OH)D3 levels were measured from serum samples stored at −70°C until analyzed in 2012–2013 using liquid chromatography tandem high-sensitivity mass spectrometry (Waters Alliance e2795; Waters, Milford, MA, USA). Using samples collected in duplicate tubes and stored, the coefficient of variation (processing plus assay variation) for 25(OH)D2 was 20.8% and for 25(OH)D3 was 6.9%. The Pearson correlations from these blind duplicate samples were 0.98 for 25(OH)D2 and 0.97 for 25(OH)D3. 25(OH)D2 and 25(OH)D3 were added together for total 25(OH) D concentration.
Using the same stored serum samples, calcium, phosphorus and parathyroid hormone (PTH) were also measured (calcium and phosphate, Roche Modular P-Chemistry Analyzer; PTH, Elecsys 2010, Roche Diagnostics, Indianapolis, IN, USA). At the time of visit 2, serum magnesium was measured based on the procedure of Gindler and Heth and used the metallochromic dye calmagite [1-(1-hydroxy-4-methyl-2-phenylazo)-2-naphthol-4-sulfonic acid] [15].
DBP SNPs
Two common SNPs located in the coding region of the DBP gene (rs7041 and rs4588) [5] were genotyped using the ITMAT-Broad-CARe Chip, a custom 50 K SNP genotyping array, at the Broad Institute of Massachusetts Institute of Technology and Harvard. Quality control procedures were published previously [16]. Few blacks had rs7041 GG and rs4588 AA genotypes (2.8% and 1.1%, respectively). Thus, rs7041 was categorized as TT (reference) versus TG/GG and rs4588 as CC (reference) versus AC/AA. In sensitivity analyses, an additive genetic model (TT versus TG versus GG for rs7041; CC versus AC versus AA for rs4588) was considered. Additionally, haplo-types were considered: Gc1s/Gc1s (rs7041 GG and rsr588 CC), Gc1F/Gc1S (rs7041 TG and rsr588 CC), Gc2/Gc2 (rs7041 TT and rsr588 AA), Gc2/Gc1F (rs7041 TT and rsr588 AC) and Gc1F/Gc1F (rs7041 TT and rsr588 CC) [5].
Ascertainment of incident stroke
All stroke-related hospitalizations and deaths occurring through 31 December 2011 in ARIC participants were identified by annual telephone follow-up call and community surveillance of all ARIC hospitalizations. Hospital records for all possible stroke-related hospitalizations were obtained (ICD-9 codes 430–438 until 1997 and ICD-9 codes 430–436 afterwards). Definite/probable hospitalized strokes were classified by a combination of computer algorithm and physician review, using standardized criteria [17]. Strokes were subclassified as ischaemic versus hemorrhagic.
Covariates
All variables used in the analyses were assessed at visit 2 (1990–1992), unless otherwise stated. All continuous variables were centered at the median. Covariates in our main regression model included age (continuous), sex (male; female), race/center (Minnesota whites; Maryland whites; North Carolina whites; North Carolina blacks; Mississippi blacks), education (<high school; high school or equivalent; college, graduate or professional school; assessed at visit 1), physical activity (score range 1–5, based on replies to the modified Baecke Physical Activity questionnaire [18]; assessed at visit 1), cigarette smoking (current; former; never) and body mass index [continuous; weight (kg)/height (m2)].
Covariates in supplemental models included diabetes (self-reported physician diagnosis, medication use, fasting serum glucose ≥126 mg/dl or nonfasting glucose ≥200 mg/dl), hypertension (self-reported physician diagnosis, medication use, systolic blood pressure ≥140 mmHg or diastolic blood pressure ≥90 mmHg), total and high density lipoprotein (HDL) cholesterol (mg/dl), estimated glomerular filtration rate (continuous; calculated using the Chronic Kidney Disease Epidemiology Collaboration formula [19]), as well as serum calcium (continuous), phosphorus (continuous), PTH (continuous) and magnesium (continuous).
Statistical analysis
25(OH)D concentrations vary by season and by race [1]. Therefore 25(OH)D was adjusted for seasonal change by computing the residuals from a linear regression model (25(OH)D, dependent variable; month of visit, independent variable). The residuals were added back to the mean to create an estimated annual 25(OH) D value. This adjustment was performed separately for whites and for blacks. The estimated annual 25(OH)D value was used in all analyses and was divided into quintiles based on the distribution in the overall population (<17.2 ng/ml; 17.2 to <21.7 ng/ml; 21.7 to <26 ng/ml; 26.0 to <31 ng/ml; ≥31.0 ng/ml).
Baseline characteristics (1990–1992) of the study population were described using means and proportions across quintiles of 25(OH)D and distributions were compared using t tests for continuous variables and chi-squared statistics for categorical variables. Cox proportional hazards models were used to estimate the hazard ratios for the association of 25(OH)D categories with incident stroke. The proportional hazards assumption was checked using Schoenfeld residuals and ln (−ln) survival plots. The association of 25(OH)D with incident stroke was also modeled continuously using a restricted cubic spline model. Two-way multiplicative interactions of 25(OH)D by race, serum magnesium or DBP gene polymorphisms rs7041 and rs4588 were formally tested using Wald tests and stratified analyses were presented if there was any evidence for interaction. However, a priori it was decided to present results overall and stratified by race based on prior studies [6]. When testing for interaction, the lowest quintile of 25 (OH)D was compared to the other four higher quintiles to increase statistical power (this cutpoint corresponds to a threshold effect seen in our primary analyses of 25 (OH)D and incident stroke). In sensitivity analyses, analyses were performed separately for incident ischaemic and hemorrhagic strokes.
Two primary models were created: model 1 was adjusted for demographic factors [age, sex, race/field center (overall models) or center (race-stratified models)]; model 2 was adjusted for variables included in model 1 + behavioral/socioeconomic variables (education, physical activity, smoking, body mass index). Two additional analyses were performed: (i) model 2 + potential mediators (diabetes, systolic and diastolic blood pressure, use of hypertension medication, total and HDL cholesterol, and estimated glomerular filtration rate), and (ii) model 2 + potential mediators + biomarkers related to vitamin D metabolism (calcium, phosphorus, PTH and magnesium).
All reported P values were two-sided and P < 0.05 was considered statistically significant. Analyses were performed using Stata Version 13 (StataCorp, College Station, TX, USA).
Results
In the overall study population, mean age was 57 years, 57% were female and 23% were black. Median 25(OH) D concentration was 23.9 ng/ml overall and 18.2 ng/ml amongst blacks versus 25.6 ng/ml amongst whites (P < 0.001). Compared to those with 25(OH)D concentration in the highest quintile, those with 25(OH)D concentration in the lowest quintile were significantly younger, were more likely to be female and had lower levels of physical activity (all P < 0.001). Those in the lowest 25(OH)D quintile were also significantly more likely to have diabetes and hypertension compared to those in the highest quintile (all P < 0.001) (Table 1). Characteristics of the study population by 25(OH)D quintile stratified by race were similar to the overall patterns (Table S1).
Table 1. Participant characteristics by 25(OH)D quintile, ARIC visit 2 (1990–1992).
| Quintiles of 25(OH)D | |||||
|---|---|---|---|---|---|
|
|
|||||
| Quintile 1 (<17.2 ng/ml) (n = 2431) | Quintile 2 (17.2 to <21.7 ng/ml) (n = 2432) | Quintile 3 (21.7 to <26.0 ng/ml) (n = 2431) | Quintile 4 (26.0 to <31.0 ng/ml) (n = 2432) | Quintile 5 (≥31.0 ng/ml) (n = 2432) | |
| 25(OH)D (ng/ml), median | 14.0 | 19.6 | 23.9 | 28.4 | 35.2 |
| Vitamin D binding protein gene polymorphisms, % | |||||
| rs7041 | |||||
| TT | 51.1 | 38.0 | 28.4 | 22.9 | 14.4 |
| TG/GG | 48.9 | 62.0 | 71.6 | 77.1 | 85.6 |
| rs4588 | |||||
| CC | 59.2 | 54.3 | 55.5 | 57.0 | 65.9 |
| AC/AA | 40.8 | 45.7 | 44.5 | 43.0 | 34.1 |
| Age (years), mean (SD) | 56.1 (5.7) | 56.8 (5.7) | 57.0 (5.7) | 57.1 (5.7) | 57.4 (5.7) |
| Female, % | 73.3 | 61.9 | 53.2 | 48.4 | 49.6 |
| Race/center, % | |||||
| Minneapolis, MN, whites | 17.7 | 24.9 | 31.7 | 31.7 | 32.0 |
| Washington County, MD, whites | 18.5 | 24.9 | 28.6 | 28.8 | 30.1 |
| Forsyth County, NC, whites | 13.4 | 19.2 | 22.8 | 28.0 | 31.9 |
| Forsyth County, NC, blacks | 6.2 | 3.3 | 1.6 | 0.9 | 0.6 |
| Jackson, MS, blacks | 44.2 | 27.8 | 15.3 | 10.7 | 5.4 |
| Education, %a | |||||
| <High school | 24.2 | 22.6 | 19.4 | 18.8 | 18.1 |
| High school or vocational school | 39.4 | 41.2 | 40.5 | 43.8 | 45.2 |
| College, graduate or professional school | 36.5 | 36.1 | 40.1 | 37.4 | 36.8 |
| Smoking status, % | |||||
| Never | 42.4 | 42.9 | 42.6 | 38.8 | 36.9 |
| Former | 29.8 | 34.6 | 38.1 | 42.2 | 43.5 |
| Current | 27.9 | 22.5 | 19.3 | 19.0 | 19.6 |
| Physical activity index, mean (SD)a | 2.2 (0.7) | 2.3 (0.7) | 2.5 (0.8) | 2.6 (0.8) | 2.7 (0.9) |
| Body mass index (kg/m2), mean (SD) | 29.9 (6.7) | 28.5 (5.4) | 28.0 (5.0) | 27.3 (4.6) | 26.1 (4.2) |
| Diabetes, % | 20.7 | 17.3 | 13.5 | 10.9 | 8.1 |
| Hypertension, % | 44.9 | 37.6 | 32.7 | 30.9 | 27.1 |
| Total cholesterol (mg/dl), mean (SD) | 210 (41.4) | 212 (40.1) | 210 (38.7) | 209 (38.2) | 210 (37.7) |
| HDL cholesterol (mg/dl), mean (SD) | 50.2 (17.0) | 49.7 (16.5) | 48.8 (15.9) | 48.8 (16.3) | 51.8 (17.9) |
| Estimated GFR <60 ml/min/1.73 m2, % | 2.1 | 2.0 | 1.4 | 1.3 | 2.7 |
| PTH (pg/ml), mean (SD) | 50.4 (25.0) | 43.9 (29.4) | 41.8 (19.7) | 39.6 (17.9) | 36.5 (12.4) |
| Calcium (mg/dl), mean (SD) | 9.4 (0.5) | 9.4 (0.4) | 9.3 (0.4) | 9.4 (0.4) | 9.3 (0.4) |
| Phosphorus (mg/dl), mean (SD) | 3.6 (0.5) | 3.6 (0.5) | 3.5 (0.5) | 3.5 (0.5) | 3.5 (0.5) |
| Magnesium (mEq/l), mean (SD) | 1.6 (0.2) | 1.6 (0.2) | 1.6 (0.2) | 1.6 (0.2) | 1.6 (0.2) |
25(OH)D, 25-hydroxyvitamin D; ARIC, Atherosclerosis Risk in Communities; GFR, glomerular filtration rate; HDL, high density lipoprotein; PTH, parathyroid hormone.
The following variables contained missing data: diabetes (n = 18), hypertension (n = 35), total cholesterol (n = 17), HDL cholesterol (n = 38), PTH (n = 156), calcium (n = 155), phosphorus (n = 155) and magnesium (n = 2).
Assessed at ARIC visit 1 (1987–1989).
During a median of 20 years of follow-up, there were 804 incident strokes. After adjustment for demographic factors, being in the lowest quintile of 25(OH) D was associated with a significantly greater risk of stroke compared to the highest quintile [hazard ratio (HR) = 1.49 (1.18–1.89)] (Table 2). This association was attenuated but remained statistically significant after additional adjustment for behavioral/socioeconomic factors [HR = 1.34 (1.06–1.71)]. Results were not appreciably altered when further adjusted for possible mediators and biomarkers related to vitamin D metabolism. Similar patterns were seen stratified by race (P interaction 0.60), although power was lower in race-specific analyses, particularly amongst blacks. No evidence of interaction by serum magnesium concentration (P interaction 0.86) was seen. Figure 1 shows the continuous association of 25(OH)D with incident stroke risk overall and by race. Similar to the quintile analysis, there was evidence for an association between 25(OH)D and increased risk of stroke primarily amongst those with low values of 25(OH)D, suggesting a possible threshold effect at approximately 15–20 ng/ml. Results for incident ischaemic stroke (n = 711 events) were similar to the associations for total stroke events. Analyses for hemorrhagic stroke were not significant but were limited by small numbers of events (n = 93) (Table S2).
Table 2. Adjusteda hazard ratios (95% confidence intervals) for incident stroke by 25(OH)D quintile; follow-up 1990–1992 through 2011.
| Quintiles of 25(OH)D | |||||
|---|---|---|---|---|---|
|
|
|||||
| Quintile 1 (<17.2 ng/ml) | Quintile 2 (17.2 to <21.7 ng/ml) | Quintile 3 (21.7 to <26.0 ng/ml) | Quintile 4 (26.0 to <31.0 ng/ml) | Quintile 5 (≥31.0 ng/ml) | |
| Overall | |||||
| Median 25(OH)D (ng/ml) | 14.0 | 19.6 | 23.9 | 28.4 | 35.2 |
| n events/n total | 203/2431 | 167/2432 | 148/2431 | 150/2432 | 136/2432 |
| Model 1 | 1.49 (1.18–1.89) | 1.16 (0.91–1.46) | 1.06 (0.84–1.34) | 1.10 (0.87–1.38) | Reference |
| Model 2 | 1.34 (1.06–1.71) | 1.07 (0.85–1.36) | 1.02 (0.80–1.29) | 1.06 (0.84–1.34) | Reference |
| Blacks | |||||
| Median 25(OH)D (ng/ml) | 13.6 | 19.3 | 23.5 | 28.2 | 34.3 |
| n events/n total | 129/1225 | 70/755 | 37/411 | 34/282 | 15/145 |
| Model 1 | 1.36 (0.79–2.35) | 1.02 (0.58–1.79) | 0.95 (0.52–1.73) | 1.25 (0.68–2.30) | Reference |
| Model 2 | 1.39 (0.80–2.41) | 1.03 (0.59–1.81) | 0.97 (0.53–1.77) | 1.25 (0.68–2.30) | Reference |
| Whites | |||||
| Median 25(OH)D (ng/ml) | 14.4 | 19.8 | 23.9 | 28.4 | 35.3 |
| n events/n total | 74/1206 | 97/1677 | 111/2020 | 116/2150 | 121/2287 |
| Model 1 | 1.52 (1.13–2.04) | 1.22 (0.93–1.60) | 1.09 (0.84–1.41) | 1.05 (0.82–1.36) | Reference |
| Model 2 | 1.27 (0.94–1.73) | 1.12 (0.85–1.48) | 1.03 (0.80–1.34) | 1.02 (0.79–1.32) | Reference |
Model 1: age, sex, race/center (overall model) or center (race-stratified models). Model 2: model 1 + education, physical activity, smoking status, body mass index.
Bold values indicate P < 0.05.
Figure 1.
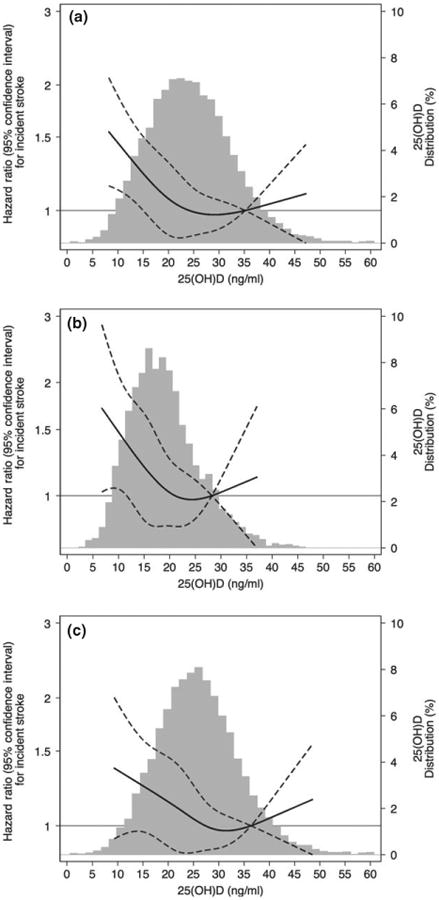
Adjusted [model is adjusted for age, sex, race/center (overall models) or center (race-stratified models), education, physical activity, smoking status, body mass index] restricted cubic spline model showing the hazard ratios (95% confidence intervals) for the association of 25(OH)D with incident stroke overall (a) and in blacks (b) and whites (c). Follow-up 1990–1992 through 2011. The solid line represents the hazard ratios and the dashed lines represent the 95% confidence intervals. Knots at 5th, 35th, 65th and 95th percentiles. Restricted cubic spline centered at the 90th percentile and truncated at 1st and 99th percentile of 25(OH)D. Histogram shows the distribution of concentrations of 25(OH)D.
DBP polymorphism frequencies varied by 25(OH)D level and by race (Table S1). TG/GG genotype frequencies for rs7041 were lower amongst those with lower concentrations of 25(OH)D, whereas AC/AA genotype frequencies for rs4588 were higher amongst those with lower concentrations of 25(OH)D. Overall, TG/GG genotypes for rs7041 were seen in 30% of blacks and 81% of whites and AC/AA genotypes for rs4588 were seen in 20% of blacks and 48% of whites. rs7041 and rs4588 were not significantly associated with incident stroke when analyzed as main effects (Table S3). Compared to those with 25(OH) D ≥ 17.2 ng/ml and either rs7041 TT genotype or rs4588 CC genotype, those with 25(OH)D < 17.2 ng/ml were at higher risk for stroke regardless of geno-type. However, there was some weak evidence of increased risk of stroke amongst those with 25(OH) D < 17.2 ng/ml and rs7041 TG/GG genotype versus TT genotype [TG/GG HR = 1.29 (1.00–1.67) vs. TT HR = 1.19 (0.94–1.52), P interaction 0.28] (Fig. 2a) and amongst those with 25(OH)D < 17.2 ng/ml and rs4588 CA/AA genotype versus CC genotype [CA/AA HR = 1.37 (1.07–1.74) vs. CC HR = 1.14 (0.91–1.41), P interaction 0.11] (Fig. 2b) in models adjusted for demographic/behavioral/socioeconomic factors. Similar results were seen in sensitivity analyses using an additive genetic model for rs7041 and rs4588. Similar results were also seen in analyses using haplotypes (P interaction 0.16).
Figure 2.
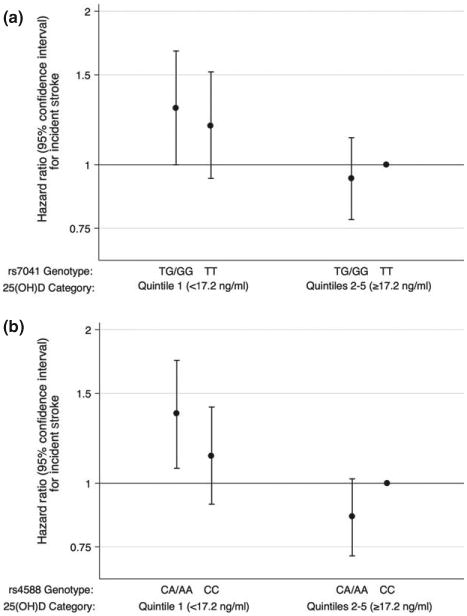
Adjusted (model is adjusted for age, sex, race/center, education, physical activity, smoking status, body mass index) hazard ratios (95% confidence intervals) for the association of 25(OH)D with incident stroke overall stratified by DBP rs7041 (a) and by rs4588 (b). Follow-up 1990–1992 through 2011. Participants with DBP rs7041 TT genotype and higher quintiles (Q2–Q5) of 25(OH)D are the reference group in (a). Participants with DBP rs4588 CC genotype and higher quintiles (Q2–Q5) of 25(OH)D are the reference group in (b).
Discussion
In this community-based middle-aged sample of white and black adults, lower compared with higher serum concentrations of 25(OH)D were associated with greater incident stroke over approximately 20 years of follow-up. This association was similar by race but there was suggestive evidence, albeit not statistically significant, that associations between low 25(OH)D and incident stroke were stronger amongst participants genetically predisposed to higher serum DBP (i.e. those with presence of the rs7041 G allele or the rs4588 A allele).
Our study is consistent with previous studies showing an association between low concentrations of 25 (OH)D and stroke [2–4]. In contrast to a prior study [6], no difference in this relationship by race was seen. However, some weak evidence for effect modification by DBP genetic polymorphisms was observed. Lower 25(OH)D levels were associated with a slightly higher risk of stroke amongst those with rs7041 TG/GG versus TT genotype and with rs4588 AC/AA versus CC genotype. Individuals with an rs7041G allele (versus a T allele) and individuals with an rs4588 A allele (versus a C allele) have been shown to have higher DBP levels and therefore lower levels of bioavailable 25 (OH)D for a given 25(OH)D level [5]. Our results for both SNP rs7041 and rs4588 suggest that those with genotypes that may reflect higher DBP in the setting of low 25(OH)D concentration, probably indicative of lower bioavailable 25(OH)D, had increased risk of stroke compared to those with genotypes reflecting lower DBP.
Certain limitations should be taken into consideration in the interpretation of this study. First, there was only a single measurement of 25(OH)D, which has been shown to vary over time within individuals [20–22], but 25(OH)D concentrations were adjusted for seasonal change. Secondly, serum DBP concentrations were not measured and it was therefore not possible to estimate bioavailable vitamin D. However, associations and effect modification by DBP polymorphisms rs7041 and rs4588 were examined, but these analyses have limited power. Our study also has a number of strengths, including a large bi-racial population, comprehensive assessment of confounders, physician adjudicated stroke events using standardized criteria, and approximately 20 years of follow-up.
In conclusion, in this community-based sample of middle-aged whites and blacks, it was found that lower 25(OH)D was associated with increased incidence of stroke. Individuals with low 25(OH)D who are genetically predisposed to higher DBP (rs7041 G allele, rs4588 A allele), and who therefore have lower predicted bioavailable 25(OH)D, may be at greater risk for stroke, although our results were not conclusive and should be interpreted as hypothesis generating. Further studies on the association of bioavailable vitamin D and DBP with incident stroke are warranted.
Supplementary Material
Table S1. Participant characteristics by race and 25 (OH)D quintile, ARIC visit 2 (1990–1992).
Table S2. Adjusted hazard ratios (95% confidence intervals) for incident ischaemic stroke and for incident hemorrhagic stroke by 25(OH)D quintile overall; follow-up 1990–1992 through 2011.
Table S3. Adjusted hazard ratios (95% confidence intervals) for incident stroke by vitamin D binding protein polymorphism status; follow-up 1990–1992 through 2011.
Acknowledgments
The authors thank the staff and participants of the ARIC study for their important contributions. This research was also supported by grants from the NIH/NHLBI (R01HL103706 to Dr Lutsey), the NIH Office of Dietary Supplements (R01HL103706-S1 to Dr Lutsey) and the NIH/NIDDK (R01DK089174 to Dr Selvin). Genotyping was supported through the NHLBI CARe (Candidate Gene Resource) grant N01HC65226. Dr Schneider was supported by NIH/NHLBI training grant T32HL007024 and Dr Michos was supported by NIH/NINDS grant R01NS072243. The Atherosclerosis Risk in Communities study is carried out as a collaborative study supported by National Heart, Lung, and Blood Institute contracts (HHSN268201100005C, HHS N268201100006C, HHSN268201100007C, HHSN2682 01100008C, HHSN268201100009C, HHSN2682011000 10C, HHSN268201100011C and HHSN26820110001 2C).
Footnotes
Disclosure of conflicts of interest: The authors declare no financial or other conflicts of interest.
Supporting Information: Additional Supporting Information may be found in the online version of this article:
References
- 1.Holick MF. Vitamin D deficiency. N Engl J Med. 2007;357:266–281. doi: 10.1056/NEJMra070553. [DOI] [PubMed] [Google Scholar]
- 2.Wang L, Song Y, Manson JE, et al. Circulating 25-hydroxy-vitamin D and risk of cardiovascular disease: a meta-analysis of prospective studies. Circ Cardiovasc Qual Outcomes. 2012;5:819–829. doi: 10.1161/CIRCOUTCOMES.112.967604. [DOI] [PMC free article] [PubMed] [Google Scholar]
- 3.Brondum-Jacobsen P, Nordestgaard BG, Schnohr P, Benn M. 25-Hydroxyvitamin D and symptomatic ischemic stroke: an original study and meta-analysis. Ann Neurol. 2013;73:38–47. doi: 10.1002/ana.23738. [DOI] [PubMed] [Google Scholar]
- 4.Chowdhury R, Stevens S, Ward H, Chowdhury S, Sajjad A, Franco OH. Circulating vitamin D, calcium and risk of cerebrovascular disease: a systematic review and meta-analysis. Eur J Epidemiol. 2012;27:581–591. doi: 10.1007/s10654-012-9729-z. [DOI] [PubMed] [Google Scholar]
- 5.Powe CE, Evans MK, Wenger J, et al. Vitamin D-binding protein and vitamin D status of black Americans and white Americans. N Engl J Med. 2013;369:1991–2000. doi: 10.1056/NEJMoa1306357. [DOI] [PMC free article] [PubMed] [Google Scholar]
- 6.Michos ED, Reis JP, Post WS, et al. 25-Hydroxyvitamin D deficiency is associated with fatal stroke among whites but not blacks: the NHANES-III linked mortality files. Nutrition. 2012;28:367–371. doi: 10.1016/j.nut.2011.10.015. [DOI] [PMC free article] [PubMed] [Google Scholar]
- 7.Robinson-Cohen C, Hoofnagle AN, Ix JH, et al. Racial differences in the association of serum 25-hydroxyvitamin D concentration with coronary heart disease events. JAMA. 2013;310:179–188. doi: 10.1001/jama.2013.7228. [DOI] [PMC free article] [PubMed] [Google Scholar]
- 8.Scragg R, Sowers M, Bell C Third National Health and Nutrition Examination Survey. Serum 25-hydroxyvitamin D, diabetes, and ethnicity in the Third National Health and Nutrition Examination Survey. Diabetes Care. 2004;27:2813–2818. doi: 10.2337/diacare.27.12.2813. [DOI] [PubMed] [Google Scholar]
- 9.Reis JP, Michos ED, von Muhlen D, Miller ER., 3rd Differences in vitamin D status as a possible contributor to the racial disparity in peripheral arterial disease. Am J Clin Nutr. 2008;88:1469–1477. doi: 10.3945/ajcn.2008.26447. [DOI] [PubMed] [Google Scholar]
- 10.Powe CE, Ricciardi C, Berg AH, et al. Vitamin D-binding protein modifies the vitamin D–bone mineral density relationship. J Bone Miner Res. 2011;26:1609–1616. doi: 10.1002/jbmr.387. [DOI] [PMC free article] [PubMed] [Google Scholar]
- 11.Johnsen MS, Grimnes G, Figenschau Y, Torjesen PA, Almas B, Jorde R. Serum free and bio-available 25-hydroxyvitamin D correlate better with bone density than serum total 25-hydroxyvitamin D. Scand J Clin Lab Invest. 2014;74:177–183. doi: 10.3109/00365513.2013.869701. [DOI] [PubMed] [Google Scholar]
- 12.Bhan I, Powe CE, Berg AH, et al. Bioavailable vitamin D is more tightly linked to mineral metabolism than total vitamin D in incident hemodialysis patients. Kidney Int. 2012;82:84–89. doi: 10.1038/ki.2012.19. [DOI] [PMC free article] [PubMed] [Google Scholar]
- 13.Wang X, Cheng S, Brophy VH, et al. A meta-analysis of candidate gene polymorphisms and ischemic stroke in 6 study populations: association of lymphotoxin-alpha in nonhypertensive patients. Stroke. 2009;40:683–695. doi: 10.1161/STROKEAHA.108.524587. [DOI] [PMC free article] [PubMed] [Google Scholar]
- 14.ARIC Study Investigators. The Atherosclerosis Risk in Communities (ARIC) study: design and objectives. Am J Epidemiol. 1989;129:687–702. [PubMed] [Google Scholar]
- 15.Gindler EM, Heth DA. Colorimetric determination with bound “calmagite” of magnesium in human blood serum. Clin Chem. 1971;17:662. [Google Scholar]
- 16.Musunuru K, Lettre G, Young T, et al. Candidate gene association resource (CARe): design, methods, and proof of concept. Circ Cardiovasc Genet. 2010;3:267–275. doi: 10.1161/CIRCGENETICS.109.882696. [DOI] [PMC free article] [PubMed] [Google Scholar]
- 17.Rosamond WD, Folsom AR, Chambless LE, et al. Stroke incidence and survival among middle-aged adults: 9-year follow-up of the Atherosclerosis Risk in Communities (ARIC) cohort. Stroke. 1999;30:736–743. doi: 10.1161/01.str.30.4.736. [DOI] [PubMed] [Google Scholar]
- 18.Baecke JA, Burema J, Frijters JE. A short questionnaire for the measurement of habitual physical activity in epidemiological studies. Am J Clin Nutr. 1982;36:936–942. doi: 10.1093/ajcn/36.5.936. [DOI] [PubMed] [Google Scholar]
- 19.Pugliese G, Solini A, Bonora E, et al. The Chronic Kidney Disease Epidemiology Collaboration (CKD-EPI) equation provides a better definition of cardiovascular burden associated with CKD than the Modification of Diet in Renal Disease (MDRD) Study formula in subjects with type 2 diabetes. Atherosclerosis. 2011;218:194–199. doi: 10.1016/j.atherosclerosis.2011.04.035. [DOI] [PubMed] [Google Scholar]
- 20.Kasahara AK, Singh RJ, Noymer A. Vitamin D (25OHD) serum seasonality in the United States. PLoS One. 2013;8:e65785. doi: 10.1371/journal.pone.0065785. [DOI] [PMC free article] [PubMed] [Google Scholar]
- 21.Jorde R, Sneve M, Hutchinson M, Emaus N, Figenschau Y, Grimnes G. Tracking of serum 25-hydroxyvitamin D levels during 14 years in a population-based study and during 12 months in an intervention study. Am J Epidemiol. 2010;171:903–908. doi: 10.1093/aje/kwq005. [DOI] [PubMed] [Google Scholar]
- 22.Berger C, Greene-Finestone LS, Langsetmo L, et al. Temporal trends and determinants of longitudinal change in 25-hydroxyvitamin D and parathyroid hormone levels. J Bone Miner Res. 2012;27:1381–1389. doi: 10.1002/jbmr.1587. [DOI] [PMC free article] [PubMed] [Google Scholar]
Associated Data
This section collects any data citations, data availability statements, or supplementary materials included in this article.
Supplementary Materials
Table S1. Participant characteristics by race and 25 (OH)D quintile, ARIC visit 2 (1990–1992).
Table S2. Adjusted hazard ratios (95% confidence intervals) for incident ischaemic stroke and for incident hemorrhagic stroke by 25(OH)D quintile overall; follow-up 1990–1992 through 2011.
Table S3. Adjusted hazard ratios (95% confidence intervals) for incident stroke by vitamin D binding protein polymorphism status; follow-up 1990–1992 through 2011.