

Abstract
Background
Sleep fragmentation during late gestation (LG-SF) is one of the major perturbations associated with sleep apnea and other sleep disorders during pregnancy. We have previously shown that LG-SF induces metabolic dysfunction in offspring mice during adulthood.
Objectives
To investigate the effects of late LG-SF on metabolic homeostasis in offspring and to determine the effects of LG-SF on the epigenome of visceral white adipose tissue (VWAT) in the offspring.
Methods
Time-pregnant mice were exposed to LG-SF or control sleep (LG-SC) conditions during the last 6 days of gestation. At 24 weeks of age, lipid profiles and metabolic parameters were assessed in the offspring. We performed large-scale DNA methylation analyses using MeDIP coupled to microarrays (MeDIP-chip) in VWAT of 24-week-old LG-SF and LG-SC offspring (n=8 mice/group). Univariate multiple-testing adjusted statistical analyses were applied to identify differentially methylated regions (DMRs) between the groups. DMRs were mapped to their corresponding genes, and tested for potential overlaps with biological pathways and gene networks.
Results
We detected significant increases in body weight (31.7 vs. 28.8 g; p=0.001), visceral (642.1 vs. 497.0 mg; p=0.002) and subcutaneous (293.1 vs. 250.1 mg; p=0.001) fat mass, plasma cholesterol (110.6 vs. 87.6 mg/dL; p=0.001), triglycerides (87.3 vs. 84.1 mg/dL; p=0.003) and HOMA-IR values (8.1 vs. 6.1; p=0.007) in the LG-SF group. MeDIP analyses revealed that 2148 DMRs (LG-SF vs. LG-SC; p< 0.0001, MAT algorithm). A large proportion of the DMR-associated genes have reported functions that are altered in obesity and metabolic syndrome, such as Cartpt, Akt2, Apoe, Insr1, etc. Overrepresented pathways and gene networks were related to metabolic regulation and inflammatory response.
Conclusions
Our findings show a major role for epigenomic regulation of pathways associated with metabolic processes and inflammatory response in VWAT. LG-SF-induced epigenetic alterations may underlies increases in the susceptibility to obesity and metabolic syndrome in offspring.
Introduction
Two-thirds of women in the United States are currently overweight or obese at the time of conception (1). Gestational sleep disorders are highly prevalent during late gestation (2, 3) and their occurrence is increased obese women (4, 5). Importantly, gestational sleep disorders may result in altered developmental trajectories (6), as well as long-term consequences in the offspring that may last until adulthood (7, 8). Gestational sleep disorders include restricted sleep duration, fragmented sleep, snoring, and especially obstructive sleep apnea (OSA). OSA is characterized by repetitive obstructions of the upper airway during sleep that result in sleep fragmentation (SF) as well as gas exchange abnormalities (9, 10). In general, OSA, and more specifically SF, promote obesogenic phenotypes, elicit changes in insulin sensitivity, and increase the risk for metabolic syndrome (11, 12).
Recent findings suggest an association between OSA and an increased risk for insulin resistance in pregnant women (13). Intrauterine and early postnatal environments have a significant long-term influence on body weight, energy homeostasis and metabolic function in offspring (14). Offspring of rats exposed to a model of OSA exhibit lower birth-weight and an increased propensity for accelerated body weight accrual later in life (15). Similarly, infants born to snoring mothers are more likely to have small for gestational age infants a well as higher risk for perinatal complications (16-18). Despite increasing experimental evidence, the mechanisms for the origin and reversal of metabolic consequences of gestational sleep alterations remain to be elucidated.
More than 20 years ago, Hales and Barker proposed the “thrifty phenotype” hypothesis, whereby poor nutrition in early life produces permanent changes in the glucose-insulin metabolic homeostatic pathways, and potentially results in poor fetal and infant growth and subsequent development of type-2 diabetes and metabolic syndrome (19). Initial observations indicated that early environmental exposures, such as gestational hyperglycemia, maternal obesity and overfeeding during pregnancy, epigenetically alter the programming of genes resulting in a long-term imprint on gene expression that lasts into adulthood (20-23). Epigenetic processes explain the decreases in selective aspect of cellular plasticity by the establishment of cell-specific epigenomes during development (24) and are responsible for transgenerational inheritance in several complex traits (25).
Precursor cells from different VWAT depots (visceral, subcutaneous) differ in their capacity to replicate and differentiate, and adipocytes differentiated from these cells display discrete metabolic (26) and genetic profiles (27) in vitro. Depot-specific characteristics are retained in adipocytes and can be transferred to subsequent daughter cells for up to forty generations (28). Changes in DNA methylation have also been observed during adipogenesis (29). This raises the possibility that the epigenome in VWAT is not merely a static, inherited state, but also a highly dynamic regulator of cellular differentiation which can be influenced by external stimuli. In previous studies, we found evidence suggesting that offspring of pregnant mice exposed to either late gestational high fat diet (23) or late gestational SF are more likely to accrue higher body weight (7). Furthermore, the expression of the gene encoding for adiponectin (Adipoq) was significantly reduced in VWAT samples of SF offspring compared to those from sleep control (SC) mothers, correlating with epigenetics marks (7). Based on the intriguing findings revolving around a single gene and locus levels, we here explored how late gestational SF (LG-SF) affects whole DNA methylation profiles in VWAT samples in the offspring.
Materials and Methods
Animals and gestational SF exposures
All experimental procedures were approved by The Institutional Animal Care and Use Committee (IACUC) at the University of Chicago. Timed pregnant C57BL/6J female mice were obtained from a commercial supplier (Jackson Laboratory, Bar Harbor, ME). All mice were allowed access to food and water ad libitum, and received standard chow containing 10 kcal% fat (Research Diet, New Brunswick) throughout the experiments. Pregnant mice were maintained in custom-made cages operated under a 12-hour light-dark cycle (7:00 AM to 7:00 PM) and exposed to SF, from 15 days post coitus (dpc) until delivery. A commercially-available device developed in our laboratory (Lafayette Instruments, cat# Model 80391; Lafayette, IN) was used to induce SF in mice as previously described (23, 30). After birth, litters were culled to 6 mice with equal distributions of sexes when possible (estimate of 8 male and 8 female offspring per experimental condition), and allowed to breastfeed under normal conditions until weaning at postnatal day 21. After weaning, mice were fed with normal chow diet as above. The reported sample set in this study (n=8 mice per group) represents a subset of randomly selected male mice out the data set previously reported (n=24 mice per group) in (23).
Phenotype assessments
Phenotypic and metabolic profiles were assessed at 24 weeks of age. Previous time-course experiments revealed that LG-SF offspring displayed significant phenotypic (i.e. body weight and food consumption) starting in early adulthood (i.e. week 20 onwards) and by 24 weeks exhibited the full metabolic phenotype (i.e. increase in insulin resistance) (23). Body weight and food consumption were measured weekly. At 24 weeks of age, animals were euthanized and visceral fat was carefully dissected by a blinded investigator. Blood samples were collected from the 3-hour fasted offspring mice, and lipid profiles and glucose and insulin levels were assessed.
DNA methylation profiling
DNA was isolated from epididymal VWAT using DNeasy Tissue kit (Qiagen, Valencia, CA) and quantified on a Nanodrop 2000 (NanoDrop products, Wilmington, DE). Isolated DNA was stored at -20 °C until use. The methylated fraction of the genome was immunoprecipitated using the MeDIP protocol (31). Immunoprecipitated DNA was amplified using an adaptor mediated PCR strategy, as described elsewhere (32) and subsequently fragmented, biotin-labeled, and hybridized on Affymetrix GeneChip Mouse Promoter Array 1.0R (Affymetrix, Santa Clara, CA) and scanned, according to manufacturer’s protocol. The array consisted of over 4.6 million probes tiled to interrogate over 28,000 mouse promoter regions. Probes in the microarray were tiled at an average resolution of 35 base pairs, as measured from the central position of adjacent 25-mer oligos, leaving a gap of approximately 10 base pairs between probes. Each promoter region covered approximately 6 kb upstream through 2.5 kb downstream of 5’ transcription start sites.
Microarray data analysis
Raw data of the tilling array experiments (.cel files) were imported into Partek® Genomic Suite® Software, version 6.6 (Partek Inc., St. Louis, MO, USA) and pre-processed with probe sequence adjustment, Robust Multichip Averaging (RMA) (33) background correction, quantile normalization and log2 transformation. Multidimensional scaling (MDS) analysis was performed to examine the relationship between samples and identify potential outliers that might affect the data. Signals of 4.1 million probes were compared between the LG-SF and LG-SC groups using ANOVA and t-statistic was calculated for each probe. The Model-based Analysis of Tilling-arrays (MAT) (34) algorithm was used to detect differentially methylated regions (DMRs) at a sliding window of fixed genomic length (500 bp), requiring at least 10 probes present in a window. MAT score of each window was generated using the trimmed mean of probe t-statistics, which is calculated by taking the average of all probes within a window excluding 10% of the highest and lowest probes. Windows at p value < 0.0001 were extracted, merged and reported as significant DMRs. DMRs with positive and negative MAT scores represent hyper- and hypo-methylated regions in the LG-SF group as compared to LG-SC, respectively. Regions supported by less than 80% of the probes were removed from further analysis. The detected DMRs were then annotated for nearby genes and promoters by comparing genomic coordinates of the probes with RefSeq transcript annotation (release date 07/30/2014) of mouse reference genome assembly mm8 (NCBI build 36). The probe locations were obtained from the array’s annotation file. Gene promoter was defined as the region between 1.5 kb upstream and 0.5 kb downstream of a transcription start site (TSS). DMRs located in the promoter region were extracted and used for heatmap generation with samples on the row and DMRs on the column. Networks and pathways significantly enriched in the genes of interest were identified through Ingenuity Pathways Analysis (IPA) (Ingenuity® Systems, www.ingenuity.com). The probe signals and DMRs were visualized on the University of California at Santa Cruz (UCSC) genome browser as custom tracks (.bigwig and .bed files). Statistical analysis were further performed using R statistical environment (version 3.0.2) (35). The data generated in this study have been deposited in the NCBI’s Gene Expression Omnibus (GEO) with accession number GSE63208.
Single locus analysis of the Pparg locus by MeDIP-qPCR
Microarray data at the Pparg locus were verified by SYBR-green based real-time PCR analysis of the adaptor-mediated PCR products from the MeDIP samples (LG-SF and LG-SC groups). PCR products were purified using the MinElute kit (Qiagen) and quantified using the Nanodrop 2000. Twenty nanograms of purified amplicon were subjected to real-time PCR. The reaction consisted of 1× ABI master mix containing Taq polymerase, dNTPs, SYBR green dye and ROX as passive dye (Life Technologies, Carlsbad, CA, USA) and 200 nM of specific primers (Supplementary Material Table S1). The PCR program started with a Taq polymerase activation step (10 min at 95°C) followed by 40 cycles at 95°C for 15 s, 60°C for 1 min and 95°C for 15 s. Data analyses were performed using the 7500 System SDS software version 1.4 (Applied Biosystems). A fragment within the Actb locus was used as calibrator. Adaptor-mediated PCR products from the input fractions were used as reference to calculate the IP/INPUT enrichment for the target (IP/IN target) and the calibrator (IP/IN calibrator) loci. Fold change enrichment (FCE) was calculated using the equation: FCE=2ˆ-(IP/IN target- IP/IN calibrator).
Results
Metabolic consequences of gestational SF exposure in the offspring
We first verified that the previously described phenotypic and metabolic features of the offspring mice included in this study were recapitulated at 24 weeks after birth, as previously described (Table 1; (23)). Indeed, offspring of mothers exposed to late gestational SF (LG-SF group) had significantly higher body weight (n=8, mean weight = 31.7 ± 1.2 g) than those from sleep controls (LG-SC group) (n=8, mean weight = 28.8 g ± 0.9 g; p=0.001, t-test). Moreover, significant differences emerged in both visceral (mean weight: LG-SF= 642.1 ± 7.8 mg; LG-SC= 497.0 ± 6.9 mg; p=0.002, t-test) and subcutaneous adipose tissues (mean weight: LG-SF= 293.1 ± 8.6 mg; LG-SC= 250.1 ± 6.8 mg; p=0.001, t-test). In addition, elevated plasma lipid levels emerged in the LG-SF offspring group as evidenced by triglycerides (LG-SF=98.9 ± 6.8 mg/dL and LG-SC=72.9 ± 1.8 mg/dL; p=0.005, t-test), and total cholesterol levels (LG-SF=104.9 ± 4.1 mg/dL and LG-SC=86.9 ± 2.7 mg/dL; p=0.007, t-test). Similarly, fasting Homeostatic Model Assessment – Insulin Resistance (HOMA-IR) revealed increased values in the LG-SF group compared to the LG-SC group (mean HOMA-IR values: LG-SF= 8.1 ± 0.6 and LG-SC=6.1 ± 0.9; p=0.007, t-test).
Table 1.
Body weight, fat mass and metabolic parameters for LG-SC and LG-SF offspring at 24 weeks of age.
| LG-SF (n=8) | LG-SC (n=8) | p-value1 | |
|---|---|---|---|
| Body weight | 31.7 ± 1.2 g | 28.8 ± 0.9 g | 0.001 |
| Visceral fat | 642.1 ± 7.8 mg | 497.0 ± 6.9 mg | 0.002 |
| Subcutaneous fat | 293.1 ± 8.6 mg | 250.1 ± 6.8 mg | 0.001 |
| Triglycerides | 98.9 ± 6.8 mg/dL | 72.9 ± 1.8 mg/dL | 0.005 |
| Cholesterol | 104.9 ± 4.1 mg/dL | 86.9 ± 2.7 mg/dL | 0.007 |
| HOMA-IR | 8.1 ± 0.6 | 6.1 ± 0.9 | 0.007 |
t-test LG-SC vs. LG-SF
Large-scale epigenetic profiling in adipose tissue samples of offspring of SF-exposed mothers
We investigated how LG-SF affects the VWAT epigenome in the offspring using MeDIP-chip in VWAT samples of 24 week old offspring of the LG-SF and LG-SC groups (n=8 mice per group). Microarray data underwent extensive quality control. Quantile normalization with correction for probe sequence resulted in homogenous distribution of the microarray signal (Figure S1), and enabled the unbiased detection of DNA methylation differences between the LG-SF and LG-SC groups. All microarrays (n=16) passed technical quality control, without the need to exclude any of the data from downstream analysis. Based on the full set of probes in the microarray (n=4,103,551 probes), samples from the same groups showed higher correlation coefficients (Figure 1A) and clustered together in Principal Component Analysis (PCA) (Figure 1B). We detected 45,756 probes differentially methylated probes between the groups (p-value < 0.01; two-way ANOVA), with 25,258 and 20,498 probes showing increased DNA methylation in the LG-SF and LG-SC groups, respectively (Figure 1C). Next, we defined differentially methylated regions (DMRs) between the groups by combining adjacent probes showing statistically significant differential DNA methylation using the MAT algorithm (34) and the criteria detailed in Materials and Methods. We identified 2,148 DMRs (Figure 2A and Table S2). Of these, 497 and 1,651 DMRs showed higher DNA methylation in the LG-SF or LG-SC groups, respectively.
Figure 1. Microarray probe-level analysis of VWAT samples.
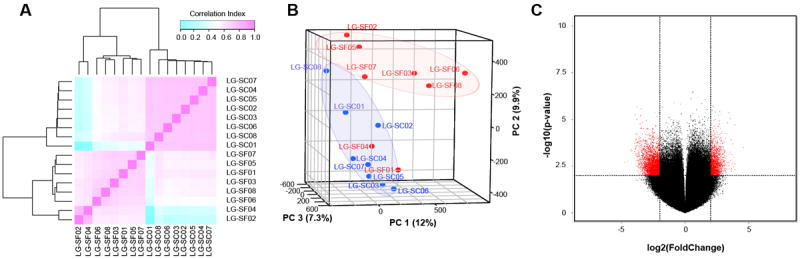
A) Pairwise sample correlation heatmap. Probes with p-value < 0.01 were extracted from the ANOVA results and used for calculating Pearson’s correlation coefficient between samples. Bi-dimensional unsupervised clustering was performed in samples from the LG-SF and LG-SF groups. Correlation coefficients are shown as a color gradient ranging from light blue (0.0) over white (0.5) to light pink (1.0). B) Multiple dimensional scaling (MDS) plot of sample relationships. Principal component analysis (PCA) was performed using microarray data from LG-SF (red points) and LG-SC (blue points) samples. Samples from the same group clustered together. Three principal components determine sample clustering: PC1 (12%, x-axis), PC2 (9.9%, y-axis) and PC3 (7.3%, z-axis). C) Volcano plot of microarray data. The x-axis represents fold changes differences between the groups, with coefficients expressed in the log2 scale. Samples with increased microarray signals in LG-SF and LG-SC groups had positive and negative coefficients, respectively. Probes showing differentially methylated values are shown in red. The y-axis represents the -log10-transformed p-values. The horizontal dashed red line depicts the cut-off values for the p-value (-log10(p< 0.05)=1.3). The vertical dashed red lines depict the cut-off values for the fold changes (log2(4)=2).
Figure 2. Differentially methylated regions between LG-SF and LF-SC groups.
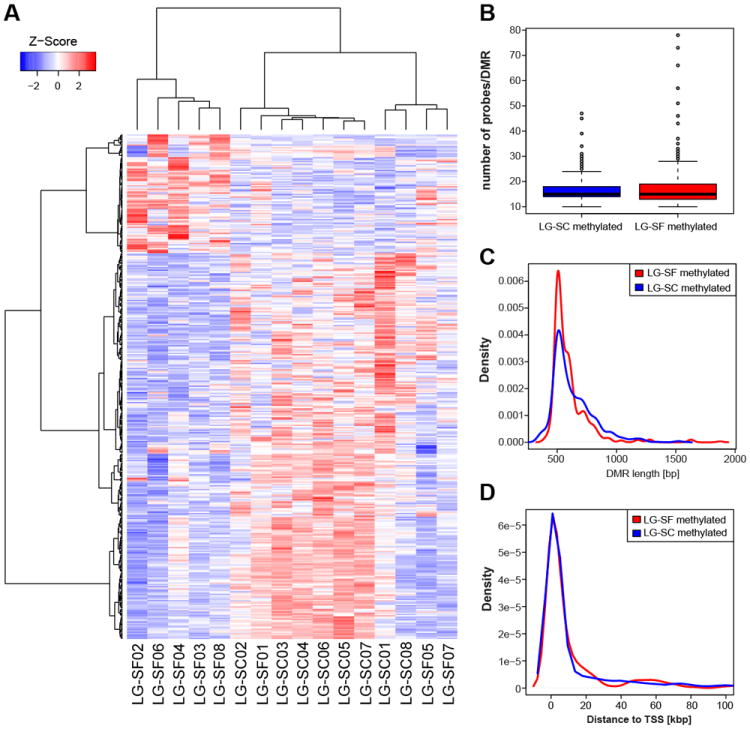
A) Unsupervised clustering of samples in the LG-SF and LG-SC groups based on DMR values. Samples are accommodated in columns and DMRs in rows. Z-score depicting the DNA methylation differences between the groups (DMRs with increased DNA methylation in LG-SF and LG-SC groups had positive and negative values, respectively) are shown in a color gradient ranging from blue (negative Z-scores) to red (positive scores). B) The number of probes per DMR did not differ between DMRs with increasing DNA methylation in the LG-SF (red box) and LG-SC (blue box) groups (p-value = 0.075, Wilcoxon rank sum test). C) Density plot of DMR lengths. DMRs with higher methylation in the LG-SF group were significantly shorter than those with higher methylation in the LG-SC group (p=0.003, Wilcoxon rank sum test). D) Distance to TSS did not differ significantly between DMRs higher methylated in the LG-SF and LG-SC groups (p=0.601; Wilcoxon rank sum test). The distance from the beginning of each region to the closest TSS are shown in the X-axis. Red and blue lines represent the LG-SF and LG-SC groups, respectively.
We did not detect significant differences in number of probes per DMR (16.4 ± 0.2 and 16.9 ± 0.2 probes, respectively; p>0.05, Wilcoxon rank sum test) between DMRs with higher methylation in the LG-SF or LG-SC groups (Figures 2B). DMRs with higher methylation in the LG-SF group were significantly shorter than those with higher methylation in LG-SC (598.1 ± 7.2 and 629.6 ± 4.3 nucleotides; p<0.001, Wilcoxon rank sum test; Figure 2C). Among the DMRs, 1,977 were associated to annotated transcripts (490 and 1,487 DMRs associated to highly methylated DMRs in the LG-SF and LG-SC groups, respectively), with 1,861 (455 and 1,406) being associated to mRNA transcripts, and 116 (35 and 81) to non-coding RNAs (ncRNA). No significant differences emerged in the distribution of the distance to the TSS between DMRs with higher methylation in the LG-SF (n=497; mean distance to TSS=39,850.86 ± 5,690.51 bp) and the LG-SC groups (n=1,651; mean distance to TSS=44,267.49± 3,766.50 bp; p=0.601; Wilcoxon rank sum test; Figure 2D).
Genes associated to DMRs between LG-SF and LG-SC groups have functions related to obesity and metabolic syndrome
Selected DMRs (p< 0.0001, two-ways ANOVA) were associated to 1,412 genes, of which 351 and 1,061 genes were associated to DMRs with higher methylation in the LG-SF and LG-SC groups, respectively (Table S2). Many of the DMR-associated genes were reported as involved in metabolic pathways related to the establishment of obesogenic phenotypes and the development of metabolic syndrome. Among them, we detected a DMRs located 4 kb upstream of the TSS for the transcript variant 1 of the Pparg gene displaying higher methylation in the LG-SF group (Figure 3). There are two major annotated transcripts for this gene (36). The transcript variant 1 (NM_001127330.1) is expressed in liver and other tissues, whereas the transcript variant 2 (NM_011146.3) is expressed exclusively in adipose tissue (37). To verify the microarray findings and to further determine how LG-SF influences the DNA methylation profile of the Pparg transcripts, we studied 6 regions of interest (ROI) by MeDIP-qPCR analysis. ROIs were located at the DMR detected by the microarray (ROI1), a putative enhancer 600 bp upstream of the transcript variant 1 TSS (ROI2), within a CpG island containing the transcript variant 1 TSS (ROI3), and 2 kbp, 1 kbp and 100 bp upstream of the TSS for the transcript variant 2 (ROI4, ROI5 and ROI6, respectively; Figure 3A). In concordance with the microarray results, ROI1 region showed significantly increased DNA methylation (p<0.05, t-test) in LG-SF group compared to then LG-SC group (mean fold change enrichment (mFCE): LG-SC=3.69±0.48, LG-SF=19.45 ±3.34). Moreover, we found significantly increased DNA methylation in LG-SF group in ROI3 (mFCE: LG-SC=3.48±0.51, LG-SF=16.29 ±2.82), ROI5 (mFCE: LG-SC=3.14±0.29, LG-SF=18.23 ±2.82) and ROI6 (mFCE: LG-SC=3.72±0.61, LG-SF=17.69 ±2.98). Increased DNA methylation differences also emerged in ROI2 (mFCE: LG-SC=3.31±0.47, LG-SF=12.69±2.76) and ROI4 (mFCE: LG-SC=3.55±0.49, LG-SF=16.89±3.28), although the differences did not reach statistical significance (p>0.05, t-test)
Figure 3. Single locus analysis: DNA methylation differences at Pparg locus.
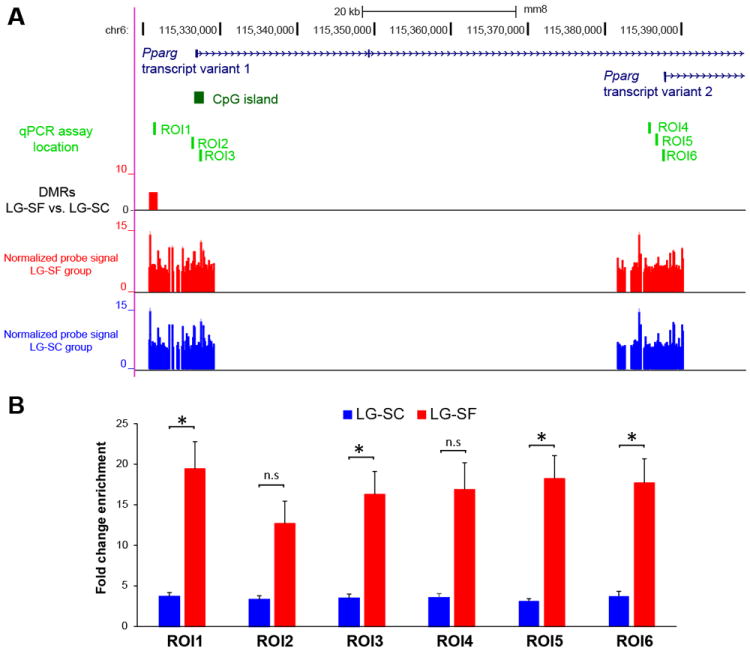
A) Genome browser images showing the location of the DMRs, transcript variants for the Pparg gene and the location of the qPCR assays. Transcript variants for the Pparg gene are shown in dark blue. CpG island at the 5’-end of the transcript variant 1 is shown in dark green. The location of single-locus MeDIP-qPCR assays (ROI1-6) are shown as light green boxes. A DMR at 4 kbp upstream of the transcript variant 1 showing higher DNA methylation in the LG-SF group compared to the LG-SC group is shown as a red box. Normalized probe signal values for the LG-SF and LG-SC groups are shown as red and blue bars, respectively. B) Single locus MeDIP-qPCR results for VWAT samples in LG-SF (red bars) and LG-SC (blue bars) groups in candidate regions (ROI1-6). Fold change enrichment (FCE) values are shown in the y-axis as mean. Error bars corresponds to SEM. *: p<0.05, t-test; n.s: non-significant (p>0.05).
Pathways and gene networks with a major role in lipid metabolism and inflammatory response
We created two lists of candidate genes that corresponded to DMRs showing higher DNA methylation in the LG-SF (n=92) and LG-SC (n=330) groups, respectively (Table S3) and used them as input in the Ingenuity Pathway Analysis software. Table 2 shows the top ten canonical pathways overrepresented in DMR associated gene with higher methylation in the LG-SF and LG-SC groups, respectively. The full list of overrepresented canonical pathways in each group is provided as Supplementary Material (Tables S4 and S5). Among the highest overrepresented canonical pathways those associated to molecular processes related to lipid metabolism and inflammatory response (i.e. PPARα/RXRα Activation, Protein Ubiquitination Pathway, Glycolysis and Gluconeogenesis, etc.) were particularly prominent. Next, we generated non-directional gene networks for candidate genes associated with higher methylation in LG-SF and LG-SC groups (Figure 4 A and B, respectively). The majority of the molecules included in both networks have reported activities in lipid metabolism and inflammatory response and are also associated to canonical pathways related to those functions. Very importantly, molecules that had the highest number of connections in each network (main nodes) were encoded by genes associated to DMRs showing statistically significant higher DNA methylation (i.e. TSS-associated CpG island at the Irs1 gene, Figure S2 A) or lower DNA methylation (i.e. CpG rich region upstream to TSS of the Apoe gene, Figure S2 B) in the LG-SF group compared to the LG-SC group. Lastly, we cross-referenced the lists of candidate genes associated with higher methylation in LG-SF and LG-SC groups to databases of molecules that are known to be involved in a particular type of toxicity or that are etiologically relevant in particular diseases. Among the lists corresponding to genes associated with DMRs with higher methylation in the LG-SF group (Table S6), we found those related to pro-inflammatory phenotypes in macrophages (i.e. PPARα/RXRα Activation, LPS/IL-1 Mediated Inhibition of RXR Function, etc.), and are related to progression of metabolic syndrome by controlling dyslipidemia, inflammation and glucose intolerance (38). In turn, among the lists corresponding to genes associated with DMRs with higher methylation in the LG-SC group (Table S7) we found genes and proteins associated with activation of the FXR/RXR heterodimer. The farnesoid X receptor (FXR) is a key regulator of numerous metabolic pathways, and plays a crucial role in linking bile acid regulation with lipoprotein, lipid and glucose metabolism, adipocyte differentiation and insulin sensitivity in pre-adypocytes (39, 40).
Table 2.
Top 10 canonical pathways overrepresented in genes associated with DMRs highly methylated in LG-SF and LG-SC groups.
| Higher methylation in LG-SF group | |||
|---|---|---|---|
|
| |||
| Canonical Pathways | p-value1 | Ratio2 | # molecules |
| Dopamine Receptor Signaling | 4.2 × 10⁻⁵ | 0.244 | 19 |
| Neuroprotective Role of THOP1 in Alzheimer’s Disease | 1.3 × 10⁻⁴ | 0.300 | 12 |
| Cardiac β-adrenergic Signaling | 2.8 × 10⁻⁴ | 0.188 | 25 |
| Tight Junction Signaling | 1.8 × 10⁻³ | 0.162 | 27 |
| PPARα/RXRα Activation | 2.5 × 10⁻³ | 0.156 | 28 |
| Protein Ubiquitination Pathway | 4.0 × 10⁻³ | 0.141 | 36 |
| Gαi Signaling | 4.7 × 10⁻³ | 0.167 | 20 |
| RhoGDI Signaling | 5.9 × 10⁻³ | 0.150 | 26 |
| Aryl Hydrocarbon Receptor Signaling | 6.5 × 10⁻³ | 0.157 | 22 |
| CDK5 Signaling | 6.5 × 10⁻³ | 0.172 | 17 |
|
| |||
| Higher methylation in LG-SC group | |||
|
| |||
| Canonical Pathways | p-value1 | Ratio2 | # molecules |
|
| |||
| Glycolysis I | 2.8 × 10⁻⁴ | 0.360 | 9 |
| Gluconeogenesis I | 2.8 × 10⁻⁴ | 0.360 | 9 |
| Urate Biosynthesis/Inosine 5’-phosphate Degradation | 1.0 × 10⁻³ | 0.429 | 6 |
| Purine Nucleotides Degradation II (Aerobic) | 1.6 × 10⁻³ | 0.350 | 7 |
| Dermatan Sulfate Degradation (Metazoa) | 2.3 × 10⁻³ | 0.375 | 6 |
| Heme Biosynthesis from Uroporphyrinogen-III I | 3.0 × 10⁻³ | 0.750 | 3 |
| Rapoport-Luebering Glycolytic Shunt | 3.0 × 10⁻³ | 0.750 | 3 |
| Axonal Guidance Signaling | 3.2 × 10⁻³ | 0.134 | 58 |
| Adenosine Nucleotides Degradation II | 3.3 × 10⁻³ | 0.353 | 6 |
| Role of BRCA1 in DNA Damage Response | 3.7 × 10⁻³ | 0.213 | 13 |
Fisher’s exact test right-tailed.
# DMR associated genes / # of genes in pathway.
Figure 4. Functional gene networks for DMR associated genes.
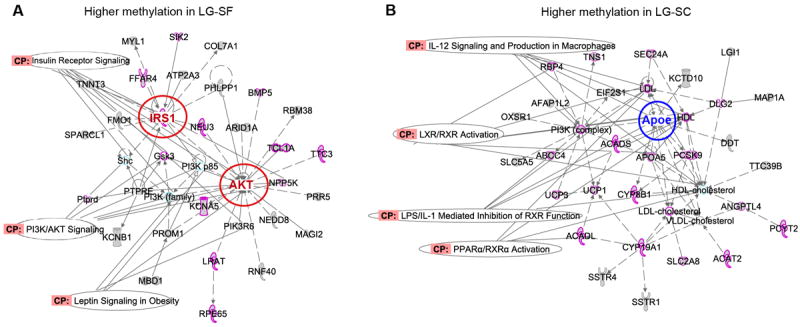
Gene network corresponding to genes associated to DMRs exhibiting higher DNA methylation in LG-SF (Panel A) and LG-SC (Panel B) groups. Networks were built using a bioinformatic tool (Ingenuity Pathway Analysis) based on databases relying on experimental evidence of gene functions. Molecules with a reported function in lipid metabolism and immune response are highlighted. Canonical pathways (CP) related to those functions are indicated with labels. Molecules in main nodes are colored in red and blue (for higher methylation in LG-SF and LG-SC, respectively) and indicated by a colored circle.
Discussion
Epigenetic processes provide a viable molecular model underlying mechanisms by which LG-SF can lead to long-term metabolic dysfunction in the offspring. To understand the extent of the epigenetic alterations in offspring induced by LG-SF in the VWAT, we performed large-scale DNA methylation analyses using MeDIP coupled to tiling microarrays (MeDIP-chip), and current findings provide the first comprehensive map of epigenomic modifications associated with sleep perturbations during pregnancy.
VWAT cells secrete a large number of hormones, growth factors, enzymes, cytokines, complement factors, and matrix proteins that underlie an elaborate and complex array of homeostatic systems. VWAT cells also express receptors for most of these factors indicating extensive crosstalk at a local and systemic level in response to specific external stimuli or metabolic changes (41). Indeed, the vast majority of adipocyte-derived factors have been shown to be de-regulated in alterations accompanying WAT mass changes, such as overfeeding (42) or gestational high fat diet (43-46). Thus, environmental perturbations during gestation such as LG-SF alter the adipocyte epigenome of the offspring and lead to changes whose phenotypic expression becomes manifest during adult life (7). In line with our previous findings (7), we recapitulated in the present study that body weight, as well as visceral and subcutaneous fat mass, plasma cholesterol, triglycerides and HOMA-IR values were all increased in offspring of mothers exposed to LG-SF compared to controls.
Whereas single loci epigenetic analysis provided very valuable information on how de-regulation of candidate genes can affect particular cellular functions, epigenome-wide analysis enables a more integrative assessment that incorporates biochemical pathways and gene networks affected by LG-SF. Probe level analysis showed that distinctive DNA methylation profiles occur in LG-SF-exposed VWAT of offspring, and to identify gene-associated functionally relevant regions adjacent probes with significant differential methylation were grouped in DMRs. We verified our microarray findings by single-locus analysis of the Pparg gene. The Pparg gene encodes a member of the peroxisome proliferator-activated receptor (PPAR) subfamily of nuclear receptors: PPAR-gamma, which is a regulator of adipocyte differentiation, insulin resistance and inflammation in adipose tissue (38) and has been implicated in the pathology of numerous diseases including obesity and metabolic syndrome, diabetes, atherosclerosis and cancer (38). In addition, we detected a large proportion of the DMR-associated genes that have reported functions that are altered in the metabolic syndrome, such as Cartpt, Akt2, Apoe, Insr1, etc. For example, the Cartpt gene encodes the prepropeptide for the cocaine and amphetamine regulated transcript (CART) protein, which was found to be expressed in both subcutaneous and visceral white adipose tissues (47). It was reported that in mouse adipocytes under normal conditions CART avoids lipid and glucose accumulation by increasing isoprenaline-induced lipolysis as well as lipase activation, and by inhibiting glucose uptake and lipogenesis (47). Conversely, the expression of Akt2 is elevated in insulin-sensitive tissues, such as adipose tissue, skeletal muscle and liver (48). It has been shown that Akt2 promotes the increase of adipose tissue mass in human and mouse. Akt2-null mice exhibited lipodistrophy and severe insulin resistance (49). Knockdown of Akt2 in human adipocytes inhibited the proliferation of pre-adipocytes and increased sensitivity to apoptosis (50).
Among the highest overrepresented canonical pathways and non-directional gene networks we found molecular processes related to metabolic regulation and inflammatory response (i.e. PPARα/RXRα Activation, Protein Ubiquitination Pathway, Glycolysis and Gluconeogenesis, etc.) (Figure 4 and tables 1 and S3-6). Activation of the immune system as well as chronic low grade inflammation are involved in the pathogenesis of the obesity-related insulin resistance and type 2 diabetes (51-53). Our group and others have previously shown that SF promotes inflammation in several end-organs (30, 54-56), including in offspring of LG-SF exposed mothers (57). Taken together with the findings of metabolic alterations in the LG-SF offspring, our pathway analysis findings suggest a complex activation of pathways promoting VWAT inflammation via epigenetic alterations.
Thus, the current study provides a large body of novel information that should enable further study of the impact of epigenetics in gestational sleep disorders and their long term metabolic consequences in the offspring. However, given the scope and nature of our work we acknowledge several limitations of current work: First, we focused only on gestational SF, whereas the study of other characteristics of sleep disorders such as late gestational Intermittent Hypoxia (LG-IH), alone or in combination with LG-SF, as would occur in gestational sleep apnea, may reveal other important epigenetic regulatory mechanisms. Second, the occurrence of sleep disorders may overlap with nutritional alterations during gestation that may in turn further modify the offspring epigenome and phenotype. Furthermore, LG-SF may alter epigenomes in other metabolically active tissues such as liver and skeletal muscle. Third, other epigenetic processes not covered in this study may be involved in the establishment phenotypes in the offspring (i.e., 5 hydroxylmethylation and histone modifications) and other genomic elements not covered by the microarray (i.e. distal enhancer/silencers) may also be involved. Thus, future studies combining different epigenetic marks and high resolution epigenetic profiling (e.g., MeDIP-Seq or ChIP-Seq) will provide an even more comprehensive survey of the epigenome landscape induced by gestational sleep disorders. Lastly, more mechanistic studies are needed to elicit the molecular mechanisms involved. Specifically, future studies should address the relative role of the individual epigenetic modifying enzymes (DNA methyltransferases (DNMTs), histone deacetylases (HDACs), histone methyltransferases (HMTs), etc.).
In summary, we provide the first large-scale profiling of DNA methylation alterations in the VWAT of offspring caused by gestational sleep disorders. Such studies have revealed that LG-SF-induced epigenetic alterations appear to increase the susceptibility to obesity and metabolic syndrome in the offspring, and provide a detailed map of epigenetic alterations at single locus and epigenome-wide level that suggest a major role for epigenomic regulation of pathways associated to metabolic processes and inflammatory responses in VWAT.
Supplementary Material
A) Signal density plots for all the arrays in the analysis. Signal distribution for each microarray is indicated by blue and red curves for samples belonging to the LG-SF and LG-SC groups, respectively. Plots are based in the full probe data sets (n=4,212,009 probes). B) Distribution of microarray signal intensities before (left plot) and after (right plot) quantile normalization. Signal distribution for each microarray is indicated by blue and red boxes for samples belonging to the LG-SF and LG-SC groups, respectively. C) Correction of signal intensity distribution biases by quantile normalization. Signal intensity distributions according to GC content and position in the sequence before (left plots) and after (right plots) quantile normalization are shown.
Table S7: Ingenuity Pathway Analysis toxicity lists overrepresented in DMR associated genes with higher methylation in the LG-SC group.
Genome browser images showing the location of the DMRs for the Irs1 (panel A) and Apoe (panel B) genes. These genes were identified as main nodes in functional gene networks and showed significantly higher DNA methylation in the LG-SF and LG-SC groups, respectively. Location of transcripts, CpG islands, DMRs and normalized signals are shown as in Figure 3.
Genome browser images showing the location of the DMRs for the Cartpt (panel A) and Akt2 (panel B) genes. These genes have functions altered in metabolic syndrome and showed significantly higher DNA methylation in the LG-SF and LG-SC groups, respectively. Location of transcripts, CpG islands, DMRs and normalized signals are shown as in Figure 3.
Table S1: Primer sequences for Pparg locus analysis.
Table S2: List of DMRs and associated transcripts and genes.
Table S3: Candidate genes selected for pathway and gene network analysis.
Table S4: Canonical pathways overrepresented in DMR associated genes with higher methylation in the LG-SF group.
Table S5: Canonical pathways overrepresented in DMR associated genes with higher methylation in the LG-SC group.
Table S6: Ingenuity Pathway Analysis toxicity lists overrepresented in DMR associated genes with higher methylation in the LG-SF group.
Acknowledgments
This work was supported by the Herbert T. Abelson Chair in Pediatrics.
Footnotes
Supplementary Materials: Supplementary information is available at IJO’s website.
Conflict of interest
The authors declare no conflict of interest.
References
- 1.Yogev Y, Catalano PM. Pregnancy and obesity. Obstetrics and gynecology clinics of North America. 2009;36(2):285–300. viii. doi: 10.1016/j.ogc.2009.03.003. [DOI] [PubMed] [Google Scholar]
- 2.Frederick IO, Qiu C, Sorensen TK, Enquobahrie DA, Williams MA. The prevalence and correlates of habitual snoring during pregnancy. Sleep & breathing = Schlaf & Atmung. 2013;17(2):541–7. doi: 10.1007/s11325-012-0717-z. [DOI] [PubMed] [Google Scholar]
- 3.Hutchison BL, Stone PR, McCowan LM, Stewart AW, Thompson JM, Mitchell EA. A postal survey of maternal sleep in late pregnancy. BMC pregnancy and childbirth. 2012;12:144. doi: 10.1186/1471-2393-12-144. [DOI] [PMC free article] [PubMed] [Google Scholar]
- 4.Kapsimalis F, Kryger M. Sleep breathing disorders in the U.S. female population. Journal of women’s health. 2009;18(8):1211–9. doi: 10.1089/jwh.2008.1054. [DOI] [PMC free article] [PubMed] [Google Scholar]
- 5.Sahota PK, Jain SS, Dhand R. Sleep disorders in pregnancy. Current opinion in pulmonary medicine. 2003;9(6):477–83. doi: 10.1097/00063198-200311000-00005. [DOI] [PubMed] [Google Scholar]
- 6.Calegare BF, Fernandes L, Tufik S, D’Almeida V. Biochemical, biometrical and behavioral changes in male offspring of sleep-deprived mice. Psychoneuroendocrinology. 2010;35(5):775–84. doi: 10.1016/j.psyneuen.2009.11.004. [DOI] [PubMed] [Google Scholar]
- 7.Khalyfa A, Mutskov V, Carreras A, Khalyfa AA, Hakim F, Gozal D. Sleep Fragmentation During Late Gestation Induces Metabolic Perturbations and Epigenetic Changes in Adiponectin Gene Expression in Male Adult Offspring Mice. Diabetes. 2014 doi: 10.2337/db14-0202. [DOI] [PMC free article] [PubMed] [Google Scholar]
- 8.Maccari S, Darnaudery M, Morley-Fletcher S, Zuena AR, Cinque C, Van Reeth O. Prenatal stress and long-term consequences: implications of glucocorticoid hormones. Neuroscience and biobehavioral reviews. 2003;27(1-2):119–27. doi: 10.1016/s0149-7634(03)00014-9. [DOI] [PubMed] [Google Scholar]
- 9.Arnardottir ES, Mackiewicz M, Gislason T, Teff KL, Pack AI. Molecular signatures of obstructive sleep apnea in adults: a review and perspective. Sleep. 2009;32(4):447–70. doi: 10.1093/sleep/32.4.447. [DOI] [PMC free article] [PubMed] [Google Scholar]
- 10.Dempsey JA, Veasey SC, Morgan BJ, O’Donnell CP. Pathophysiology of sleep apnea. Physiological reviews. 2010;90(1):47–112. doi: 10.1152/physrev.00043.2008. [DOI] [PMC free article] [PubMed] [Google Scholar]
- 11.Tasali E, Ip MS. Obstructive sleep apnea and metabolic syndrome: alterations in glucose metabolism and inflammation. Proceedings of the American Thoracic Society. 2008;5(2):207–17. doi: 10.1513/pats.200708-139MG. [DOI] [PubMed] [Google Scholar]
- 12.Spiegel K, Tasali E, Leproult R, Van Cauter E. Effects of poor and short sleep on glucose metabolism and obesity risk. Nature reviews Endocrinology. 2009;5(5):253–61. doi: 10.1038/nrendo.2009.23. [DOI] [PMC free article] [PubMed] [Google Scholar]
- 13.Qiu C, Enquobahrie D, Frederick IO, Abetew D, Williams MA. Glucose intolerance and gestational diabetes risk in relation to sleep duration and snoring during pregnancy: a pilot study. BMC women’s health. 2010;10:17. doi: 10.1186/1472-6874-10-17. [DOI] [PMC free article] [PubMed] [Google Scholar]
- 14.Tamashiro KL, Moran TH. Perinatal environment and its influences on metabolic programming of offspring. Physiology & behavior. 2010;100(5):560–6. doi: 10.1016/j.physbeh.2010.04.008. [DOI] [PMC free article] [PubMed] [Google Scholar]
- 15.Gozal D, Reeves SR, Row BW, Neville JJ, Guo SZ, Lipton AJ. Respiratory effects of gestational intermittent hypoxia in the developing rat. American journal of respiratory and critical care medicine. 2003;167(11):1540–7. doi: 10.1164/rccm.200208-963OC. [DOI] [PubMed] [Google Scholar]
- 16.Reichmann JP. Pregnancy-onset habitual snoring, gestational hypertension, and preeclampsia: prospective cohort study. American journal of obstetrics and gynecology. 2013;208(6):507. doi: 10.1016/j.ajog.2013.01.029. [DOI] [PubMed] [Google Scholar]
- 17.O’Brien LM, Bullough AS, Owusu JT, Tremblay KA, Brincat CA, Chames MC, et al. Snoring during Pregnancy and Delivery Outcomes: A Cohort Study. Sleep. 2013;36(11):1625–32. doi: 10.5665/sleep.3112. [DOI] [PMC free article] [PubMed] [Google Scholar]
- 18.Zouein E, Bourjeily G. Sleep patterns in pregnancy and fetal growth. Epidemiology (Cambridge, Mass) 2012;23(2):356. doi: 10.1097/EDE.0b013e318245f925. [DOI] [PubMed] [Google Scholar]
- 19.Hales CN, Barker DJ. Type 2 (non-insulin-dependent) diabetes mellitus: the thrifty phenotype hypothesis. Diabetologia. 1992;35(7):595–601. doi: 10.1007/BF00400248. [DOI] [PubMed] [Google Scholar]
- 20.Hanson M, Godfrey KM, Lillycrop KA, Burdge GC, Gluckman PD. Developmental plasticity and developmental origins of non-communicable disease: theoretical considerations and epigenetic mechanisms. Progress in biophysics and molecular biology. 2011;106(1):272–80. doi: 10.1016/j.pbiomolbio.2010.12.008. [DOI] [PubMed] [Google Scholar]
- 21.Gluckman PD, Hanson MA, Low FM. The role of developmental plasticity and epigenetics in human health. Birth defects research Part C, Embryo today : reviews. 2011;93(1):12–8. doi: 10.1002/bdrc.20198. [DOI] [PubMed] [Google Scholar]
- 22.Godfrey KM, Inskip HM, Hanson MA. The long-term effects of prenatal development on growth and metabolism. Seminars in reproductive medicine. 2011;29(3):257–65. doi: 10.1055/s-0031-1275518. [DOI] [PMC free article] [PubMed] [Google Scholar]
- 23.Khalyfa A, Mutskov V, Carreras A, Khalyfa AA, Hakim F, Gozal D. Sleep fragmentation during late gestation induces metabolic perturbations and epigenetic changes in adiponectin gene expression in male adult offspring mice. Diabetes. 2014;63(10):3230–41. doi: 10.2337/db14-0202. [DOI] [PMC free article] [PubMed] [Google Scholar]
- 24.Cahan P, Daley GQ. Origins and implications of pluripotent stem cell variability and heterogeneity. Nature reviews Molecular cell biology. 2013;14(6):357–68. doi: 10.1038/nrm3584. [DOI] [PMC free article] [PubMed] [Google Scholar]
- 25.Kilpinen H, Dermitzakis ET. Genetic and epigenetic contribution to complex traits. Human molecular genetics. 2012;21(R1):R24–8. doi: 10.1093/hmg/dds383. [DOI] [PubMed] [Google Scholar]
- 26.Caserta F, Tchkonia T, Civelek VN, Prentki M, Brown NF, McGarry JD, et al. Fat depot origin affects fatty acid handling in cultured rat and human preadipocytes. American journal of physiology Endocrinology and metabolism. 2001;280(2):E238–47. doi: 10.1152/ajpendo.2001.280.2.E238. [DOI] [PubMed] [Google Scholar]
- 27.Vohl MC, Sladek R, Robitaille J, Gurd S, Marceau P, Richard D, et al. A survey of genes differentially expressed in subcutaneous and visceral adipose tissue in men. Obesity research. 2004;12(8):1217–22. doi: 10.1038/oby.2004.153. [DOI] [PubMed] [Google Scholar]
- 28.Tchkonia T, Morbeck DE, Von Zglinicki T, Van Deursen J, Lustgarten J, Scrable H, et al. Fat tissue, aging, and cellular senescence. Aging cell. 2010;9(5):667–84. doi: 10.1111/j.1474-9726.2010.00608.x. [DOI] [PMC free article] [PubMed] [Google Scholar]
- 29.Pinnick KE, Karpe F. DNA methylation of genes in adipose tissue. The Proceedings of the Nutrition Society. 2011;70(1):57–63. doi: 10.1017/S0029665110004015. [DOI] [PubMed] [Google Scholar]
- 30.Nair D, Zhang SX, Ramesh V, Hakim F, Kaushal N, Wang Y, et al. Sleep fragmentation induces cognitive deficits via nicotinamide adenine dinucleotide phosphate oxidase-dependent pathways in mouse. American journal of respiratory and critical care medicine. 2011;184(11):1305–12. doi: 10.1164/rccm.201107-1173OC. [DOI] [PMC free article] [PubMed] [Google Scholar]
- 31.Mohn F, Weber M, Schubeler D, Roloff TC. Methylated DNA immunoprecipitation (MeDIP) Methods in molecular biology (Clifton, NJ) 2009;507:55–64. doi: 10.1007/978-1-59745-522-0_5. [DOI] [PubMed] [Google Scholar]
- 32.Cortese R, Kwan A, Lalonde E, Bryzgunova O, Bondar A, Wu Y, et al. Epigenetic markers of prostate cancer in plasma circulating DNA. Human molecular genetics. 2012;21(16):3619–31. doi: 10.1093/hmg/dds192. [DOI] [PubMed] [Google Scholar]
- 33.Irizarry RA, Hobbs B, Collin F, Beazer-Barclay YD, Antonellis KJ, Scherf U, et al. Exploration, normalization, and summaries of high density oligonucleotide array probe level data. Biostatistics (Oxford, England) 2003;4(2):249–64. doi: 10.1093/biostatistics/4.2.249. [DOI] [PubMed] [Google Scholar]
- 34.Johnson WE, Li W, Meyer CA, Gottardo R, Carroll JS, Brown M, et al. Model-based analysis of tiling-arrays for ChIP-chip. Proceedings of the National Academy of Sciences of the United States of America. 2006;103(33):12457–62. doi: 10.1073/pnas.0601180103. [DOI] [PMC free article] [PubMed] [Google Scholar]
- 35.Team RC. R: A language and environment for statistical computing. Vienna, Austria: R Foundation for Statistical Computing; 2014. [Google Scholar]
- 36.Zhu Y, Qi C, Korenberg JR, Chen XN, Noya D, Rao MS, et al. Structural organization of mouse peroxisome proliferator-activated receptor gamma (mPPAR gamma) gene: alternative promoter use and different splicing yield two mPPAR gamma isoforms. Proceedings of the National Academy of Sciences of the United States of America. 1995;92(17):7921–5. doi: 10.1073/pnas.92.17.7921. [DOI] [PMC free article] [PubMed] [Google Scholar]
- 37.Tontonoz P, Hu E, Graves RA, Budavari AI, Spiegelman BM. mPPAR gamma 2: tissue-specific regulator of an adipocyte enhancer. Genes & development. 1994;8(10):1224–34. doi: 10.1101/gad.8.10.1224. [DOI] [PubMed] [Google Scholar]
- 38.Fuentes E, Guzman-Jofre L, Moore-Carrasco R, Palomo I. Role of PPARs in inflammatory processes associated with metabolic syndrome (Review) Molecular medicine reports. 2013;8(6):1611–6. doi: 10.3892/mmr.2013.1714. [DOI] [PubMed] [Google Scholar]
- 39.Abdelkarim M, Caron S, Duhem C, Prawitt J, Dumont J, Lucas A, et al. The farnesoid X receptor regulates adipocyte differentiation and function by promoting peroxisome proliferator-activated receptor-gamma and interfering with the Wnt/beta-catenin pathways. The Journal of biological chemistry. 2010;285(47):36759–67. doi: 10.1074/jbc.M110.166231. [DOI] [PMC free article] [PubMed] [Google Scholar]
- 40.Maneschi E, Vignozzi L, Morelli A, Mello T, Filippi S, Cellai I, et al. FXR activation normalizes insulin sensitivity in visceral preadipocytes of a rabbit model of MetS. The Journal of endocrinology. 2013;218(2):215–31. doi: 10.1530/JOE-13-0109. [DOI] [PubMed] [Google Scholar]
- 41.Gorla-Bajszczak A, Siegrist-Kaiser C, Boss O, Burger AG, Meier CA. Expression of peroxisome proliferator-activated receptors in lean and obese Zucker rats. Eur J Endocrinol. 2000;142(1):71–8. doi: 10.1530/eje.0.1420071. [DOI] [PubMed] [Google Scholar]
- 42.Fruhbeck G. Overview of adipose tissue and its role in obesity and metabolic disorders. Methods in molecular biology (Clifton, NJ) 2008;456:1–22. doi: 10.1007/978-1-59745-245-8_1. [DOI] [PubMed] [Google Scholar]
- 43.Khalyfa A, Carreras A, Hakim F, Cunningham JM, Wang Y, Gozal D. Effects of late gestational high-fat diet on body weight, metabolic regulation and adipokine expression in offspring. International journal of obesity (2005) 2013 doi: 10.1038/ijo.2013.12. [DOI] [PMC free article] [PubMed] [Google Scholar]
- 44.Murabayashi N, Sugiyama T, Zhang L, Kamimoto Y, Umekawa T, Ma N, et al. Maternal high-fat diets cause insulin resistance through inflammatory changes in fetal adipose tissue. European journal of obstetrics, gynecology, and reproductive biology. 2013;169(1):39–44. doi: 10.1016/j.ejogrb.2013.02.003. [DOI] [PubMed] [Google Scholar]
- 45.Parlee SD, MacDougald OA. Maternal nutrition and risk of obesity in offspring: the Trojan horse of developmental plasticity. Biochimica et biophysica acta. 2014;1842(3):495–506. doi: 10.1016/j.bbadis.2013.07.007. [DOI] [PMC free article] [PubMed] [Google Scholar]
- 46.Isganaitis E, Woo M, Ma H, Chen M, Kong W, Lytras A, et al. Developmental programming by maternal insulin resistance: hyperinsulinemia, glucose intolerance, and dysregulated lipid metabolism in male offspring of insulin-resistant mice. Diabetes. 2014;63(2):688–700. doi: 10.2337/db13-0558. [DOI] [PMC free article] [PubMed] [Google Scholar]
- 47.Banke E, Riva M, Shcherbina L, Wierup N, Degerman E. Cocaine- and amphetamine-regulated transcript is expressed in adipocytes and regulate lipid- and glucose homeostasis. Regulatory peptides. 2013;182:35–40. doi: 10.1016/j.regpep.2012.12.011. [DOI] [PubMed] [Google Scholar]
- 48.Hill MM, Clark SF, Tucker DF, Birnbaum MJ, James DE, Macaulay SL. A role for protein kinase Bbeta/Akt2 in insulin-stimulated GLUT4 translocation in adipocytes. Molecular and cellular biology. 1999;19(11):7771–81. doi: 10.1128/mcb.19.11.7771. [DOI] [PMC free article] [PubMed] [Google Scholar]
- 49.Garofalo RS, Orena SJ, Rafidi K, Torchia AJ, Stock JL, Hildebrandt AL, et al. Severe diabetes, age-dependent loss of adipose tissue, and mild growth deficiency in mice lacking Akt2/PKB beta. The Journal of clinical investigation. 2003;112(2):197–208. doi: 10.1172/JCI16885. [DOI] [PMC free article] [PubMed] [Google Scholar]
- 50.Fischer-Posovszky P, Tews D, Horenburg S, Debatin KM, Wabitsch M. Differential function of Akt1 and Akt2 in human adipocytes. Molecular and cellular endocrinology. 2012;358(1):135–43. doi: 10.1016/j.mce.2012.03.018. [DOI] [PubMed] [Google Scholar]
- 51.Shoelson SE, Lee J, Goldfine AB. Inflammation and insulin resistance. The Journal of clinical investigation. 2006;116(7):1793–801. doi: 10.1172/JCI29069. [DOI] [PMC free article] [PubMed] [Google Scholar]
- 52.Donath MY, Shoelson SE. Type 2 diabetes as an inflammatory disease. Nature reviews Immunology. 2011;11(2):98–107. doi: 10.1038/nri2925. [DOI] [PubMed] [Google Scholar]
- 53.Chawla A, Nguyen KD, Goh YP. Macrophage-mediated inflammation in metabolic disease. Nature reviews Immunology. 2011;11(11):738–49. doi: 10.1038/nri3071. [DOI] [PMC free article] [PubMed] [Google Scholar]
- 54.Ramesh V, Nair D, Zhang SX, Hakim F, Kaushal N, Kayali F, et al. Disrupted sleep without sleep curtailment induces sleepiness and cognitive dysfunction via the tumor necrosis factor-alpha pathway. Journal of neuroinflammation. 2012;9:91. doi: 10.1186/1742-2094-9-91. [DOI] [PMC free article] [PubMed] [Google Scholar]
- 55.Kaushal N, Ramesh V, Gozal D. TNF-alpha and temporal changes in sleep architecture in mice exposed to sleep fragmentation. PloS one. 2012;7(9):e45610. doi: 10.1371/journal.pone.0045610. [DOI] [PMC free article] [PubMed] [Google Scholar]
- 56.Moller-Levet CS, Archer SN, Bucca G, Laing EE, Slak A, Kabiljo R, et al. Effects of insufficient sleep on circadian rhythmicity and expression amplitude of the human blood transcriptome. Proceedings of the National Academy of Sciences of the United States of America. 2013;110(12):E1132–41. doi: 10.1073/pnas.1217154110. [DOI] [PMC free article] [PubMed] [Google Scholar]
- 57.Khalyfa A, Carreras A, Almendros I, Hakim F, Gozal D. Sex Dimorphism in Late Gestational Sleep Fragmentation and Metabolic Dysfunction in Offspring Mice. Sleep. 2014 doi: 10.5665/sleep.4568. [DOI] [PMC free article] [PubMed] [Google Scholar]
Associated Data
This section collects any data citations, data availability statements, or supplementary materials included in this article.
Supplementary Materials
A) Signal density plots for all the arrays in the analysis. Signal distribution for each microarray is indicated by blue and red curves for samples belonging to the LG-SF and LG-SC groups, respectively. Plots are based in the full probe data sets (n=4,212,009 probes). B) Distribution of microarray signal intensities before (left plot) and after (right plot) quantile normalization. Signal distribution for each microarray is indicated by blue and red boxes for samples belonging to the LG-SF and LG-SC groups, respectively. C) Correction of signal intensity distribution biases by quantile normalization. Signal intensity distributions according to GC content and position in the sequence before (left plots) and after (right plots) quantile normalization are shown.
Table S7: Ingenuity Pathway Analysis toxicity lists overrepresented in DMR associated genes with higher methylation in the LG-SC group.
Genome browser images showing the location of the DMRs for the Irs1 (panel A) and Apoe (panel B) genes. These genes were identified as main nodes in functional gene networks and showed significantly higher DNA methylation in the LG-SF and LG-SC groups, respectively. Location of transcripts, CpG islands, DMRs and normalized signals are shown as in Figure 3.
Genome browser images showing the location of the DMRs for the Cartpt (panel A) and Akt2 (panel B) genes. These genes have functions altered in metabolic syndrome and showed significantly higher DNA methylation in the LG-SF and LG-SC groups, respectively. Location of transcripts, CpG islands, DMRs and normalized signals are shown as in Figure 3.
Table S1: Primer sequences for Pparg locus analysis.
Table S2: List of DMRs and associated transcripts and genes.
Table S3: Candidate genes selected for pathway and gene network analysis.
Table S4: Canonical pathways overrepresented in DMR associated genes with higher methylation in the LG-SF group.
Table S5: Canonical pathways overrepresented in DMR associated genes with higher methylation in the LG-SC group.
Table S6: Ingenuity Pathway Analysis toxicity lists overrepresented in DMR associated genes with higher methylation in the LG-SF group.