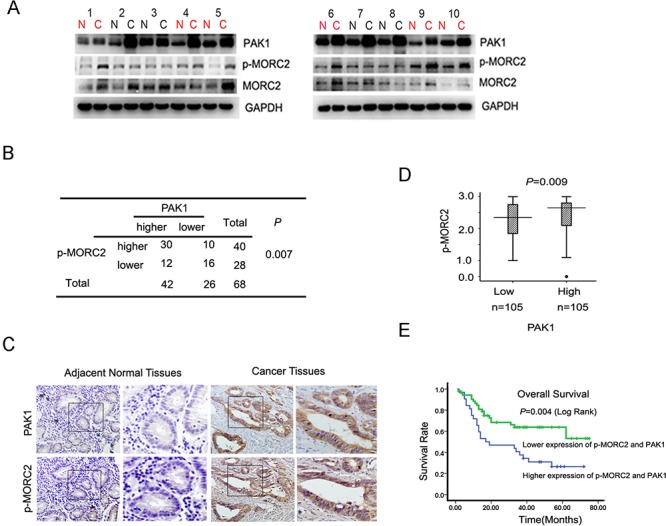
Figure 5. Phosphorylation of MORC2 and PAK1 expression positively correlates with clinical gastric cancer outcome.

(A) Evaluate the expression of the PAK1 and p-MORC2 in clinical tissues by western Blot. Lysates of 68 cancer tissues (C) and matched adjacent normal tissues (N) pairs were analyzed by Western Blot. Number of cancers with reduced or increased levels of indicated protein relative to normal adjacent tissues and analyze with GAPDH as the reference. The representative 10 pairs were shown. (B) Summary of the expression in tissues in (a) is shown, with tissues categorized by lower and higher expression. The expression of PAK1 and p-MORC2 Ser677 was analyzed with GAPDH as the reference. In each N and C pair, the lower/higher expression in C, compared with N, is categorized as lower/higher expression. The P value was generated using the chi-square test. (C) Representative images of immunohistochemical staining of PAK1 and p-MORC2 expression from one case were shown. The boxed areas in the left images are magnified in the right images. N, adjacent normal tissue (shown in the left column); C, cancer tissue (shown in the right column). Original magnification, ×200. (D) Box plot of PAK1 and p-MORC2 1 expressions were shown. The subjects were divided into two groups based on PAK1 expression scores in the 210 gastric tumors, representing low and high expression. The PAK1 and p-MORC2 expression scores were shown as box plots, with the horizontal lines representing the median; the bottom and top of the boxes representing the 25th and 75th percentiles, respectively; and the vertical bars representing the range of data. And extreme cases were marked with a dot. Data was analyzed by one-way analysis of variance (ANOVA) test with Games–Howell's correction. (E) Kaplan–Meier's analyses illustrated that the 5-year survival rate according to PAK1 and p-MORC2 expression scores, representing low and high expression of them. These 210 gastric cancer patients were divided into four groups based on PAK1 and p-MORC2 expression scores, the higher and lower of expression of PAK1 and p-MORC2 were analyzed by Kaplan–Meier analysis.
