SUMMARY
Hypothalamic pro-opiomelanocortin (POMC) neurons promote satiety. Cannabinoid receptor 1 (CB1R) is critical for central regulation of food intake. We interrogated whether CB1R-controlled feeding is paralleled by decreased activity of POMC neurons. Chemical promotion of CB1R activity increased feeding, and strikingly, CB1R activation also promoted neuronal activity of POMC cells. This paradoxical increase in POMC activity was crucial for CB1R-induced feeding, because Designer-Receptors-Exclusively-Activated-by-Designer-Drugs (DREADD)-mediated inhibition of POMC neurons diminished, while DREADD-mediated activation of POMC neurons enhanced CB1R-driven feeding. The Pomc gene encodes both the anorexigenic peptide, α-melanocyte-stimulating hormone (α-MSH), and the peptide, β-endorphin. CB1R activation selectively increased β-endorphin but not α-MSH release in the hypothalamus, and, systemic or hypothalamic administration of the opioid receptor antagonist, naloxone, blocked acute CB1R-induced feeding. These processes involved mitochondrial adaptations, which, when blocked, abolished CB1R-induced cellular responses and feeding. Together, these results unmasked a previously unsuspected role of POMC neurons in promotion of feeding by cannabinoids.
Feeding behavior is under control of hypothalamic circuits1. In this, arcuate nucleus (ARC), Agouti-related peptide (AgRP)-expressing neurons, when activated, promote food intake2,3, while pro-opiomelanocortin (POMC)-producing neurons promote satiety4. Homeostatic feeding regulation can be disrupted by exogenous substances, such as cannabinoids5. Activation of cannabinoid receptor 1 (CB1R) can lead to robust feeding despite of animals being sated6. However, the role of cannabinoids in control of hypothalamic feeding circuits remains enigmatic5–10. In this study, we interrogated whether CB1R-mediated feeding in satiety state is associated with suppressed activity of POMC neurons, and if so, whether the altered activity of these neurons is important for CB1R-induced feeding.
CB1R drives activation of POMC neurons
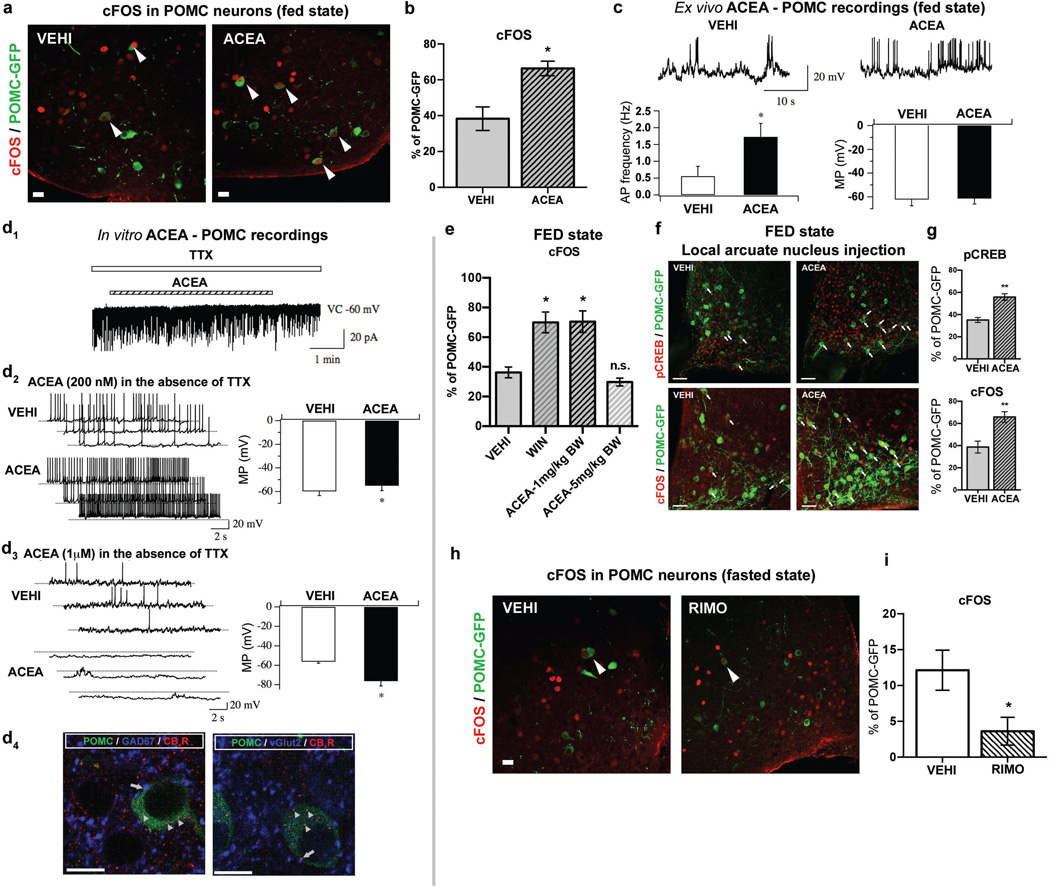
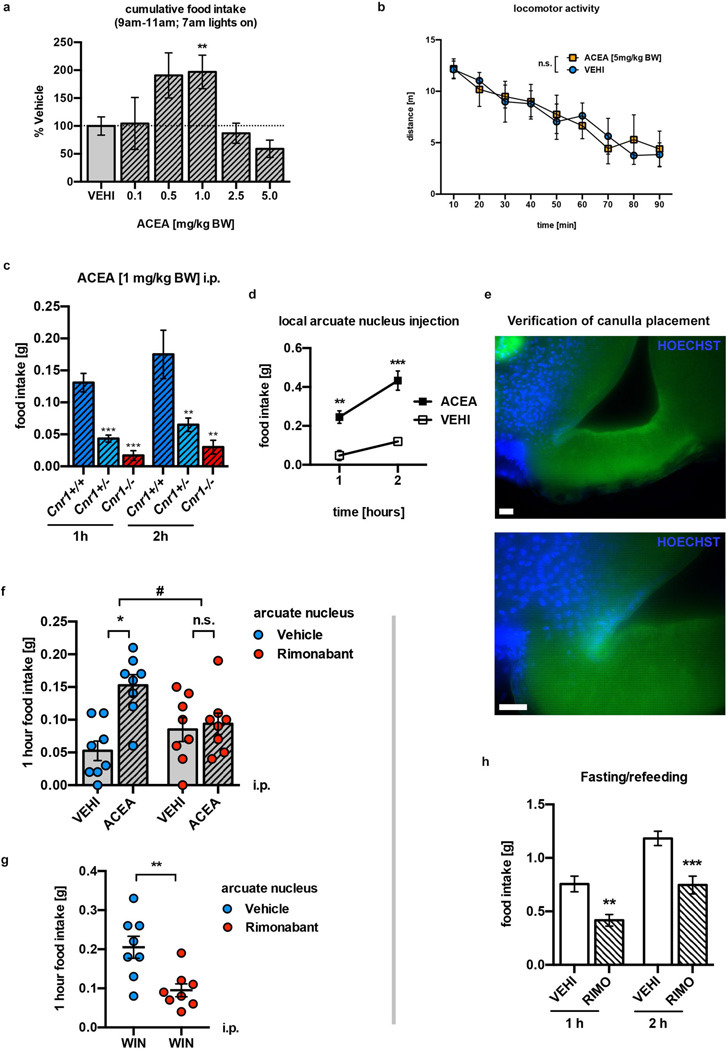
We found that the selective CB1R agonist, arachidonyl-2'-chloroethylamide (ACEA), induced a known11 bimodal feeding response in fed mice (Extended Data Fig. 1a–c). Strikingly, hyperphagic stimulation of CB1R resulted in activation of POMC neurons, as assessed by cFOS expression (Fig. 1a, b). Ex vivo electrophysiological recordings from ACEA-treated mice confirmed POMC neuronal activation (Fig. 1c). Next, we analyzed slices acutely treated with ACEA. In the presence of tetrodotoxin (TTX), which blocks presynaptic events, ACEA failed to alter membrane potential of POMC neurons (Fig. 1d1). We found that without TTX, low doses of ACEA (200 nM) induced depolarization of POMC neurons (Fig. 1d2), as reported earlier12, while high doses of ACEA (1 µM) resulted in hyperpolarization of POMC cells (Fig. 1d3). As an anatomical substrate of these effects, we detected CB1R immunolabeling in both GABAergic and glutamatergic presynaptic terminals of POMC neurons (Fig. 1d4). In line with these, hyperphagic doses of CB1R agonists ACEA or WIN 55,212-2 (1 mg/kg BW, respectively) induced cFOS expression in POMC neurons (Fig. 1e). In contrast, the dose of the CB1R agonist, ACEA, (5 mg/kg BW) that did not affect food intake, did not induce cFOS expression in POMC neurons (Fig. 1e).
Fig. 1. CB1R-driven paradoxical POMC activation.
a, b In fed mice, ACEA increased POMC cFOS (VEHI, n=5 mice, 38.3±6.6%; ACEA, n=4, 66.4±4.1%; * P <0.05). c ACEA increased POMC action potential (AP) frequency (left, Vehicle, n=22 cells/7 mice, 0.56±0.29 Hz; ACEA, n=22/7, 1.73±0.4 Hz; * P <0.05). POMC membrane potential (MP; right, Vehicle, −61.1±2.7 mV; ACEA, −60.7±2.3 mV). d1 In the presence of TTX, ACEA failed to alter POMC membrane potential (4/4 cells). d2 Without TTX, 200 nM ACEA depolarized POMC neurons (vehicle, n=6 cells, −59.8±3.7 mV; ACEA, n=6, −55.0±4.2 mV; * P <0.05). d3 1 µM ACEA hyperpolarized POMC neurons (vehicle, n=6, −56.2±1.6 mV; ACEA, n=6, −76.1±5.1 mV; * P <0.05). d4 Representative GABAergic (blue, left) and glutamatergic (blue, right) CB1R immunolabeling (red) in presynaptic terminals of POMC-GFP neurons (green). e Increased POMC cFOS by hyperphagic, but not by neutral CB1R activation (VEHI, n=3 mice, 36.3±3.6%; WIN, n=4, 69.9±7%; 1 mg/kg BW ACEA, n=3, 70.4±7.2%; 5 mg/kg BW ACEA, n=3, 29.8±2.6%; * P <0.05 vs. VEHI, P values by ordinary one-way ANOVA, followed by Dunett’s multiple comparisons test). f, g Local ARC hyperphagic CB1R activation induced pCREB-Ser133 (pCREB: VEHI, n=4 mice, 35.2±2.2%; ACEA, n=5, 55.8±3%) and cFOS (cFOS: VEHI, n=5, 38.7±5.4%; ACEA, n=5, 65.8±4.8%; ** P <0.01) in POMC cells. h, i RIMO decreased POMC cFOS (VEHI, n=6 mice, 12.1±2.8%; RIMO, n=6, 3.6±1.9%; * P <0.05). All values ± s.e.m. P values (unpaired comparisons) by two-tailed Student’s t-test. Scale bars; a, b, d4: 25 µm; f: 50 µm.
ACEA injected into the ARC resulted in a feeding response similar to that seen after its peripheral injection (Extended Data Fig. 1d). This local ACEA injection also activated POMC neurons assessed by pCREB-S133 and cFOS immunolabeling (Fig. 1f, g). Administration of the inverse CB1R agonist rimonabant (RIMO) into the ARC blocked stimulation of food intake by peripheral ACEA application (Extended Data Fig. 1e–g), and, RIMO-mediated CB1R blockade augmented inactivation of POMC neurons in fasted mice assessed by cFOS expression (Fig. 1g, h; Extended Data Fig. 1h).
POMC neurons drive feeding by cannabinoids
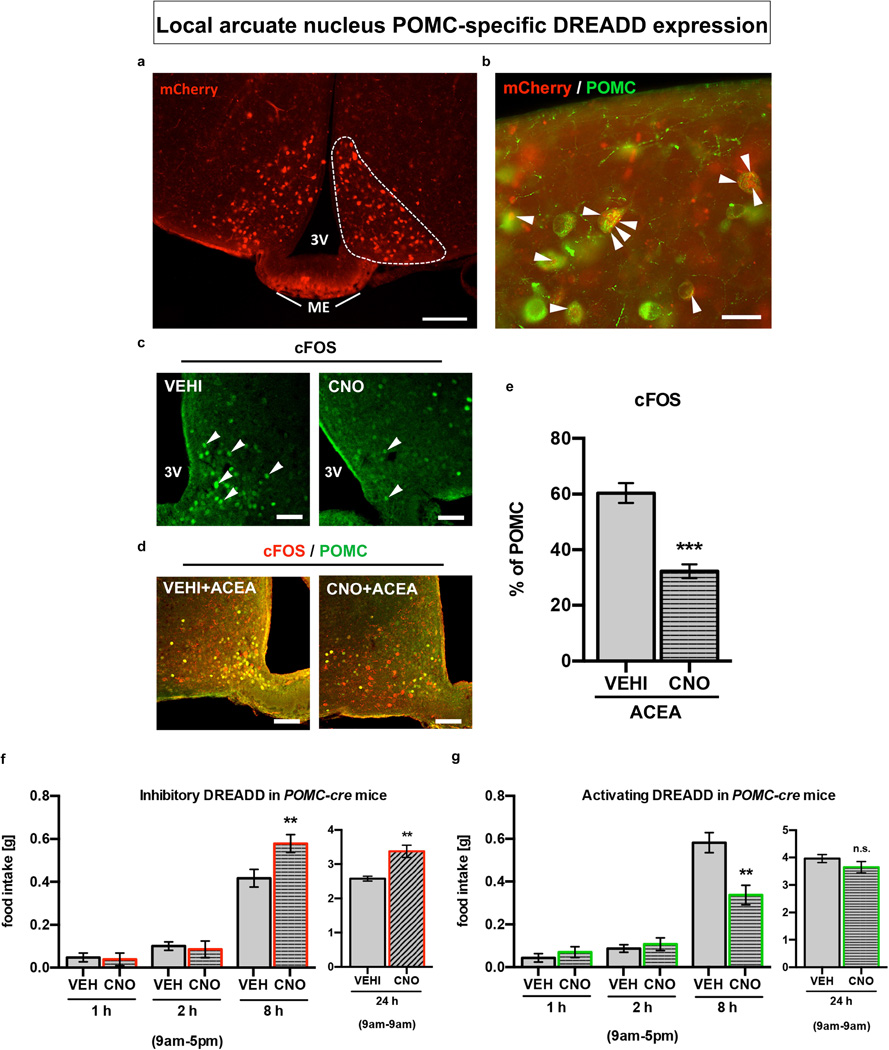
To determine whether the paradoxical POMC neuronal activation triggered by CB1R is relevant for feeding, we injected inhibitory or stimulatory DREADD (AAV-hM4Di-mCherry or AAV-hM3Dq-mCherry3) into the ARC of Pomc-cre mice (Extended Data Fig. 2a,b).
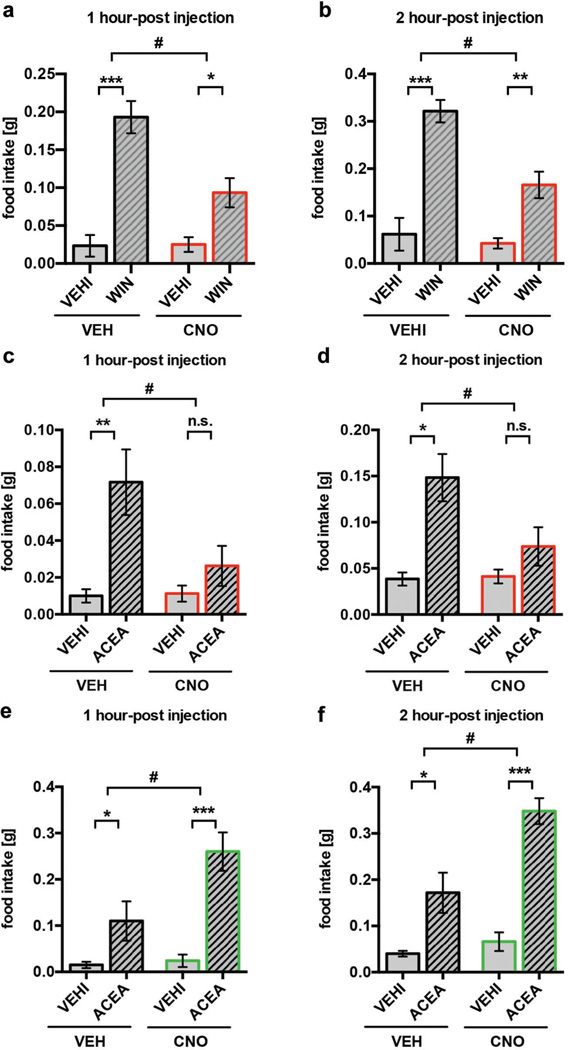
CNO-driven activation of inhibitory DREADD reduced the numbers of cFOS-immunolabeled POMC neurons (Extended Data Fig. 2c) and also blocked ACEA-induced activation of POMC neurons in fed mice (Extended Data Fig. 2d, e). CNO-mediated inhibition of POMC neurons in vehicle-treated mice enhanced feeding 8 hours after CNO administration (Extended Data Fig. 2f). On the other hand, DREADD-mediated activation of POMC neurons in vehicle-treated mice suppressed feeding 8 hours after CNO application (Extended Data Fig. 2g). These findings are in line with previous observations that ARC POMC neurons gradually suppress feeding behavior4,13. In contrast, DREADD-induced inhibition of POMC neurons significantly reduced acute, cannabinoid (WIN- or ACEA)-induced feeding (Fig. 2a–d), while the acute hyperphagic response to the CB1R agonists, ACEA, was significantly amplified by DREADD-induced activation of POMC neurons (Fig. 2e, f). Thus our results demonstrate that POMC neuronal activation is key for feeding evoked by CB1R in sated mice.
Fig. 2. DREADD-controlled POMC activity interferes with cannabinoid-induced feeding.
a, b DREADD-driven POMC inhibition reduced WIN-mediated hyperphagia (1 hour-post injection: VEH+VEHI, n=6 mice, 0.02±0.01; VEH+WIN, n=13, 0.19±0.02; CNO+VEHI, n=8, 0.03±0.01; CNO+WIN, n=12, 0.09±0.02; 2 hour-post injection: VEH+VEHI, 0.06±0.03; VEH+WIN, 0.32±0.02; CNO+VEHI, 0.04±0.01; CNO+WIN, 0.17±0.03) c, d DREADD-driven POMC inhibition blocked ACEA-mediated hyperphagia (1 hour-post injection: VEH+VEHI, n=6, 0.01±0.004; VEH+ACEA, n=6, 0.07±0.02; CNO+VEHI, n=8, 0.01±0.004; CNO+ACEA, n=8, 0.03±0.01; 2 hour-post injection: VEH+VEHI, 0.04±0.01; VEH+ACEA, 0.15±0.03; CNO+VEHI, 0.04±0.01; CNO+ACEA, 0.07±0.02). e, f DREADD-driven POMC activation enhanced ACEA-mediated hyperphagia (1 hour-post injection: VEH+VEHI, n=6, 0.02±0.01; VEH+ACEA, n=6, 0.11±0.04; CNO+VEHI, n=5, 0.02±0.01; CNO+ACEA, n=5, 0.26±0.04; 2 hour-post injection: VEH+VEHI, 0.04±0.01; VEH+ACEA, 0.17±0.04; CNO+VEHI, 0.07±0.02; CNO+ACEA, 0.35±0.03). All values ± s.e.m. * P <0.05, ** P <0.01, *** P <0.001, # P <0.05 interaction of WIN or ACEA and CNO. P values by ordinary two-way ANOVA, followed by Sidak’s multiple comparisons test.
CB1R drives β-endorphin but not α-MSH release
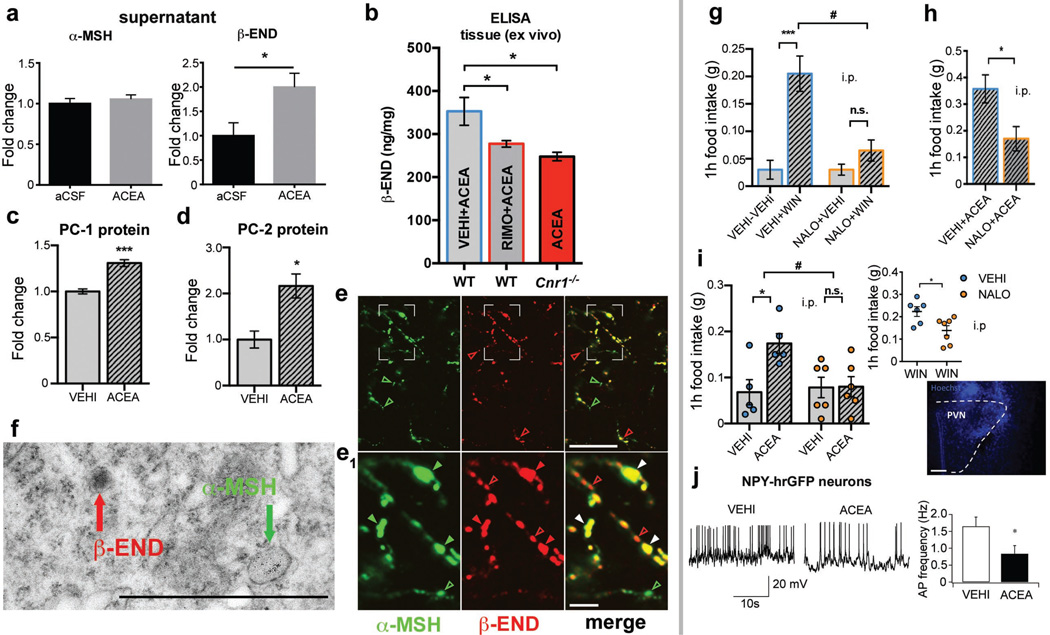
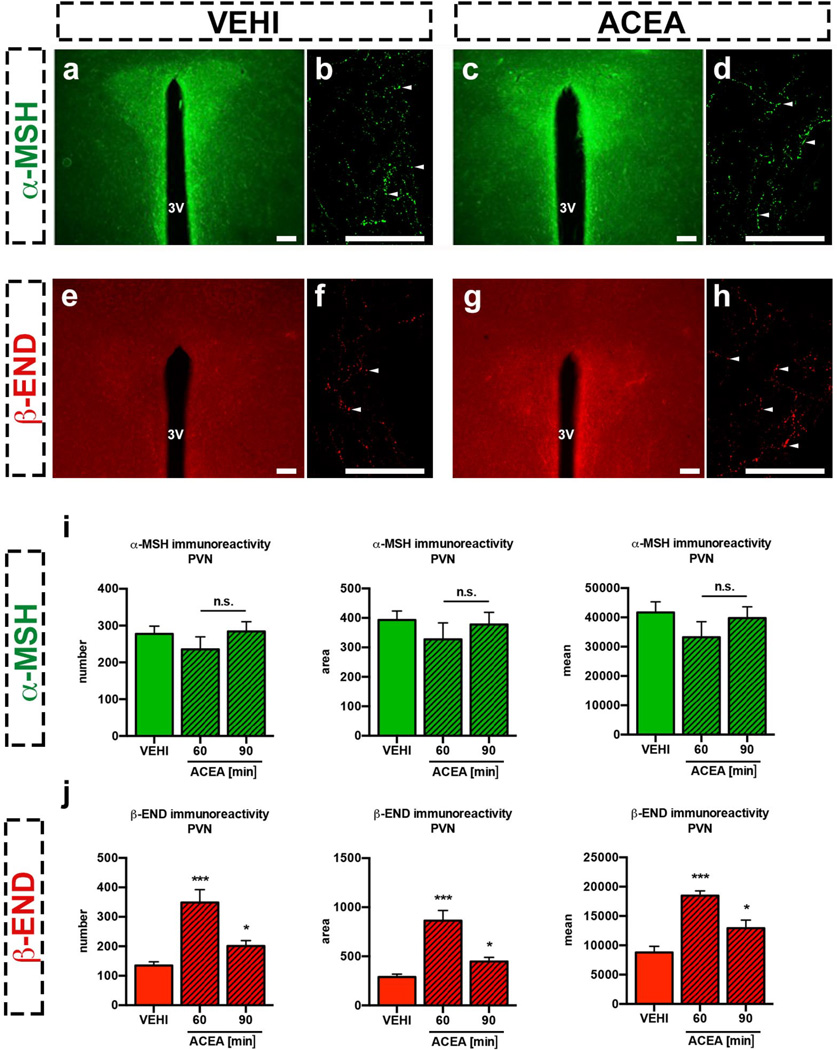
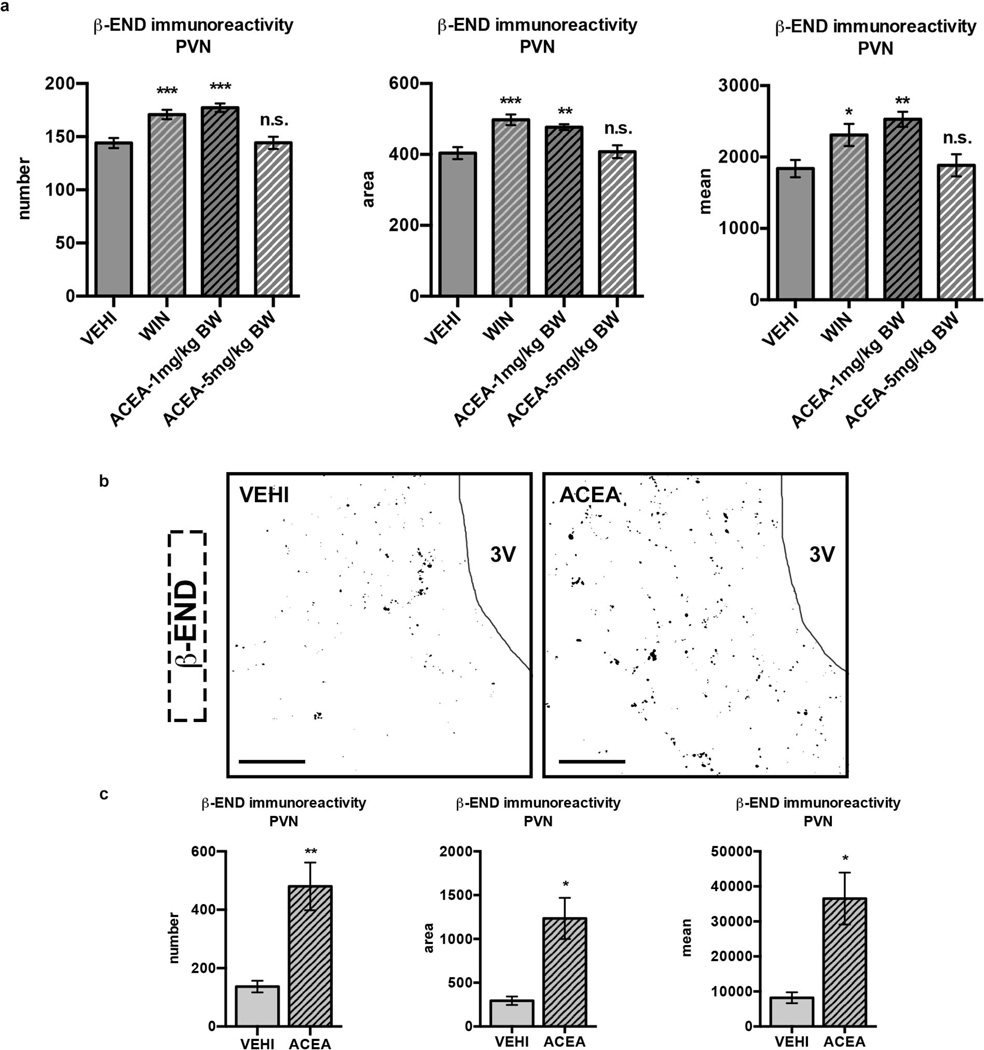
The Pomc gene encodes both the anorexigenic peptide, α melanocyte-stimulating hormone (α-MSH) and the peptide, β-endorphin, which can be orexigenic14–16. The hypothalamic paraventricular nucleus (PVN) is a main site where efferents of POMC neurons are thought to affect feeding1,17,18. ACEA-mediated activation of CB1R did not affect α-MSH levels (Extended Data Fig. 3a–d, i; Extended Data Table 1a), but it was correlated with increased β-endorphin levels in the PVN (Extendend Data Fig. 3e–h, j; Extended Data Table 1b)7. In line with this, ACEA triggered the secretion of β-endorphin but not of α-MSH into the supernatant of acute mediobasal hypothalamic explants derived from fed mice (Fig. 3a).
Fig. 3. CB1R triggers hypothalamic β-endorphin release and drives feeding via opioid receptors.
a ACEA did not affect in vitro α-MSH secretion (aCSF, n=13 mice, 1.00±0.06; ACEA, n=6, 1.05±0.05; n.s. P >0.05) but increased β-endorphin release (aCSF, n=9, 1.00±0.27; ACEA, n=4, 2.00±0.29; * P <0.05). b ARC administration of RIMO blocked ACEA-induced increase of β-endorphin in WT mice (all values in ng/mg protein; VEHI+ACEA, n=6 mice, 352.7±32.4; RIMO+ACEA, n=6, 277.4±7.5; * P <0.05 vs. VEHI+ACEA). ACEA did not increase β-endorphin in CB1R knockout (Cnr1−/−) mice (* P <0.05 P values by one-way ANOVA, followed by Dunnett’s multiple comparisons test). c, d ACEA elevated hypothalamic PC-1 and PC-2 protein levels (all groups n=4 mice; PC-1: VEHI, 1.00±0.03; ACEA, 1.31±0.04; *** P<0.001; PC-2: VEHI, 1.00±0.18; ACEA, 2.16±0.26; * P<0.05). e (overview), e1 (magnification) α-MSH (green fluorescence) and β-endorphin (red fluorescence) in POMC fibers in the PVN. Colored arrows indicate nonoverlapping immunolabeling. f Electron micrograph showing peroxidase immunolabeling of β-endorphin (red arrow) and immunogold labeling of α-MSH (green arrow) in different vesicles of the same process. g, h Peripheral NALO (7.5 mg/kg BW, i.p.) blocked hyperphagia induced by WIN (all values in g; g; VEHI+VEHI, n=10 mice, 0.03±0.02; VEHI+WIN, n=10, 0.21±0.03; NALO+VEHI, n=8, 0.03±0.01, NALO+WIN, n=10, 0.07±0.02; *** P <0.001, n.s. P >0.05, # P <0.05 for interaction of NALO and WIN, P values by ordinary two-way ANOVA, followed by Sidak’s multiple comparisons test) or ACEA (h; VEHI+ACEA, n=4, 0.36±0.05; NALO+ACEA, n=4, 0.17±0.05; * P <0.05). i PVN NALO (5 µg/0.5µL) blocked hyperphagia by ACEA (i.p.; VEHI+VEHI, n=5, 0.07±0.03; VEHI+ACEA, n=5, 0.17±0.02; NALO+VEHI, n=6, 0.08±0.02; NALO+ACEA, n=6, 0.08±0.02; * P <0.05, n.s. P >0.05, # P <0.05 for interaction of NALO and ACEA, P values by ordinary two-way ANOVA, followed by Sidak’s multiple comparisons test) or WIN (i.p.; VEHI+WIN, n=6, 0.22±0.02; NALO+WIN, n=7, 0.14±0.02; * P <0.05; Hoechst (blue) injection for verification of correct cannula placement). j Hyperphagic ACEA decreased AgRP (NPY-hrGFP) action potential (AP) frequency (vehicle, n=20 cells/4mice, 1.65±0.27 Hz; ACEA, n=20/4, 0.84±0.24 Hz; * P <0.05). All values ± s.e.m. P values (unpaired comparisons) by two-tailed Student’s t-test. Scale bars; e: 25 µm; e1: 5 µm f: 1 µm; i: 25 µm.
Next, we blocked ARC CB1R by local injection of RIMO, which diminished ACEA-induced β-endorphin secretion (Fig. 3b). ACEA-induced β-endorphin secretion was absent in CB1R knockout (Cnr1−/−) mice (Fig. 3b). ACEA affected β-endorphin levels in a dose-dependent manner (Extended Data Fig. 4a; Extended Data Table 2), and, local injection of ACEA into the ARC robustly induced β-endorphin levels in the PVN (Extended Data Fig. 4b, c; Extended Data Table 3).
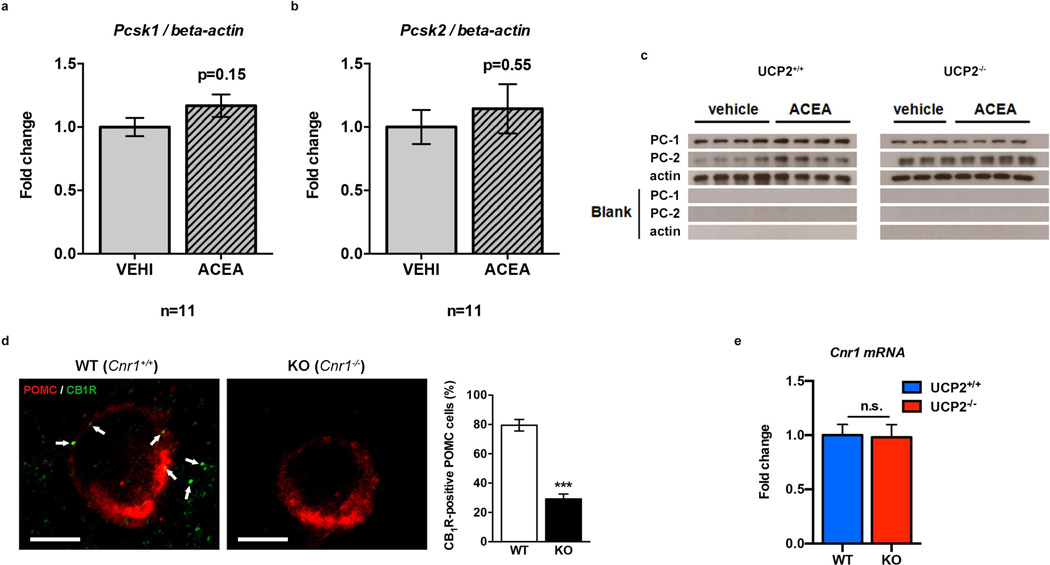
α-MSH and β-endorphin are derived from POMC by pro-protein convertases, including PC-1 and PC-214. CB1R activation did not affect transcriptional regulation of either of these convertases (Pcsk1 and Pcsk2 ; Extended Data Fig. 5a, b) but it increased protein levels of PC-1 and PC-2 (Fig. 3c, d; Extended Data Fig. 5c).
Differential release dynamics of β-endorphin and α-MSH suggest that they may be present in non-overlapping intracellular compartments of POMC neurons. We observed that immunolabeling of these peptides did not overlap in 33.5±5.3% of POMC boutons in the PVN (Fig. 3e). With electron microscopy, we confirmed that β-endorphin and α-MSH could be found in separate vesicles within the same neuronal profile of the PVN (Fig. 3f). Thus, our data suggests that separate vesicle pools of β-endorphin and α-MSH are under diverse regulatory mechanisms.
Naloxone blocks cannabinoid-induced feeding
Previous findings showed that local infusion of β-endorphin into the PVN could induce hyperphagia19,20. In fed mice, the μ-opioid receptor antagonist, naloxone (NALO; 7.5 mg/kg BW, i.p.) diminished CB1R-dependent hyperphagic response of WIN (Fig. 3g) and ACEA (Fig. 3h). Central application of naloxone into the PVN also diminished ACEA- and WIN- evoked hyperphagia (Fig. 3i).
β-endorphin was shown to be a feed-forward presynaptic inhibitor of AgRP neuronal activity4. In line with this, 90 min after ACEA application, action potential frequency of AgRP neurons was decreased (Fig. 3j).
Taken together, we conclude that CB1R-induced acute feeding in sated mice is evoked by POMC neurons via β-endorphin release and μ-opioid receptor activation while AgRP neurons are silenced.
CB1R induces mitochondrial adaptations
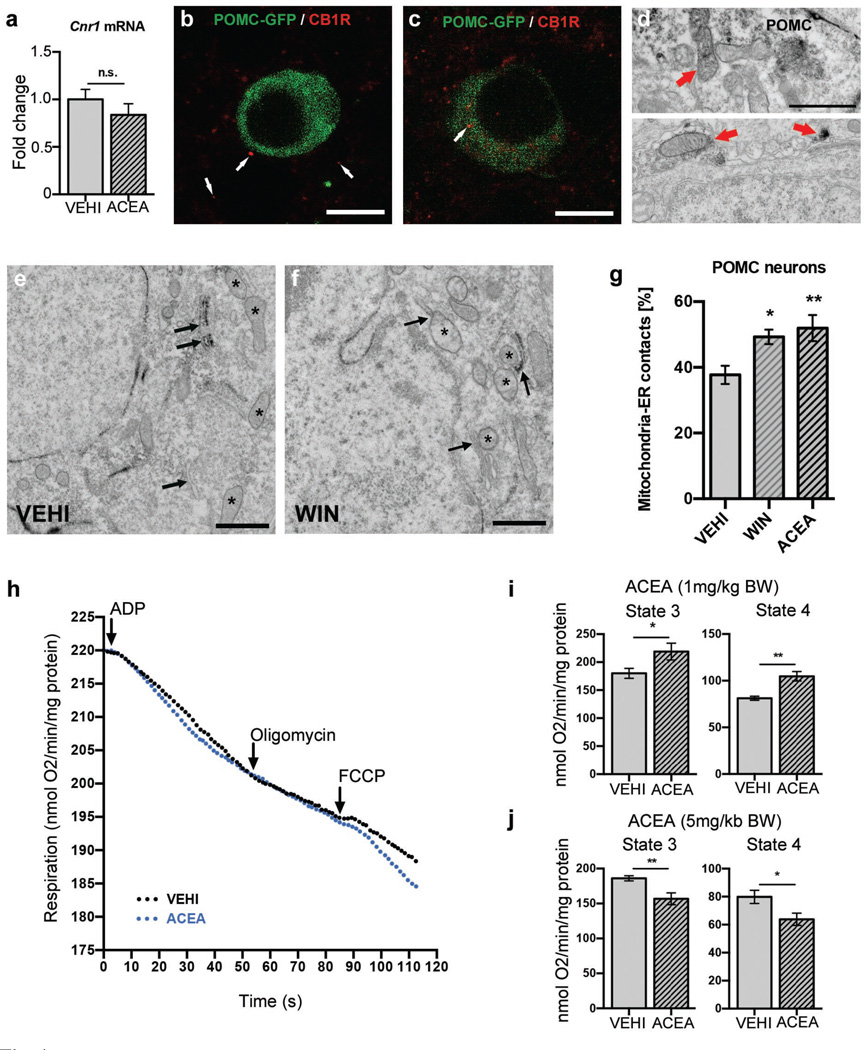
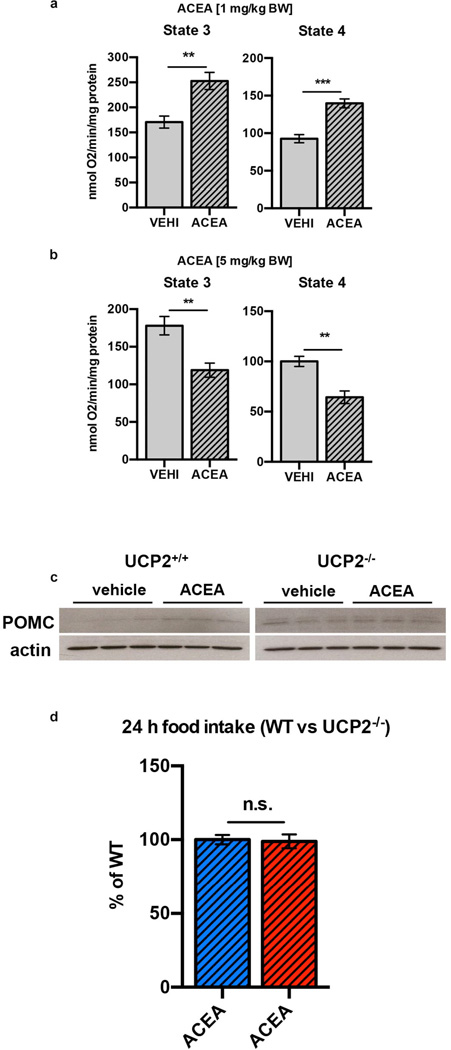
Next we explored intracellular mechanisms that may bring about changes in neuropeptide release properties of POMC cells. Real-time PCR revealed local ARC CB1R (Cnr1) expression (Fig. 4a). Immunolabeling for CB1R showed both presynaptic- and intracellular localization of CB1R in POMC neurons (Fig. 4b, c). Electron microscopy revealed presence of CB1R immunoreactivity in mitochondria of POMC cells (Fig. 4d; Extended Data Fig. 5e), a finding consistent with previous observation of CB1R in mitochondria of neurons21–25. Dynamic changes of mitochondria-endoplasmatic reticulum (ER) contacts were shown in POMC neurons in association with changes in their activity and the metabolic milieu26,27. In line with this, we found that hyperphagic activation of CB1R resulted in increased number of mitochondria-ER contacts (Fig. 4e–g). We also observed that ACEA-mediated activation of CB1R dose-dependently increased hypothalamic coupled (state 3) and uncoupled (state 4) mitochondrial respiration (Fig. 4h–j). Increased coupled mitochondrial respiration is associated with elevated generation of reactive oxygen species (ROS), which we showed previously to increase POMC neuronal activity28. Indeed, we found that hyperphagic ACEA-administration increased ROS levels in POMC neurons (Fig. 5a, b).
Fig. 4. CB1R-induces mitochondrial energetic switch in POMC neurons.
a ARC Cnr1 expression (VEHI, n=5 mice, 1.00±0.11; ACEA, n=5, 0.84±0.12, n.s. P >0.05). b CB1R (red, arrow) presynaptic to a POMC cell (GFP, green). c, d Intracellular CB1R in a POMC neuron (arrow). D Mitochondrial CB1R labeling (arrow) in POMC cell body (top) and process (bottom). e–g Increased mitochondria-ER contacts in POMC neurons by WIN and ACEA (VEHI, n=10 cells/3 mice, 37.7±2.8; WIN, n=10/3, 49.3±2.2; ACEA, n=10/3, 51.9±4; * P <0.05, ** P <0.01 vs. VEHI, P values by one-way ANOVA, followed by Dunnett’s multiple comparisons test). h, i Hyperphagic (1 mg/kg BW) ACEA treatment increased ex vivo hypothalamic mitochondrial respiration (in nmol O2/min/mg protein; state 3: VEHI, n=6 mice, 180±8.9; ACEA, n=8, 218.9±15; state 4: VEHI, 81.2±2.1; ACEA, 104.7±5; * P <0.05, ** P <0.01). j Neutral dose of ACEA (5 mg/kg BW) reduced mitochondrial respiration (state 3: VEHI, n=8, 186.1±3.7; ACEA, n=6, 156.8±8.4; state 4: VEHI, 79.9±4.7; ACEA, 63.8±4.4) All values ± s.e.m. P values (unpaired comparisons) by two-tailed Student’s t-test. Scale bars; b, c: 25 µm; d: 0.5 µm; e, f: 1 µm.
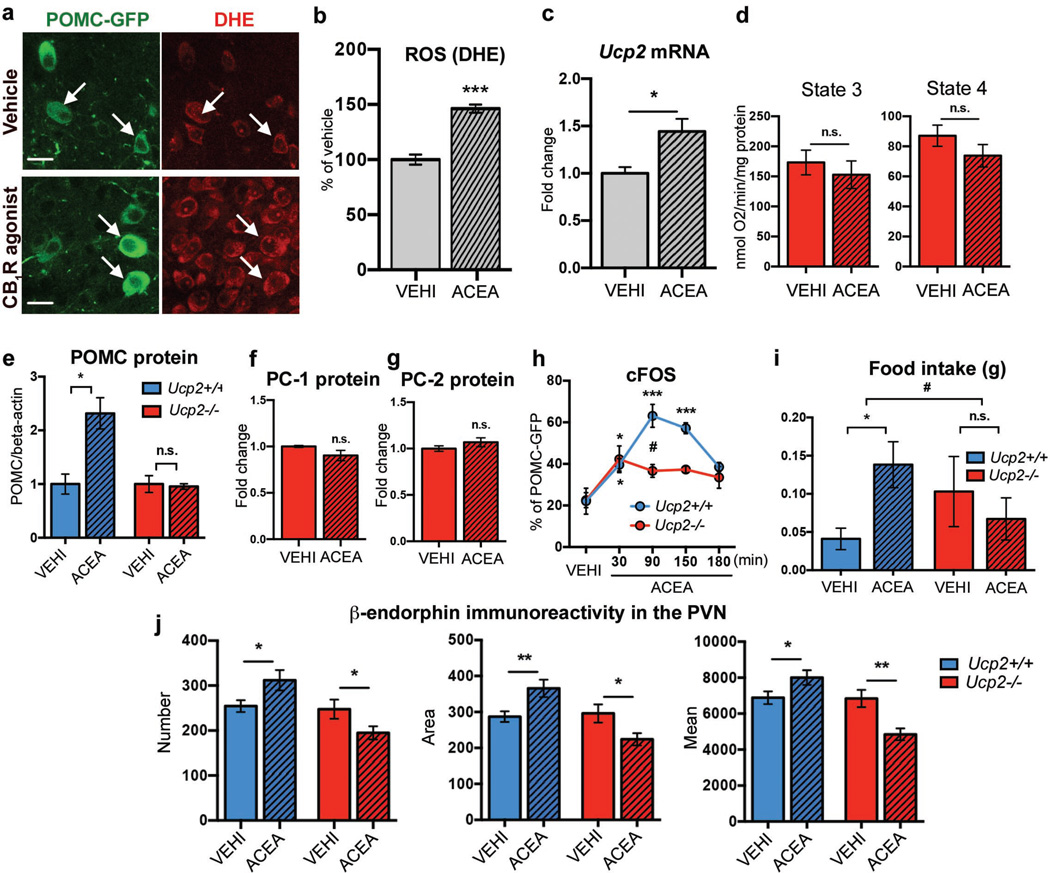
Fig. 5. CB1R-induced energetic switch in POMC neurons relies on UCP2.
a, b ACEA increased POMC-GFP ROS (DHE; VEHI, n=130 cells/7 mice, 100±4.5%; ACEA, n=248/9, 146.2±3.7%; *** P <0.001). c ACEA triggered hypothalamic Ucp2 expression (VEHI, n=5 mice, 1.00±0.07; ACEA, n=5, 1.44±0.13, * P <0.05). d No effect of ACEA on ex vivo mitochondrial respiration in Ucp2−/− mice (state 3: VEHI, n=3 mice, 172.9±20.6; ACEA, n=3, 152.9±22.9; state 4: VEHI, 87.1±7.1; ACEA, 73.8±7.5, n.s. P>0.05). e Increased POMC protein by ACEA in WT (VEHI, n=3 mice, 1.00±0.19; ACEA, n=3, 2.3±0.29, * P<0.05) but not in Ucp2−/− littermates (VEHI, n=3, 1.00±0.16; ACEA, n=3, 0.96±0.05; n.s. P>0.05). No effect of ACEA on (f) PC-1 protein (in fold change; VEHI, n=3 mice, 1.00±0.01; ACEA, n=4, 0.9±0.06, n.s. P>0.05) and (g) PC-2 protein (VEHI, n=3, 1.00±0.03; ACEA, n=4, 1.07±0.05, n.s. P>0.05) in Ucp2−/− mice. h cFOS in POMC neurons induced by ACEA in WT (VEHI, n=4 mice, 22.1±6.2%; ACEA: 30 min, n=5, 39.6±3%; 90 min, n=3, 63.1±5,5%; 150 min, n=3, 57.2±2.6%; 180 min, n=3, 38.5±2.2%; *** P<0.001 vs. VEHI, * P<0.05 vs. VEHI, P values by ordinary one-way ANOVA, followed by Dunett’s multiple comparisons test) and Ucp2−/− littermates (VEHI, n=6 mice, 22.6±3.6%; ACEA: 30 min, n=6, 42.2±6.4%; 90 min, n=6, 36.6±3.1%; 150 min, n=3, 37.3±1.6%; 180 min, n=3, 33.5±5.2%; * P<0.05 vs. VEHI, P values by ordinary one-way ANOVA, followed by Dunett’s multiple comparisons test; # P<0.05 vs. WT, ACEA 90 min, P values (unpaired comparisons) by multiple t-tests, followed by Holm-Sidak’s multiple comparisons test). i ACEA (2 h)-induced hyperphagia in WT (VEHI, n=10 mice, 0.04±0.01 g; ACEA, n=11, 0.14±0.03 g, * P<0.05) but not in Ucp2−/− littermates (VEHI, n=10 mice, 0.1±0.05 g; ACEA, n=14, 0.07±0.03 g, n.s. P>0.05, # P<0.05 for interaction between ACEA and genotypes). All values ± s.e.m. j Increased PVN β-endorphin immunoreactivity in WT littermates (bilateral PVN analysis; VEHI, n=24 values/12 sections/4 mice; 90 min ACEA, n=24/12/4); reduced PVN β-endorphin in Ucp2−/− mice (VEHI, n=18/9/3; ACEA, 18/9/3; values, see Supplementary Data Table 4; * P<0.05, ** P<0.01).
CB1R-induced energetic switch relies on UCP2
ROS is known to induce the expression and function of mitochondrial uncoupling protein 2 (UCP2)29,30, a regulator of hypothalamic mitochondrial respiration and feeding31,32. Hyperphagic activation of CB1R by ACEA increased hypothalamic expression of Ucp2 mRNA (Fig. 5c). ACEA failed to alter mitochondrial respiration in hypothalamus of UCP2 knockout mice (Ucp2−/− ; Fig. 5d). CB1R-induced changes in POMC, PC-1 and PC-2 were diminished in Ucp2−/− mice (Fig. 5e–g). While CB1R-driven POMC neuronal activation was partially retained (Fig. 5h), neither CB1R-associated feeding (Fig. 5i) nor CB1R-dependent increase of β-endorphin (Fig. 5j) was observable in Ucp2−/− mice. Thus, we conclude that UCP2 plays a critical role in mediating CB1R action on intracellular adaptation of POMC neurons while promoting feeding.
DISCUSSION
Since the discovery of the melanocortin system and its satiety promoting action via melanocortin 4 receptors33–35, POMC neurons have been considered as key drivers of cessation of feeding35–37. However, our findings unmasked an overlooked, albeit previously proposed16,38 role for hypothalamic POMC neurons in promotion of feeding. Specifically, we found that POMC neuronal activation is indispensible for appropriate promotion of feeding triggered by CB1R activation in the state of satiety. This observation brings these neurons to a new light in feeding regulation.
Cannabinoid-controlled feeding behavior is complex and likely relies on diverse mode of action11,39. We focused on a specific action of cannabinoids, which is acute feeding evoked by CB1R activation during the time of satiety. Thus, it is not unlikely that the cellular biological principles we uncovered here involving CB1R action are not ubiquitous throughout the brain relating to cannabinoids. Nevertheless, the phenomenon of cannabis-triggered feeding in a state of satiety is a hallmark of marijuana use in humans40,41, and, whether hypothalamic POMC neurons may be relevant to other aspect of the complex behavioral responses triggered by cannabis use will be important to address.
We found that cannabinoid-induced activation of POMC neurons and related feeding relies on both presynaptic modalities and mitochondrial mechanisms. Regarding the presynaptic events, it is intriguing to note that CB1R activation had a bimodal effect, in which lower doses of the CB1R agonist, ACEA, induced depolarization of POMC neurons, while higher doses hyperpolarized these cells. Because both GABAergic and glutamatergic pre-synaptic terminals on POMC neurons expressed CB1R, it is reasonable to assume that the bimodal effect of cannabinoids on feeding are due to the differential sensitivity of GABAergic versus glutamatergic axons to CB1R activation10,11.
The effect of CB1R on mitochondria, and, the mitochondrial localization of CB1R are both in line with the original observations of Marsicano and colleagues on CB1R action in other brain sites23. In the present study, we showed that this CB1R-dependent mitochondrial adaptation relies on the mitochondrial protein, UCP2. UCP2 has been associated with hypothalamic feeding circuits31,42–44, and was implicated in malfunctioning of POMC neurons in diet-induced obesity43. However, most of those studies tied UCP2 activity to lipid and glucose utilization of hypothalamic neurons32. Here, we identified UCP2 mediation being crucial for the switch from α-MSH to β-endorphin release by POMC neurons triggered by CB1R activation. This suggests a novel function of UCPs in the central nervous system whereby they control the release of specific vesicle pools of neuropeptides in POMC neurons. Whether this effect of UCP2 is specific to POMC cells or represents a novel regulatory principle for other neuronal populations that express UCP2, including the midbrain dopamine system45, needs to be explored. It is well known that a single neuron can have the capability of generating and releasing different types of neuropeptides46. How these different molecules with diverse functions are controlled within the same cells has not been fully resolved46,47. Our findings raise the possibility that changes in mitochondrial functions may be critical regulator of these processes.
In summary, the overall impact of cannabinoids on feeding appears to be driven by both pre- and postsynaptic effects, which may be independent from one another, and, it is their temporal synchrony that brings about the overall behavioral changes.
METHODS
All used mice were aged between 10 and 18 weeks at the time of killing. All procedures were approved by Yale University institutional animal care and use committee (IACUC). Mice were maintained under standard laboratory conditions with water and food freely available unless otherwise stated. Mice were housed on a 12 h light/12 h dark cycle with lights on at 7 a.m. and lights off at 7 p.m.
Mice
Pomc topaz (Pomc-GFP) transgenic mice were provided by Dr. J. Friedman (Rockefeller University, New York City, NY, USA) and generated as described earlier48. The Npy-hrGFP line (strain B6.FVB-Tg (NpyhrGFP) 1Lowl/J) and Pomc-cre line (strain Tg (Pomc1-cre) 16Lowl/J) were purchased from The Jackson Laboratories (Bar Harbor, ME, USA). Pomc-GFP and Npy-hrGFP lines are maintained on a C57BL6 background; the Pomc-cre line is maintained on a mixed background in our laboratory. The first CB1R knockout (Cnr1−/−) line used here, as maintained in a C57BL6 background, was generated (sponsored by NIMH, Bethesda, MD, USA) and genotyped as previously described49. This line was used for feeding studies (Extended Data Fig. 1c) and ELISA experiments (Fig. 3b). For generation of the second Cnr1−/− line used here, mice bearing the transcription blocking cassette flanked by loxP sites upstream of the Cnr1 start codon (Cnr1+/TB-flox) were crossed with transgenic mice expressing of Pomc-cre. Offspring expressing Cnr1TB/+, Pomc-Cre were mated with Cnr1TB/+ to obtain littermate controls (WT; Pomc-Cre::Cnr1+/+ and Cnr1+/+), CB1R knockouts controls (TB-CB1R; Cnr1TB/TB), and mice expressing CB1R only in POMC neurons (CB1RPOMC; Pomc-Cre::Cnr1TB/TB). These mice were used for specification of POMC CB1R expression and for validation of CB1R antibody specificity (Extended Data Fig. 5d). The original breeding pairs of the UCP2 knockout (Ucp2−/−) line were kindly provided by Dr. B. Lowell (Beth Israel Deaconess Medical Center and Harvard Medical School, Boston, MA, USA) and were generated as reported previously50. C57BL6 mice were purchased from The Jackson Laboratories.
Chemicals and antibodies
The selective CB1R agonist arachidonoyl 2-chloroethylamide (ACEA; Tocris Biosciences, Bristol, UK) was delivered pre-dissolved in ethanol (5 mg/mL). For central injection of ACEA, ethanol was evaporated and ACEA was re-dissolved in DMSO. The CBR agonist WIN55, 212-2 mesylate and the CB1R inverse agonist rimonabant (Cayman Chemical Company, Ann Arbor, MI, USA) were dissolved in DMSO and aliquots were stored as a stock solution of 10 mg/ml at −80° C for three month or less. At the day of use, ACEA, WIN or rimonabant was mixed with a drop of Tween 80 (Sigma-Aldrich, St. Louis, MO) prior to further dilution in saline and applied i. p. to the animals. For the vehicle group the same volume of ethanol or DMSO was applied compared to ACEA, WIN or rimonabant. The μ-opioid receptor antagonist naloxone (naloxone hydrochloride; Tocris Bioscience) was dissolved in saline (100 mg/ml) and stored at −80° C until day of use. Dihydroethidium (DHE; 10× 1mg; Life Technologies, Grand Island, NY, USA) was stored light protected at −20° C until use. Hoechst 33342 trihydrochloride, trihydrate (100 mg; Invitrogen) was stored light protected at 4° C. Virus molecules (4×10e12/ml, dialysed in 350 mM NaCl+5% D-sorbitol in PBS) containing inhibitory DREADD (rAAV5/EF1a-DIO-hM4D(Gi)-mCherry) or stimulating DREADD (rAAV5/EF1α-DIO-hM3D(Gq)-mCherry) were purchased from Gene Therapy Center Vector Core (University of North Carolina, Chapel Hill, NC, USA). Aliquots were stored at −80° C. The used primary and corresponding secondary antibodies were stored according to manufacturer’s instructions. Primary antibodies are summarized in Supplementary Data Table 1.
Immunofluorescence
After removal of food at 10 a.m. fed male mice were injected (i.p.) with vehicle, WIN (1 mg/ kg BW) or ACEA (1 or 5 mg/kg) for 90 min. Overnight fasted male mice were injected (i.p.) with vehicle or rimonabant (3 mg/kg) at 10 a.m. for 90 min. Mice were then anaesthetized by isofluorane and killed by perfusion fixation (4% paraformaldehyde (PFA) in 0.1 M phosphate-buffered saline (PB)), followed by overnight post-fixation in 4% PFA. After 30 min washing in PB, brains were cut into 50 µm-thick sections. 12 sections/mouse containing the ARC were collected. After 15 min in PB, the sections were incubated in blocking solution (1:20 normal donkey serum in PB (in case of CB1R staining using antisera derived from guinea-pig, 1:20 normal goat serum was used), containing 0.2% Triton X-100) for 30 min at RT. Primary antibodies (see Supplementary Data Table 1) were then applied overnight at RT. The next day, sections were washed 3-times (5 min) in PB and incubated with the respective secondary antibodies for 1 h at RT (donkey anti-rabbit IgG fluor 488 or 568 (dilution 1:250; cat# A-11008 or dilution 1:750; cat# A-11036); donkey anti-sheep IgG fluor 488 (dilution; 1:250, cat# A-11015); goat anti-guinea pig IgG fluor 488, 568 or 633 (dilution 1:250; cat# A-11073, dilution 1:750; cat# A-11075 or dilution 1:500; cat# A-21105); goat anti-mouse fluor 633 (dilution 1:500; cat# A-21052); Life Technologies). Finally, the sections were cover-slipped. Double immunofluorescence labeling for cFOS and POMC in Pomc-cre mice started with incubation of sections in blocking solution (see above). The anti-cFOS antibody was incubated at RT overnight. Next day, sections were incubated in biotinylated goat anti-rabbit IgG (dilution 1:250; cat# BA-1000, Vector Laboratories, Burlingame, CA, USA) for 2 h at RT. After washing in PB, sections were incubated in avidin, conjugated with alexa fluor 488 (dilution 1:2,500; cat# A-21370, Life Technologies) for 1 h at RT. After washing in PB, sections were incubated in unconjugated anti-rabbit IgG (dilution 1:25; cat# 711-005-152, Jackson ImmunoResearch Laboratories, West Grove, PA, USA) for 2 h at RT. After washing in PB, the sections were incubated with anti-POMC antibody overnight at RT. Finally, sections were incubated with goat anti rabbit alexa fluor 633 (dilution 1:750; cat# A-21070, Life Technologies) in PB for 1 h at RT. Confocal laserscanning microscopy was performed using a Zeiss LSM510 Meta (Zeiss, Gottingen, Germany), the confocal system equipped with helium neon lasers (543 and 633 nm excitation lines) and an argon laser (488 nm). Quantification of cFOS and pCREB IR in Pomc-GFP and Pomc-cre mice was performed by counting the percentage of cFOS and pCREB positive POMC-GFP or POMC-immunolabeled cells in 10 µm optical, confocal sections obtained from 50 µm-thick vibratome sections. For each mouse, at least 3–4 50 µm-thick sections containing the ARC were analyzed.
Immunocytochemistry for electron microscopy
Male C57BL6 mice were anaesthetized and transcardially perfused with 4% PFA and 0.1% glutaraldehyde. After post-fixation overnight, vibratome sections (50 µm) containing the ARC were immunostained. After overnight incubation of primary antibodies (see Supplementary Data Table 1), sections were washed, incubated with biotin-conjugated donkey anti-rabbit IgG secondary antibody (dilution 1:250; cat# 711-065-152; Jackson ImmunoResearch Laboratories) for 2 h, washed again, put in avidin-biotin complex (ABC; Vector Laboratories), and developed with 3,3- diaminobenzidine (DAB). After washing, sections were incubated in 6 nm colloidal gold-conjugated donkey ant-sheep IgG secondary antibody (dilution 1:50; cat#713-195-147; Jackson ImmunoResearch Laboratories) for 2 h. Sections were then osmicated (15 min in 1% osmium tetroxide) and dehydrated in increasing ethanol concentrations. During the dehydration, 1% uranyl acetate was added to the 70% ethanol to enhance ultrastructural membrane contrast. Flat embedding in Durcupan followed dehydration. Ultrathin sections were cut on a Leica ultra microtome, collected on Formvar-coated single-slot grids, and analyzed with a Tecnai 12 Biotwin electron microscope (FEI, Hillsboro, OR, USA).
Semi-quantitative measurements of α-MSH and β-endorphin immunostaining
Analyses of α-MSH and β-endorphin immunosignals in male mice were performed by use of imagej 1.48s software, following the online tutorial for area measurements and particle counting (http://imagej.nih.gov/ij/docs/pdfs/examples.pdf). In brief, confocal stack images (z-stacks; thickness/optical section: 6 µm, resolution: 1024 × 1024 pixels) of one side of the PVN were obtained from 50 µm-thick vibratome brain sections, using the same magnification and the same confocal microscope setup for all samples. All images from the different experimental groups in one experiment were taken within the same session at the confocal microscope (Zeiss LSM510 Meta). For z-projection, 5 optical sections from the middle area of each brain slice were used. Images were converted into grayscale (8 bit) and binary images were created. For particle analysis, the range of particle size (in pixel units) was set to resemble α-MSH and β-endorphin immunosignals in the PVN and to avoid selection of unspecific background staining. The same range of particle size was used for all samples. Finally, total numbers of selections (“number”), the sum of the size of all selections (“area”; in square pixels) and the sum of the average gray values of all selection (“mean” gray values) were calculated.
Electrophysiology
Coronal hypothalamic slices containing the ARC of male Pomc-gfp or NPY-hrGFP mice (3–4 weeks old) were prepared 90 min after in vivo saline or ACEA (1 mg/kg BW) treatment, as described previously51. In brief, mice were anesthetized with isoflurane and decapitated, the brain was rapidly removed and immersed in a cold (4° C) and oxygenated cutting solution containing (mM): sucrose 220, KCl 2.5, NaH2PO4 1.23, NaHCO3 26, CaCl21, MgCl2 6 and glucose 10 (pH 7.3 with NaOH). Coronal hypothalamic slices (300 µm thick) were cut with a Leica vibratome after the brain was trimmed to a small tissue block containing the hypothalamus. After preparation, slices were maintained at room temperature (23–25° C) in a storage chamber in the artificial cerebrospinal fluid (ACSF) (bubbled with 5% CO2 and 95% O2) containing (in mM): NaCl 124, KCl 3, CaCl2 2, MgCl2 2, NaH2PO4 1.23, NaHCO3 26, glucose 10 (pH 7.4 with NaOH) for recovery and storage. After recovery at room temperature for at least one h, slices were transferred to a recording chamber constantly perfused with bath solution (same as the ACSF except containing 2.5 mM glucose) at a temperature of 33° C and a perfusion rate of 2 ml/min for electrophysiological experiments. Whole-cell patch clamp recording was performed in Pomc-GFP and Npy-hrGFP neurons under current clamp with the methods previously reported51. Spontaneous membrane (MP) and action potential (AP) was recorded for 10 min in Pomc-GFP and Npy-hrGFP neurons from both control and ACEA-treated mice.
To test the effects of ACEA on POMC neurons in vitro, hypothalamic slices containing the ARC were prepared from naïve Pomc-gfp mice. After a stable recording of MP and AP under current clamp or membrane current under voltage clamp (at −60 mV), ACEA was applied, in the presence or absence of TTX (0.5 µM), to the recorded cells through bath application for 10 minutes. The micropipettes (4–6 MΩ) were made of borosilicate glass (World Precision Instruments) with a micropipette puller (Sutter P-97) and back filled with a pipette solution containing (mM): K-gluconate 135, MgCl2 2, HEPES 10, EGTA 1.1, Mg-ATP 2.5, Na2-GTP 0.3, and Na2-phosphocreatin 10, pH 7.3 with KOH. Both input resistance and series resistance were monitored throughout the experiments and the former was partially compensated. Only recordings with stable series resistance and input resistance were accepted. All data were sampled at 3–10 kHz, filtered at 3 kHz and analyzed with an Apple Macintosh computer using AxoGraph X (Kagi, Berkeley, CA, USA).
Behavioral test (open filed)
A slightly modified experimental regimen according to Dietrich et al 2010 was used52. The apparatus consists of a Plexiglas open field (37 cm × 37 cm × 37 cm). Male C57BL6 mice habituated for single cage housing and i.p. injection (see section “food intake measurements”), were put in the open field for 90 min after injected with vehicle or ACEA (5 mg/kg BW) and locomotor activity was monitored.
Central cannula placement
Anaesthetized (in mg/kg BW: i.p.; 30 ketamine, 6 xylazine; s.c.; 0.1 buprenorphine) 10 weeks old male C57BL6 or 12 weeks old male Pomc-gfp mice were placed into a stereotaxic apparatus (model 902; David Kopf instruments, Tujunga, CA, USA). The head was cleaned with alcohol pads and incision was made with a sterile scalpel. To place the guide acute cannula (cat# C315GA/SPC, 26 gauge, 8 mm pedestal size, 6.5 mm below pedestal; Plastics One, Roanoke, VA, USA), a single hole was drilled according to the following coordinates: ARC, Bregma, anterior-posterior: −1.2 mm, lateral: +0.25 mm; PVN, Bregma, anterior-posterior: −0.6 mm, lateral: +0.25 mm). The guided cannula was placed 1 mm dorsal to the region of interest to minimize damage of target area (ARC, Bregma, dorsal-ventral: −5.0 mm, PVN, dorsal-ventral: −4.5 mm. The cannula was fixed in place with acrylic dental cement and one anchoring skull screw. 30 min later, a dummy cannula (cat# C315DC/SPCA, cut length, 1 mm extension) was twisted onto the guided cannula. Mice were allowed to recover for one week, monitoring food intake and body weight. Mice with abnormal food intake or body weight were excluded. Mice were handled daily and habituated to the injection procedure for 5 days prior to experimental procedures. At the day of experiment, mice were held gently, while the dummy cannula was removed and the internal cannula (cat# C315IA/SPC, 33 gauge, 8 mm pedestal size, cut length, 1 mm extension) was inserted. The internal cannula was connected to a plastic tube containing a Hamilton syringe at its end, allowing free movement of mice during injection. For PVN, NALO (5 µg/0.5 µl saline, injection time 1 min) was injected 5 min before peripheral (i.p.) injection of ACEA or WIN. For ARC, ACEA (1 µg/0.5 µl saline (10% DMSO, 0.2% Tween-80); 1 min) was added. RIMO (1.25 µg/0.5 µl saline (25% DMSO, 0.2% Tween-80); 1 min) was injected 5 min before peripheral (i.p.) injection of ACEA or WIN. Internal cannula was kept in brain for another min before replacement and finally, dummy cannula was twisted onto guided cannulas and food intake was monitored for 1 and 2 h. In previous experiments equal volume injection of the fluorescent dye Hoechst 33342 (1:10 in saline) into the PVN or ARC was identified as an ideal spread of injection. After finishing food intake experiments, Hoechst 33342 was also used to assess correct cannula placement. Mice with missed target areas were excluded.
Stereotaxic virus injection
Animals were injected as described earlier3,53. In brief, bilateral virus injections were made into the ARC of anaesthetized (see section “central cannula placement”) 12 weeks old male Pomc-cre mice, placed into a stereotaxic apparatus (model 902; David Kopf instruments). 200 nl virus, containing the inhibitory DREADD (rAAV5/EF1a-DIO-hM4Di-mCherry) or the stimulating DREADD (rAAV5/EF1α-DIO-hM3Dq-mCherry) were applied into each hemisphere (coordinates: Bregma, anterior-posterior: −1.20 mm, dorsal-ventral: −5.80 mm, lateral: ±0.3 mm) by using an air pressure system (injection time 5 min). After surgery, mice were allowed to recover for 1 week and were then acclimated for food intake experiments (see section “food intake measurements”). After finishing the feeding experiments, mice were transcardially perfused and 50 µm-thick vibratome sections of the ARC were prepared. Accurate virus injection into the ARC was verified by analyzing local mCherry fluorescence. Mice with “missed” or “partial” hits were excluded. Specific (virus) expression in ARC POMC neurons was signified by double fluorescence labeling for mCherry and POMC (see section “immunofluorescence”).
Food intake measurements
One week before starting experiments, animals were allowed to habituate to single cage housing. Sham injections were performed two days before starting the experiment. At the day of experiment, single home cages were changed to avoid mice eating food that may have been deposited in the bedding of the cages. To generally minimize disposal of food, the animals were adapted to lower amounts of food (15–25 g/cage) at starting adaption to single-housing. To analyze the effect of the CB1R agonist ACEA or the CBR agonist WIN on food intake in fed animals, food was removed, new pre-weighed food pellets were applied and food intake of each single-housed animal was measured 1 h, 2 h and 24 h after i.p. injection of ACEA or WIN, compared to vehicle, respectively (injection time: 9 a.m.). To investigate whether cannabinoid (ACEA or WIN)-induced feeding is mediated via β-endorphin release, the μ-opioid receptor antagonist naloxone (7.5 mg/kg BW; i.p.) was injected 15 min prior to cannabinoid (ACEA or WIN) administration and food intake was analyzed 1 h after injection. To address the question whether CB1R inverse agonist rimonabant reduced fasting-induced re-feeding, the single-housed animals were fasted overnight before i.p. injection of 3 mg/kg rimonabant or vehicle (injection time: 9 a.m.). 15 min after rimonabant injection, a pre-weighed amount of food was placed into the cage and the food intake was then calculated for 1 h, 2 h and 24 h. At all times the cages were inspected for food spillage and those mice in cages with visible food deposits in the bedding were excluded from the studies.
Radioimmunoassay (RIA)
Male C57BL6 mice were sacrificed by decapitation and brains were immediately removed. A block of the hypothalamus was cut and a 2 mm slice of the mediobasal forebrain was made using a Leica VT1000P vibratome. Each slice was first incubated with aCSF in an incubator (37°C, 95% O2 and 5% CO2) for 1 h. This was followed by another incubation in aCSF, followed by incubation in aCSF (control) or in aCSF containing 100 nM ACEA (both groups containing 56 mM KCl) for 45 min. The supernatant was then removed and frozen for future RIA analysis. The α-MSH and the β-endorphin RIA were performed following instructions of the phoenix pharmaceutical RIA kit (α-MSH (human, rat, mouse), Cat# RK-043-01; β-endorphin (rat), Cat# RK-022-33; Burlingame, CA, USA).
ELISA
Ex vivo measurements of β-endorphin content in mediobasal hypothalamus derived from male WT and corresponding Cnr1−/− littermates was assessed by use of a commercially available β-endorphin ELISA Kit and in accordance to manufacturer’s instructions (MyBioSource, MBS703919; San Diego, CA, USA). Briefly, 30 mg of tissue was rinsed and mechanically homogenized in PBS. After two freeze-thaw cycles, the homogenates were centrifuged for 5 min at 5000 × g and 4° C. The supernatant was removed and assayed immediately. In parallel, sample protein concentrations were measured using the BCA kit (Thermo scientific, Cat# 23228 and 1859078), and β-endorphin content was calculated as ng β-endorphin / mg protein.
qPCR and Western Blot analyses
Food was removed from cages of fed mice. Male C57BL6 mice were then treated with vehicle or ACEA (1 mg/kg BW, i.p.) as described above. After 90 min, the mediobasal hypothalamus was rapidly collected and snap frozen in liquid nitrogen. Total RNA was extracted using TRIzol (Life Technologies) according to manufacturer’s instructions. cDNA was synthesized by First-Strand cDNA Kit (Amersham Biosciences, Piscataway, NJ, USA) following the manufacturer’s instructions. Real-time PCR (Light Cycler 480 System, Roche, Indianapolis, IN, USA) was performed using TaqMan gene expression assay for Psck1, Pcsk2, Ucp2 and Cnr1 (Mm00479023_m1, cat# 4331182; Mm00500981_m1, cat# 4331182; Mm00627599_m1, cat# 4331182; Mm01212171_s1, cat# 4331182; Life Technologies). Beta-actin (mouse ACTB, cat# 4352341; Life Technologies) was used as housekeeping gene.
Micro-punched ARC from fed male C57BL6 mice, either treated with vehicle or ACEA (1 mg/kg BW, i.p.) for 90 min after removal of food, were isolated and lysed in modified RIPA buffer (50 mM Tris-HCl, pH 7.5; 150 mM NaCl, 1mM EDTA, 1% NP-40, 0.1% SDS, 1 mM PMSF), supplemented with protease inhibitor cocktail (Roche, Cat# 11 836 170 001), on ice for 30 min followed by centrifugation at 14,000 rpm for 15 min. Protein concentrations were measured using the BCA kit (Thermo scientific). Proteins were resolved on 8% SDS-PAGE and transferred to PVDF membrane (Millipore, Cat# IPVH 15150). Membranes were blocked with 5% dry milk in TBS (50mM Tris-HCl, pH 7.5; 150 mM NaCl) for 1 h and then followed by overnight incubation at 4° C with first antibodies (see Supplementary Data Table 1). After 3 times washing with TBST (TBS plus 0.05% Tween 20), membranes were incubated with antirabbit IgG conjugated to horseradish peroxidase (Santa Cruz Biotechnology, Cat# sc-2004) for 1 h and developed by ECL kit (Thermo scientific, Cat# 32016). Membranes were reused to detect beta-actin (see Supplementary Data Table 1) after stripping with Restore™ PLUS Western Blot stripping buffer (cat# 46430, Thermo Fisher Scientific Inc, Waltham, MA, USA). The relative protein amount of PC-1, PC-2 and POMC in each sample was calculated from the respective beta-actin immunosignal.
ROS measurement
After removal of food at 10 a.m., fed age- and weight-matched littermates of male and female Pomc-GFP mice were injected with vehicle or 1 mg/kg ACEA (i.p.) for 90 min. Dihydroethidium (DHE; 10 mg) was dissolved in 200 µl of DMSO 5 min before injection and kept light protected at RT. 240 µl of warm (42° C) PBS were slowly mixed with 60 µl DHE solution, and 200 µl of the DHE solution (1 mg/ml in 20% DMSO) were injected via the tail vein 45 min before the animals were anaesthetized by isofluorane and killed by perfusion fixation (4% paraformaldehyde (PFA) in 0.1 M phosphate-buffered saline (PB)). After post-fixation in 4% PFA overnight, the brains were washed in PB for 30 min and coronal brain sections (50 µm) of the ARC were obtained using a Leica VT1000P vibratome (Leica Microsystems, Wetzlar, Germany). The slices were mounted on glass slides and cover-slipped using DAKO fluorescence mounting medium (Dako North America, Carpinteria, CA, USA) and kept at 4° C for no longer than 1 day. Confocal images were taken by use of an Olympus FV 300 Laserscanning microscope (Olympus Corporation of the Americas, Center Valley, PA, USA). Semi-quantitative analysis of the DHE signal in Pomc-GFP labeled cells was performed by determine the mean dens area of the DHE signal in the respective GFP positive neuron, using imagej 1.48s software (Rasband, W.S., ImageJ, U. S. National Institutes of Health, Bethesda, Maryland, USA, http://imagej.nih.gov/ij/, 1997–2014). To avoid false-positive results, the autofluorescence in animals that were injected with saline instead of DHE was subtracted from the DHE obtained values.
Brain tissue fractionation
Mouse brain homogenates were purified using a differential centrifugation method described earlier54. After removal of food from cages, mice were injected with vehicle or ACEA for 90 min. For isolation of mitochondria-enriched fractions, male and female C57BL6, UCP2−/− and corresponding WT littermates were killed and both, the hippocampus and the hypothalamus were immediately dissected from brains and put on ice. Tissue was manually homogenized at 4° C in 10 ml of isolation buffer containing 225 mM mannitol, 75 mM sucrose, 5 mM HEPES, 1 mM EGTA, 1 mg/ml BSA and 0.3125 mg/ml protease type VIII (Sigma-Aldrich) at pH 7.4. The homogenate was brought to 20 ml final volume and centrifuged at 2,000×g for 5 min. The pellet, including the synaptosomal layer was re-suspended in 10 ml of the isolation buffer now containing 0.02 % (w/v) digitonin and centrifuged at 12,000×g for 10 min. The pellet without the synaptosomal layer was re-suspended in 10 ml of isolation buffer and centrifuged at 12,000×g for 10 min. The pellet was finally re-suspended in 50 µl of a buffer containing 225 mM mannitol, 75 mM sucrose, 5 mM HEPES at pH 7.4.
Ex vivo mitochondrial respiration
Protein concentrations of mitochondrial preparations were determined with a BCA protein assay kit (Perbio, Rockford, IL, USA). For mitochondrial respiration analyzes, 0.5 mg/ml protein was added into the reaction chamber of a Clark type oxygen electrode (Hansatech Instruments, Norfolk, UK) which has been set to 37° C and filled with 1 ml respiration buffer (100 mM sucrose, 5 mM HEPES, 100 mM KCl, 2 mM KH2PO4 and 10 mM EGTA, pH=7.4). Pyruvate (5 mM) and malate (2.5 mM) were then added concomitantly as the oxidative substrates. To determine ADP-dependent (state 3) respiration, ADP (2.5 mM) was added. After the ADP was exhausted, oligomycin (1 µM) was applied to analyze respiration independently of phosphorylation (state 4 activity).
Statistics
Statistical analyses were performed by use of Prism 6.0 software (Graph Pad, San Diego, CA, USA). P values for unpaired comparisons between two groups were calculated by two-tailed student’s t-test. One-way ANOVA, followed by Dunnett’s multiple comparisons test (all groups against vehicle-treated control group) was used for comparisons between three or more groups. Ordinary two-way ANOVA was used to examine how food intake was affected by two factors. Interactions between the following treatments were tested: CNO against ACEA or WIN; RIMO against ACEA or WIN; NALO against ACEA or WIN. * P <0.05, ** P <0.01, *** P <0.001. Error bars indicate mean ± s.e.m.
Extended Data
Extended Data Fig. 1. Characterization of CB1R-dependent food intake.
a Bimodal effects of different ACEA doses on food intake in fed mice (VEHI, n=23 mice, 100±16.3%; ACEA (in mg/kg BW, i.p.): 0.1, n=8, 104.5±46.6%; 0.5, n=3, 190.8±40.4%; 1.0, n=19, 196.7±30%; 2.5, n=16, 87.1±18%; 5.0, n=11, 59.2±15.5%; * P<0.05 vs. VEHI, P values by ordinary one-way ANOVA, followed by Dunett’s multiple comparisons test). b Neutral dose of ACEA on feeding (5 mg/kg BW, i.p.) did not alter locomotor activity of fed mice (n.s. P>0.05). c Impaired feeding response to ACEA (1 mg/kg BW, i.p.) in CB1R-heterozygote (Cnr1+/−, n=6 mice, 1 h: 0.04±0.01 g, 2 h: 0.07±0.01 g) and CB1R-deficient (Cnr1−/−, 1 h: n=6, 0.02±0.01 g, 2 h: n=4, 0.03±0.01 g) mice, when compared to CB1R-WT mice (Cnr1+/+, 1 h: n=12, 0.13±0.01 g, 2 h: n=4, 0.18±0.04 g; *** P<0.001, ** P<0.01 vs. Cnr1+/+, respectively). d Central, local ACEA injection into the ARC induced food intake (VEHI, n=4 mice, 1 h: 0.05±0.03 g, 2 h: 0.12±0.01 g; ACEA, n=4, 1 h: 0.25±0.03 g; 2 h: 0.43±0.05 g; ** P<0.01, *** P<0.001). e Verification of correct ARC cannula placement by HOECHST (blue) injection. f Hyperphagic CB1R activation (1 mg/kg BW ACEA, i.p.) was abolished by central, local ARC RIMO-mediated CB1R blockade (VEHI+VEHI, n=8 mice, 0.05±0.01 g; VEHI+ACEA, n=8, 0.15±0.02 g; RIMO+VEHI, n=8, 0.09±0.02 g; RIMO+ACEA, n=8, 0.09±0.02 g; * P<0.001, n.s. P>0.05, # P<0.05 for interaction between RIMO and ACEA, P values by ordinary two-way ANOVA, followed by Sidak’s multiple comparisons test). g Hyperphagic CB1R activation (1 mg/kg BW WIN, i.p.) was reduced by local ARC RIMO-mediated CB1R blockade (VEHI+WIN, n=8 mice, 0.21±0.03 g; RIMO+WIN, n=8, 0.1±0.02 g; ** P<0.01). h RIMO-induced hypophagic blockade of CB1R in fasted mice (VEHI, n=10 mice, 1 h: 0.76±0.07 g, 2 h: 1.18±0.07 g; RIMO, n=11 mice, 1 h: 0.42±0.05 g, 2 h: 0.75±0.08 g; ** P<0.01, *** P<0.001). All quantified results ± s.e.m. If not otherwise stated, P values (unpaired comparisons) by two-tailed Student’s t-test. Scale bars; 25 µm.
Extended Data Fig. 2. DREADD-mediated regulation of POMC neurons.
a Selective DREADD expression specified by local ARC mCherry fluorescence. b POMC neurons (green) contain mCherry-labeled DREADD (red, arrowheads). c CNO-activated inhibitory DREADD reduced ARC cFOS immunolabeled neurons in fed mice (arrowheads). d, e CNO-activated inhibitory DREADD blocked ACEA-induced POMC activation (cFOS; VEH+ACEA, n=6 mice, 60.4±3.6%; CNO+ACEA, n=5, 32.3±2.5%). f CNO-activated POMC-specific inhibitory DREADD did not acutely affect feeding but enhanced it after 8 hours (VEH, n=17 mice, 0.42±0.04 g; CNO, n=16, 0.58±0.04 g; 24 hours-post injection: VEH, n=5 mice, 2.57±0.07 g; CNO, n=5, 3.37±0.18 g; ** P<0.01 vs. VEH, respectively). g CNO-activated POMC-specific stimulating DREADD did not acutely affect feeding but reduced it after 8 hours (VEH, n=6 mice, 0.58±0.05 g; CNO, n=6, 0.34±0.05 g; ** P<0.01 vs. VEH; 24 hours-post injection: VEH, n=6 mice, 3.96±0.15 g; CNO, 3.65±0.21 g; n.s. P>0.05 vs. VEH). All quantified results ± s.e.m. If not otherwise stated, P values (unpaired comparisons) by two-tailed Student’s t-test.
Extended Data Fig. 3. Hyperphagic CB1R activation selectively increased PVN β-endorphin.
a–d, i PVN α-MSH remained unchanged after hyperphagic CB1R activation (PVN unilateral analysis; VEHI, n=6 values/6 sections/3 mice; 60 min ACEA, n=10/10/5; 90 min ACEA, n=6/6/3; values, see Extended Data Table 1a). e–h, j In contrast, hyperphagic ACEA increased PVN β-endorphin (β-END) 60 and 90 min following application (PVN unilateral analysis; VEHI, n=13 values/13 sections/6 mice; 60 min ACEA, n=4/4/4; 90 min ACEA, n=14/14/7; values, see Extended Data Table 1b; *** P<0.001, * P<0.05 vs. VEHI, P values by one-way ANOVA, followed by Dunnett’s multiple comparisons test). Scale bars; 25 µm.
Extended Data Fig. 4. Bimodal character of ARC CB1R-driven β-endorphin increase.
a Compared to VEHI (bilateral PVN analysis; n=22 values/11 sections/4 mice), hyperphagic doses (1 mg/kg BW, respectively) of WIN (n=24/12/4) or ACEA (n=18/9/3) induced PVN β-endorphin immunoreactivity. Neutral dose (5 mg/kg BW) of ACEA (n=18/9/3) on feeding showed no effects (all values, see Supplementary Data Table 2). b Representative binary images of β-endorphin immunoreactivity after thresholding (image segmentation) using imagej software (for more details, see methods). c Compared to VEHI (unilateral PVN analysis; n=4 mice, 2–3 section/mouse), central, hyperphagic local ARC injection of ACEA (n=5 mice, 3 sections/mouse) increased PVN β-endorphin immunoreactivity (all values, see Supplementary Data Table 3). All quantified results ± s.e.m. If not otherwise stated, P values (unpaired comparisons) by two-tailed Student’s t-test. Scale bars; 100 µm.
Extended Data Fig. 5. Post-transcriptional regulation of hypothalamic pro-protein convertases, presence of CB1R in POMC neurons and Cnr1 expression in Ucp2−/− mice.
a, b ACEA did not affect transcripts of pro-protein convertases 1 (Pcsk1) and 2 (Pcsk2) (in fold change; Pcsk1: VEHI, n=11 mice, 1.00±0.07; ACEA, n=10 mice, 1.17±0.09; Pcsk2: VEHI, n=11 mice, 1.00±0.13; ACEA, n=11 mice, 1.14±0.19; n.s. P>0.05). c Representative Western Blot membranes for PC-1 (~80 kDa) and PC-2 (~72 kDa) immunolabeling. d Equal Cnr1 expression in WT and UCP2−/− mice (in fold change: all groups n=6 mice; WT, 1.00±0.1; UCP2−/−, 0.98±0.12; n.s. P>0.05). e We have previously shown that antibodies raised against CB1R also recognized the mitochondrial protein, stomatin-like protein 221. In line with this, mitochondrial labeling of CB1R was found substantially diminished but not completely eliminated in CB1R-KO (Cnr1−/−) mice23–25. We observed that in contrast to wild type animals (Cnr1+/+ mice), which showed ~80% (77/97, 79.5±3.9%) of POMC neurons (red fluorescence) to contain labeling with the CB1R antisera (green fluorescence), in CB1R-KO (Cnr1−/− mice), less than 30% (37/128, 29.2±3.3%) of POMC neurons retained immunolabeling. Thus, we concluded that a large population of POMC neurons contains CB1R. All quantified results ± s.e.m. If not otherwise stated, P values (unpaired comparisons) by two-tailed Student’s t-test. Scale bar; 25 µm.
Extended Data Fig. 6. Bimodal CB1R-dependent regulation of mitochondrial respiration and UCP2-dependent control of POMC.
a, b Bimodal CB1R-controlled mitochondrial respiration in hippocampus. a Hyperphagic (1 mg/kg BW ACEA, i.p.) CB1R activation increased ex vivo mitochondrial respiration (in nmol O2/min/mg protein; state 3: VEHI, n=6 mice, 170.7±12; ACEA, n=8, 252.7±17.2; state 4: VEHI, 92.7±5.4; ACEA, 139.7±6; ** P<0.01, *** P<0.001). b Neutral dose of ACEA on feeding (5 mg/kg BW, i.p.) reduced mitochondrial respiration (state 3: VEHI, n=7 mice, 178.2±12.2; ACEA, n=5, 118.9±9.4; state 4: VEHI, 100±5.1; ACEA, 64.3±6.3). c Representative Western Blot membranes for POMC (pro-POMC, ~31 kDa; POMC, ~27 kDa). d 24-hour food intake did not differ between WT (n=28 mice, 100±3.2%) and Ucp2−/− mice (n=29, 98.9±4.7%; n.s. P>0.05) after ACEA (1 mg/kg BW, i.p.) treatment. All quantified results ± s.e.m. If not otherwise stated, P values (unpaired comparisons) by two-tailed Student’s t-test.
Extended Data Table 1.
| a: Semi-quantitative measurements of α-MSH immunoreactivity (see Extended Data Fig. 3a–d, i). | |||
|---|---|---|---|
| α-MSH in PVN | Total number | Total area | Mean area |
| VEHI | 277.5±21 | 392.9±30.4 | 41691±3627 |
| 60 min ACEA | 235.5±34 | 327.1±56 | 33244±5291 |
| 90 min ACEA | 284±26.5 | 377.6±41.3 | 39751±3861 |
| b: Semi-quantitative measurements of β-endorphin immunoreactivity (see Extended Data Fig. 3e–h, j; | |||
|---|---|---|---|
| β-END in PVN | Total number | Total area | Mean area |
| VEHI | 134.9±12.4 | 289.9±28.2 | 8774±1048 |
| 60 min ACEA | 348.5±44*** | 863.2±103.6*** | 18468±813.5*** |
| 90 min ACEA | 201.2±18.3* | 446.8±42.4* | 12935±1362* |
P<0.01,
P<0.001 vs. VEHI).
Extended Data Table 2.
Semi-quantitative measurements of β-endorphin immunoreactivity (see Extended Data Fig. 4a;
| β-END in PVN | Total number | Total area | Mean area |
|---|---|---|---|
| VEHI | 144±4.8 | 403.7±17.2 | 1838±121.4 |
| 90 min WIN (1 mg/kg BW) | 170.8±4.4*** | 497.6±15.1*** | 2308±154.3 |
| 90 min ACEA (1 mg/kg BW) | 177.3±3.9*** | 477±8.4** | 2528±104.2 |
| 90 min ACEA (5 mg/kg BW) | 144.2±5.7 | 407.9±17.9 | 1885±154.8 |
P<0.05,
P<0.01,
P<0.001 vs. VEHI).
Extended Data Table 3.
Semi-quantitative measurements of β-endorphin immunoreactivity (see Extended Data Fig. 4c;
| β-END in PVN | Total number | Total area | Mean area |
|---|---|---|---|
| VEHI | 136.7±19.9 | 294.3. ±47.7 | 8205±1550 |
| 60 min ACEA | 480±81.6** | 1235±235* | 36526±7431* |
P<0.05,
P<0.01 vs. VEHI).
Extended Data Table 4.
Semi-quantitative measurements of β-endorphin immunoreactivity (see Fig. 5j;
| β-END in PVN | Total number | Total area | Mean area |
|---|---|---|---|
| WT - VEHI | 254.5±13.2 | 287.1±14.8 | 6885±352.7 |
| WT - 90 min ACEA | 311.9±22.6* | 365.6±24.1** | 8007±407.4* |
| Ucp2−/− - VEHI | 247.4±21.3 | 296±25.2 | 6840±478.3 |
| Ucp2−/− −90 min ACEA | 194.7±14.6* | 224±16.9* | 4849±328.2** |
P<0.05,
P<0.01 vs. WT - VEHI or Ucp2−/− - VEHI, respectively).
Supplementary Material
ACKNOWLEDGEMENT
The authors thank Marya Shanabrough and Jeremy Bober for technical support and Robert Jakab for assisting with the illustrations. This work was supported by the US National Institutes of Health (DP1 DK098058, R01 DK097566, R01 AG040236, and P01 NS062686), the American Diabetes Association, The Klarmann Family Foundation, the Helmholtz Society (ICEMED) and the Deutsche Forschungsgemeinschaft SFB 1052/1 (Obesity Mechanisms).
Footnotes
The authors do not declare any financial interest.
AUTHOR’S CONTRIBUTION
M.K., S.D. and T.L.H. developed the conceptual framework of this study. M.K., M.O.D., X.-B.G., S.D. and T.L.H. interpreted results. M.K. performed experiments and analyzed results. Experimental contributions: L.V. contributed to Fig. 4h-j; Fig. 5d; Extended Data Fig. 1b; Extended Data Fig. 5d; Extended Data Fig. 6a, b; J.G.K. contributed to Fig. 2e, f; Fig. 3i; Fig. 5a, b; Extended Data Fig. 2g; J.D.K. contributed to Fig. 3b–d; Fig. 5e–g; Extended Data Fig. 5c; Extended Data Fig. 6c; F.H. contributed to Fig. 4a; Fig. 5c; Extended Data Fig. 5a, b, e; S.E.S. contributed to Fig. 3a; C.M.C., C.R.V. and J.K.E. provided key animal models; Y.M.M. and P.R. contributed to Fig. 3b; Extended Data Fig. 1c; P.R., I.B. and M.A.C. provided materials, animals and equipment; K.S-B. contributed to Fig. 3f; Fig. 4d–g; X.-B.G. contributed to Fig. 1c, d1–d3; Fig. 3j. M.K. and T.L.H. wrote the paper.
REFERENCES
- 1.Dietrich MO, Horvath TL. Hypothalamic control of energy balance: insights into the role of synaptic plasticity. Trends in neurosciences. 2013;36:65–73. doi: 10.1016/j.tins.2012.12.005. [DOI] [PubMed] [Google Scholar]
- 2.Aponte Y, Atasoy D, Sternson SM. AGRP neurons are sufficient to orchestrate feeding behavior rapidly and without training. Nature neuroscience. 2011;14:351–355. doi: 10.1038/nn.2739. [DOI] [PMC free article] [PubMed] [Google Scholar]
- 3.Krashes MJ, et al. Rapid, reversible activation of AgRP neurons drives feeding behavior in mice. The Journal of clinical investigation. 2011;121:1424–1428. doi: 10.1172/JCI46229. [DOI] [PMC free article] [PubMed] [Google Scholar]
- 4.Yang Y, Atasoy D, Su HH, Sternson SM. Hunger states switch a flip-flop memory circuit via a synaptic AMPK-dependent positive feedback loop. Cell. 2011;146:992–1003. doi: 10.1016/j.cell.2011.07.039. [DOI] [PMC free article] [PubMed] [Google Scholar]
- 5.DiPatrizio NV, Piomelli D. The thrifty lipids: endocannabinoids and the neural control of energy conservation. Trends in neurosciences. 2012;35:403–411. doi: 10.1016/j.tins.2012.04.006. [DOI] [PMC free article] [PubMed] [Google Scholar]
- 6.Bermudez-Silva FJ, Cardinal P, Cota D. The role of the endocannabinoid system in the neuroendocrine regulation of energy balance. Journal of psychopharmacology. 2012;26:114–124. doi: 10.1177/0269881111408458. [DOI] [PubMed] [Google Scholar]
- 7.Sinnayah P, et al. Feeding induced by cannabinoids is mediated independently of the melanocortin system. PloS one. 2008;3:e2202. doi: 10.1371/journal.pone.0002202. [DOI] [PMC free article] [PubMed] [Google Scholar]
- 8.Bakkali-Kassemi L, et al. Effects of cannabinoids on neuropeptide Y and beta-endorphin expression in the rat hypothalamic arcuate nucleus. The British journal of nutrition. 2011;105:654–660. doi: 10.1017/S0007114510004095. [DOI] [PubMed] [Google Scholar]
- 9.Ho J, Cox JM, Wagner EJ. Cannabinoid-induced hyperphagia: correlation with inhibition of proopiomelanocortin neurons? Physiology & behavior. 2007;92:507–519. doi: 10.1016/j.physbeh.2007.04.028. [DOI] [PMC free article] [PubMed] [Google Scholar]
- 10.Hentges ST, Low MJ, Williams JT. Differential regulation of synaptic inputs by constitutively released endocannabinoids and exogenous cannabinoids. The Journal of neuroscience : the official journal of the Society for Neuroscience. 2005;25:9746–9751. doi: 10.1523/JNEUROSCI.2769-05.2005. [DOI] [PMC free article] [PubMed] [Google Scholar]
- 11.Bellocchio L, et al. Bimodal control of stimulated food intake by the endocannabinoid system. Nature neuroscience. 2010;13:281–283. doi: 10.1038/nn.2494. [DOI] [PubMed] [Google Scholar]
- 12.Hentges ST. Synaptic regulation of proopiomelanocortin neurons can occur distal to the arcuate nucleus. Journal of neurophysiology. 2007;97:3298–3304. doi: 10.1152/jn.00051.2007. [DOI] [PubMed] [Google Scholar]
- 13.Zhan C, et al. Acute and long-term suppression of feeding behavior by POMC neurons in the brainstem and hypothalamus, respectively. The Journal of neuroscience : the official journal of the Society for Neuroscience. 2013;33:3624–3632. doi: 10.1523/JNEUROSCI.2742-12.2013. [DOI] [PMC free article] [PubMed] [Google Scholar]
- 14.Dores RM, Baron AJ. Evolution of POMC: origin, phylogeny, posttranslational processing, and the melanocortins. Annals of the New York Academy of Sciences. 2011;1220:34–48. doi: 10.1111/j.1749-6632.2010.05928.x. [DOI] [PubMed] [Google Scholar]
- 15.Dube MG, Horvath TL, Leranth C, Kalra PS, Kalra SP. Naloxone reduces the feeding evoked by intracerebroventricular galanin injection. Physiology & behavior. 1994;56:811–813. doi: 10.1016/0031-9384(94)90247-x. [DOI] [PubMed] [Google Scholar]
- 16.Kalra SP, Horvath TL. Neuroendocrine interactions between galanin, opioids, and neuropeptide Y in the control of reproduction and appetite. Annals of the New York Academy of Sciences. 1998;863:236–240. doi: 10.1111/j.1749-6632.1998.tb10698.x. [DOI] [PubMed] [Google Scholar]
- 17.Mountjoy KG, Mortrud MT, Low MJ, Simerly RB, Cone RD. Localization of the melanocortin-4 receptor (MC4-R) in neuroendocrine and autonomic control circuits in the brain. Molecular endocrinology. 1994;8:1298–1308. doi: 10.1210/mend.8.10.7854347. [DOI] [PubMed] [Google Scholar]
- 18.Balthasar N, et al. Divergence of melanocortin pathways in the control of food intake and energy expenditure. Cell. 2005;123:493–505. doi: 10.1016/j.cell.2005.08.035. [DOI] [PubMed] [Google Scholar]
- 19.Leibowitz SF, Hor L. Endorphinergic and alpha-noradrenergic systems in the paraventricular nucleus: effects on eating behavior. Peptides. 1982;3:421–428. doi: 10.1016/0196-9781(82)90102-4. [DOI] [PubMed] [Google Scholar]
- 20.Leibowitz SF. Brain neurotransmitters and appetite regulation. Psychopharmacology bulletin. 1985;21:412–418. [PubMed] [Google Scholar]
- 21.Morozov YM, et al. Antibodies to cannabinoid type 1 receptor co-react with stomatin-like protein 2 in mouse brain mitochondria. The European journal of neuroscience. 2013;38:2341–2348. doi: 10.1111/ejn.12237. [DOI] [PMC free article] [PubMed] [Google Scholar]
- 22.Morozov YM, Horvath TL, Rakic P. A tale of two methods: Identifying neuronal CB1 receptors. Molecular metabolism. 2014;3:338. doi: 10.1016/j.molmet.2014.03.006. [DOI] [PMC free article] [PubMed] [Google Scholar]
- 23.Benard G, et al. Mitochondrial CB(1) receptors regulate neuronal energy metabolism. Nature neuroscience. 2012;15:558–564. doi: 10.1038/nn.3053. [DOI] [PubMed] [Google Scholar]
- 24.Hebert-Chatelain E, et al. Studying mitochondrial CB1 receptors: Yes we can. Molecular metabolism. 2014;3:339. doi: 10.1016/j.molmet.2014.03.008. [DOI] [PMC free article] [PubMed] [Google Scholar]
- 25.Hebert-Chatelain E, et al. Cannabinoid control of brain bioenergetics: Exploring the subcellular localization of the CB1 receptor. Molecular metabolism. 2014;3:495–504. doi: 10.1016/j.molmet.2014.03.007. [DOI] [PMC free article] [PubMed] [Google Scholar]
- 26.Schneeberger M, et al. Mitofusin 2 in POMC neurons connects ER stress with leptin resistance and energy imbalance. Cell. 2013;155:172–187. doi: 10.1016/j.cell.2013.09.003. [DOI] [PMC free article] [PubMed] [Google Scholar]
- 27.Nasrallah CM, Horvath TL. Mitochondrial dynamics in the central regulation of metabolism. Nature reviews. Endocrinology. 2014;10:650–658. doi: 10.1038/nrendo.2014.160. [DOI] [PubMed] [Google Scholar]
- 28.Diano S, et al. Peroxisome proliferation-associated control of reactive oxygen species sets melanocortin tone and feeding in diet-induced obesity. Nature medicine. 2011;17:1121–1127. doi: 10.1038/nm.2421. [DOI] [PMC free article] [PubMed] [Google Scholar]
- 29.Negre-Salvayre A, et al. A role for uncoupling protein-2 as a regulator of mitochondrial hydrogen peroxide generation. FASEB journal : official publication of the Federation of American Societies for Experimental Biology. 1997;11:809–815. [PubMed] [Google Scholar]
- 30.Echtay KS, et al. Superoxide activates mitochondrial uncoupling proteins. Nature. 2002;415:96–99. doi: 10.1038/415096a. [DOI] [PubMed] [Google Scholar]
- 31.Andrews ZB, et al. UCP2 mediates ghrelin's action on NPY/AgRP neurons by lowering free radicals. Nature. 2008;454:846–851. doi: 10.1038/nature07181. [DOI] [PMC free article] [PubMed] [Google Scholar]
- 32.Diano S, Horvath TL. Mitochondrial uncoupling protein 2 (UCP2) in glucose and lipid metabolism. Trends in molecular medicine. 2012;18:52–58. doi: 10.1016/j.molmed.2011.08.003. [DOI] [PubMed] [Google Scholar]
- 33.Huszar D, et al. Targeted disruption of the melanocortin-4 receptor results in obesity in mice. Cell. 1997;88:131–141. doi: 10.1016/s0092-8674(00)81865-6. [DOI] [PubMed] [Google Scholar]
- 34.Fan W, Boston BA, Kesterson RA, Hruby VJ, Cone RD. Role of melanocortinergic neurons in feeding and the agouti obesity syndrome. Nature. 1997;385:165–168. doi: 10.1038/385165a0. [DOI] [PubMed] [Google Scholar]
- 35.Cone RD. Anatomy and regulation of the central melanocortin system. Nature neuroscience. 2005;8:571–578. doi: 10.1038/nn1455. [DOI] [PubMed] [Google Scholar]
- 36.Elias CF, et al. Leptin differentially regulates NPY and POMC neurons projecting to the lateral hypothalamic area. Neuron. 1999;23:775–786. doi: 10.1016/s0896-6273(01)80035-0. [DOI] [PubMed] [Google Scholar]
- 37.Cowley MA, et al. Leptin activates anorexigenic POMC neurons through a neural network in the arcuate nucleus. Nature. 2001;411:480–484. doi: 10.1038/35078085. [DOI] [PubMed] [Google Scholar]
- 38.Horvath TL, Naftolin F, Kalra SP, Leranth C. Neuropeptide-Y innervation of beta-endorphin-containing cells in the rat mediobasal hypothalamus: a light and electron microscopic double immunostaining analysis. Endocrinology. 1992;131:2461–2467. doi: 10.1210/endo.131.5.1425443. [DOI] [PubMed] [Google Scholar]
- 39.Soria-Gomez E, et al. The endocannabinoid system controls food intake via olfactory processes. Nature neuroscience. 2014;17:407–415. doi: 10.1038/nn.3647. [DOI] [PubMed] [Google Scholar]
- 40.Greenberg I, Kuehnle J, Mendelson JH, Bernstein JG. Effects of marihuana use on body weight and caloric intake in humans. Psychopharmacology. 1976;49:79–84. doi: 10.1007/BF00427475. [DOI] [PubMed] [Google Scholar]
- 41.Foltin RW, Brady JV, Fischman MW. Behavioral analysis of marijuana effects on food intake in humans. Pharmacology, biochemistry, and behavior. 1986;25:577–582. doi: 10.1016/0091-3057(86)90144-9. [DOI] [PubMed] [Google Scholar]
- 42.Coppola A, et al. A central thermogenic-like mechanism in feeding regulation: an interplay between arcuate nucleus T3 and UCP2. Cell metabolism. 2007;5:21–33. doi: 10.1016/j.cmet.2006.12.002. [DOI] [PMC free article] [PubMed] [Google Scholar]
- 43.Parton LE, et al. Glucose sensing by POMC neurons regulates glucose homeostasis and is impaired in obesity. Nature. 2007;449:228–232. doi: 10.1038/nature06098. [DOI] [PubMed] [Google Scholar]
- 44.Horvath TL, et al. Brain uncoupling protein 2: uncoupled neuronal mitochondria predict thermal synapses in homeostatic centers. The Journal of neuroscience : the official journal of the Society for Neuroscience. 1999;19:10417–10427. doi: 10.1523/JNEUROSCI.19-23-10417.1999. [DOI] [PMC free article] [PubMed] [Google Scholar]
- 45.Andrews ZB, et al. Ghrelin promotes and protects nigrostriatal dopamine function via a UCP2-dependent mitochondrial mechanism. The Journal of neuroscience : the official journal of the Society for Neuroscience. 2009;29:14057–14065. doi: 10.1523/JNEUROSCI.3890-09.2009. [DOI] [PMC free article] [PubMed] [Google Scholar]
- 46.Landry M, Vila-Porcile E, Hokfelt T, Calas A. Differential routing of coexisting neuropeptides in vasopressin neurons. The European journal of neuroscience. 2003;17:579–589. [PubMed] [Google Scholar]
- 47.van den Pol AN. Neuropeptide transmission in brain circuits. Neuron. 2012;76:98–115. doi: 10.1016/j.neuron.2012.09.014. [DOI] [PMC free article] [PubMed] [Google Scholar]
References
- 48.Pinto S, et al. Rapid rewiring of arcuate nucleus feeding circuits by leptin. Science. 2004;304:110–115. doi: 10.1126/science.1089459. [DOI] [PubMed] [Google Scholar]
- 49.Zimmer A, Zimmer AM, Hohmann AG, Herkenham M, Bonner TI. Increased mortality, hypoactivity, and hypoalgesia in cannabinoid CB1 receptor knockout mice. Proceedings of the National Academy of Sciences of the United States of America. 1999;96:5780–5785. doi: 10.1073/pnas.96.10.5780. [DOI] [PMC free article] [PubMed] [Google Scholar]
- 50.Zhang CY, et al. Uncoupling protein-2 negatively regulates insulin secretion and is a major link between obesity, beta cell dysfunction, and type 2 diabetes. Cell. 2001;105:745–755. doi: 10.1016/s0092-8674(01)00378-6. [DOI] [PubMed] [Google Scholar]
- 51.Dietrich MO, Liu ZW, Horvath TL. Mitochondrial dynamics controlled by mitofusins regulate Agrp neuronal activity and diet-induced obesity. Cell. 2013;155:188–199. doi: 10.1016/j.cell.2013.09.004. [DOI] [PMC free article] [PubMed] [Google Scholar]
- 52.Dietrich MO, et al. AgRP neurons regulate development of dopamine neuronal plasticity and nonfood-associated behaviors. Nature neuroscience. 2012;15:1108–1110. doi: 10.1038/nn.3147. [DOI] [PMC free article] [PubMed] [Google Scholar]
- 53.Cetin A, Komai S, Eliava M, Seeburg PH, Osten P. Stereotaxic gene delivery in the rodent brain. Nature protocols. 2006;1:3166–3173. doi: 10.1038/nprot.2006.450. [DOI] [PubMed] [Google Scholar]
- 54.Moreira PI, et al. Mitochondria from distinct tissues are differently affected by 17beta-estradiol and tamoxifen. The Journal of steroid biochemistry and molecular biology. 2011;123:8–16. doi: 10.1016/j.jsbmb.2010.09.004. [DOI] [PubMed] [Google Scholar]
Associated Data
This section collects any data citations, data availability statements, or supplementary materials included in this article.


