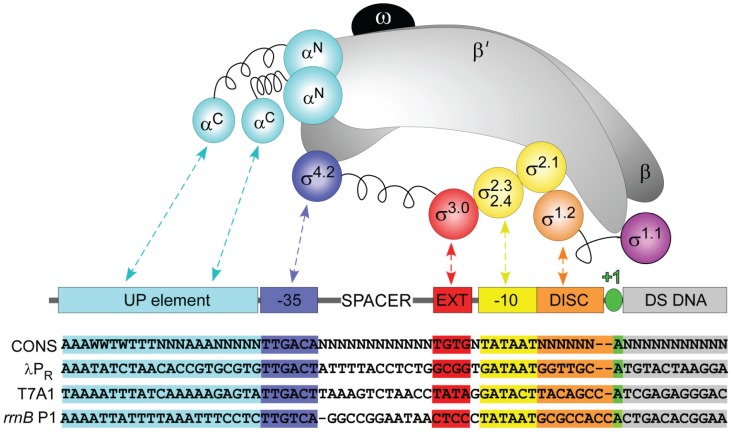
Figure 1.
Sequence-specific interactions between σ70 RNAP and regions of the promoter. Schematic representations of the subunits of RNAP core, σ70, and promoter DNA. RNAP: α2: cyan; β and β': gray; ω: black. σ regions: as shown. Promoter: UP element: cyan; −35 element: blue; extended −10: red; −10 element: yellow; discriminator: orange; transcription start site: green; DNA downstream of the transcription start site: gray. Linker regions in α and σ subunits are shown as springs. Nontemplate strand sequences of a “consensus” and λPR, T7A1 and rrnB P1 promoters are shown below; missing bases are indicated by dashes.

