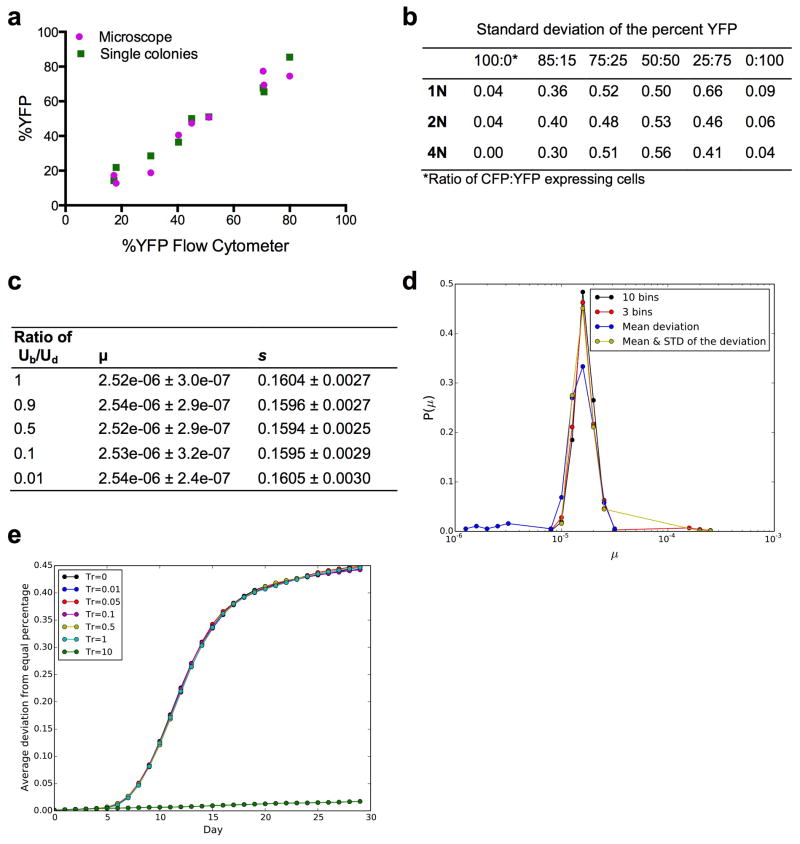
Extended Data Figure 3. Experimental and computational analyses of the noise in our experimental measurements and of the methods used in our mathematical modeling (see Supplementary Information).
(a) Three different methods were used to determine the percent of YFP-expressing cells in mixtures of the 1N, 2N, and 4N CFP and YFP ancestor strains. Cells were analyzed by flow cytometry (10,000 cells) and fluorescence microscopy (300 cells), and by single colony analysis (96 colonies) of the mixture before galactose induction. The percent YFP determined by all three methods was highly correlated (Pearson correlation coefficient = 0.98). (b) Table showing variation in flow cytometry replicate measurements. The standard deviation of the percent YFP obtained from 48 replicate populations of 6 different CFP:YFP ratios, for each ploidy type. (c) Table showing the average and standard deviation of the best-fit values for different ratios between beneficial (Ub) and deleterious (Ud) mutations, obtained from 100 independent datasets. (d) Evaluation of different summary statistics by calculating the distribution of best-fit values from 1000 replicate simulations. Four different summary statistics were used to analyze 1000 replicates of a parameter pair, s and μ (see Methods). The summary statistic using 10 bins has the highest mode and no outliers and was used to generate our best-fit values. (e) Criteria for exclusion of near-neutral mutations for implementation of the branching evolutionary model with an exponential distribution of mutations. Shown is the average deviation from equal percentages of YFP and CFP-expressing cells with different thresholds for neutral mutations. The threshold (Tr) represents the fraction of the average fitness effect (s), meaning every mutation whose absolute value is smaller than Tr*s was excluded. For this scenario (with parameters μ=2*10−5 and s=0.08), we can exclude every mutation with a fitness effect smaller than s (i.e. Tr=1, light blue) without changing the outcome relative to excluding no mutations (Tr=0). However, when excluding all mutations with fitness effects smaller than ten times s (Tr=10, dark green), the result changes substantially. Thus, for high mutation rates (μ*N>1), we can exclude weak mutations19.

