

Abstract
Emerging evidence has indicated that the expression of OPCML gene is frequently altered in a variety of cancers. We previously demonstrated that the OPCML gene is a target of epigenetic inactivation and its gene product exhibits tumor-suppressive properties. However, little is known regarding the effects and mechanisms of OPCML in colon cancer. We show that the loss or downregulation of OPCML is associated with its promoter hypermethylation. Methylation of the OPCML promoter was detected in all tumors and tumor-adjacent tissues, but lower methylation in normal colon tissues. The drug-induced release of epigenetic silencing was able to restore OPCML expression and the re-expression led to the suppression of cell growth. Furthermore, the increase in OPCML expression reversed a partial epithelial-to-mesenchymal (EMT)-like transition. Cell migration and invasiveness were also inhibited in response to OPCML upregulation. These actions were mediated through the inactivation of TGFβ-Smad signaling pathways. In addition, OPCML expression was associated with two upstream nuclear receptors (ERRa and RORa). Altogether, our study reveals OPCML as a potential tumor suppressor gene epigenetically silenced in colon cancer. Our study will help to elucidate the anti-invasive mechanisms of OPCML and establish new chemotherapeutic strategies for human colon cancer.
Keywords: Tumor suppressor, OPCML, methylation, cancer
Introduction
Colorectal cancer (CRC) is the third most common malignancy in the United States and the second most common cause of cancer death despite diagnostic and treatment advances [1]. In China, the incidence of colon cancer and mortality rate increases annually [2]. Epigenetic changes mainly involved the methylation of CpG islands in the promoters of tumor suppressor genes, causing gene silencing and the occurrence of tumors [3,4]. In the clinical setting, demethylation drugs have been used to treat some types of tumors [5,6]. The key to cancer treatment lies in its early detection and diagnosis [7]. Although a pathological diagnosis using colonoscopy is viewed as the gold standard for colorectal cancer detection [8], Most detections reveal distant metastatic disease at the time of presentation [8]. Therefore, there is an urgent need for highly specific and highly sensitive biomarkers, and new therapeutic strategies.
Emerging evidence has revealed that the aberrant promoter methylation of some tumor suppressor genes (TSGs), such as AKR1B1, CHST10, ELOVL4, SOX5, STK33, and ZNF304 are good early biomarkers and potential therapeutic targets for colon cancer [9]. In addition, OPCML gene, located on 11q25, may have potential as a biomarker and therapeutic target. OPCML belongs to a member of the IgLON family [10], and is a glycosylphosphatidylinositol (GPI)-anchored cell adhesion-like molecule.
OPCML is involved in cell growth, invasion, and metastasis and is closely related to tumorigenesis [11]. OPCML is widely expressed in normal infant and adult tissues, but it exhibits gene promoter methylation and reduced expression in multiple cancers [12-15], including ovarian cancer, bladder cancer, nasopharyngeal carcinoma, cervical carcinoma, and hepatocellular carcinoma [13,16-19]. However, the relationship between OPCML and the occurrence and development of colon cancer has not been reported, and any potential mechanisms related to CRC have not been elucidated.
The goal of the current study was to investigate the roles and mechanisms of OPCML in colon cancer. We found methylation of the OPCML gene promoter in most of colon tumors, OPCML induced G0/G1 cell cycle arrest and apoptosis in colon cancer cells, changed cell morphology and the expression of EMT markers [20], resulting in the inhibition of in vitro cell motility and invasiveness through the inactivation of Smad signaling pathways [21,22]. Our study provides evidence that OPCML acts as tumor suppressor in CRC and is an important negative regulator of EMT.
Materials and methods
Cell lines, plasmids and tissue samples
Two colon cancer cell lines used (SW480, LoVo) were kindly provided by Prof. Tongchuan He (The University of Chicago Medical Center, Chicago, Illinois, USA). Plasmid pcDNA-OPCML was constructed by cloning the amplified entire coding region of OPCML into pCDNA3.1(+) and sequenced for verification. Colon tissues were obtained from patients treated by primary surgery at the First Affiliated Hospital Surgery Department of Chongqing Medical University (Chongqing, China). All samples were evaluated and subjected to histological diagnosis by expert pathologists. All patients provided informed consent. The samples were stored at the Chongqing Medical University tissue bank until use. This study was approved through the Institutional Review Board of Chongqing Medical University.
Establishing stable cell lines
Cells were plated in six-well plates. pcDNA-OPCML or pcDNA3.1(+) was then transfected into 70% confluent SW480 and LoVo cells using Lipofectamine 2000 reagent (Lipofectamine 2000 Reagent, Invitrogen, CA, USA), according to the manufacturer’s protocols. After transfection, cells were grown in a nonselective growth medium for 48 h after which the medium was replaced with a selection medium containing 400 μg/ml G418 (Invitrogen/Gibco). After 14 days, individual colonies were isolated and cultured. Meanwhile, total RNA from the transfected cells was treated with DNase I, and analyzed by RT-PCR and western blot to confirm the expression of OPCML in stable cells.
Analysis of Oncomine data
The Oncomine database tool (http://www.oncomine.org) was used to analyze the mRNA expression of OPCML in human colon cancer samples compared to normal colon tissue samples. The threshold search value used for this study was a p-value of 0.05.
Semiquantitative RT-PCR and quantitative reverse transcription polymerase chain reaction analysis (qRT-PCR)
Total RNA was isolated from tissues and cells using Trizol reagent (Invitrogen, USA) according to the manufacturer’s instructions. Reverse transcription was performed using Promega’s reverse transcription system (Promega, Madison, WI, USA), including RNA 1 ug, oligo (dT) 1 μl, add to 6 μl volume (70°C for 10 min, placed on the ice more than 2 minutes), then 2 μl 5×buffer, 0.5 μl dNTPs, 0.25 μl RII, 0.5 μl RTase (RNA reverse transcriptase), and 0.75 μl ddH2O. The PCR reaction steps were as follows: 42°C for 1 h, 70°C for 15 min, 4°C for 10 min. Reverse transcription-PCR was performed in a total reaction volume of 10 μl using Go-Taq (Promega, Madison, WI, USA), including 2 μl cDNA, 1.6 μl 5×PCR buffer, 0.4 μl 25 mM MgCl2, 0.6 μl forward primer, 0.6 μl reverse primer, 0.05 μl DNA polymerase and 4.75 μl ddH2O, with glyceraldehyde-3-phosphate dehydrogenase (GAPDH) as a control. Primers used are listed in Table 1. The PCR program consisted of an initial denaturation at 95°C for 2 min, followed by 32 cycles (for genes) or 23 cycles (for GAPDH, glyceraldehyde-phosphate dehydrogenase) of the following: 94°C for 30 s, 55°C for 30 s, and 72°C for 30 s, with a final elongation at 72°C for 5 min. Agarose gel electrophoresis (120 V, 25 min) was performed using a 2% agarose gel. Results were obtained using a Bio-Rad’s Gel Doc XR+ system (Bio-Rad, USA).
Table 1.
List of primers used in this study
| Primer | Sequence (5’-3’) | size (bp) |
|---|---|---|
| p21-sense | TGGAGACTCTCAGGGTCGAAA | |
| p21-antisense | GGCGTTTGGAGTGGTAGAAATC | 65 |
| p53-sense | TCAACAAGATGTTTTGCCAACTG | |
| p53-antisense | ATGTGCTGTGACTGCTTGTAGATG | 118 |
| TGFB1-sense | TGTACAACAGCACCCGCGAC | |
| TGFB1-antisense | GAGAGCAACACGGGTTCAGG | 214 |
| TGFB2-sense | ACAGCACCAGGGACTTGCTC | |
| TGFB2-antisense | CGTTGTTCAGGCACTCTGGC | 280/364 |
| TGFB3-sense | CAACGGTGATGACCCACGTC | |
| TGFB3-antisense | CTCATTCCGCTTAGAGCTGG | 320 |
| Smad2-sense | CCATCTTGCCATTCACGC | |
| Smad2-antisense | TCTTCCTGCCCATTCTGC | 106 |
| Smad3-sense | AGTCTCCCAACTGTAACCA | |
| Smad3-antisense | GGTAGACAGCCTCAAAGC | 147 |
| Smad4-sense | CAGAGAACATTGGATGGGAG | |
| Smad4-antisense | CCAGGTGATACAACTCGTTC | 197 |
| RORa-sense | CACGACGACCTCAGTAAC | |
| RORa-antisense | CGAACAGTAGGGAAAGAA | 186 |
| ERRa-sense | GTGGGCGGCAGAAGTACAAG | |
| ERRa-antisense | GGTCAAAGAGGTCACAGAGGGT | 234 |
| N-cad-sense | CAGGTTTGGAATGGGACAGT | |
| N-cad-antisense | TCCAGTAGGATCTCCGCCAC | 480 |
| Ecad-sense | CCTCCGTTTCTGGAATCCAA | |
| Ecad-antisense | GTTCTCTATCCAGAGGCTCT | 282 |
| VIM-sense | TGCCAACCTTTACAGACCTA | |
| VIM-antisense | CTCATCTCCCTCCTCACTCA | 390 |
| β-catenin-sense | TGTATGAGTGGGAACAGGGATT | |
| β-catenin-antisense | GCCAAACGCTGGACATTAGT | 190 |
| β-actin-sense | GTCTTCCCCTCCATCGTG | |
| β-actin-antisense | AGGGTGAGGATGCCTCTCTT | 114 |
| OPCML-sense | GGGTCTGTGGGTACCTGTTC | |
| OPCML-antisense | TATGGACCACTTGTCATTCC | 280 |
Real-time PCR was carried out in the ABI 7500 Real-Time PCR System (Applied Biosystems, USA) using the Maxima SYBR Green/ROX qPCR Master Mix (MBI Fermentas, St. Leon-Rot, Ger-many). The primer pairs used are listed in Table 1. Thermal cycling conditions were 95°C for 30 s, followed by 5 s at 95°C, and 1 min at 60°C for 40 cycles. The gene expression level was defined based on the threshold cycle (Ct), and the relative expression levels were calculated using the 2-ΔΔCt method and β-actin as a reference gene.
5-Aza-2’-deoxycytidine and trichostatin A treatment
Cells were treated with 10 mM 5-aza-2’-deoxycytidine (Aza; Sigma-Aldrich, St Louis, MO, USA) for 72 h. Cells were then further treated with 100 nM trichostatin A (TSA; Cayman Chemical Co, Ann Arbor, MI, USA) for 24 h. RNA was extracted for RT-PCR.
Bisulfite treatment and MSP
Genomic DNA was extracted from tissues using the QIAamp DNA Mini Kit (Qiagen, Hilden, Germany). DNA bisulfite treatment was carried out according to our previous methods [23]. MSP primers for OPCML were: OPCMLm1: 5’-CGTTTAGTTTTTCGTGCGTTC-3’. OPCMLm2: 5’-CGAAAACGCGCAACCGACG-3’. OPCMLu1: 5’-TTTGTTTAGTTTTTTGTGTGTTTG-3’. OPCMLu2: 5’-CAAAACAAAAACACACAACCAACA-3’. All primers were previously tested for their inability to amplify unbisulfited DNA. PCR products were analyzed on 2% agarose gels.
Colony formation assay
After 48 h post-transfection, cells were collected and seeded in a new 6-well plate and selected for 2 weeks in the presence of G418 (400 μg/ml) until untransfected cells could not survive G418 screening. Surviving colonies (≥50 cells per colony) were counted after staining with gentian violet. The data were obtained from three independent cultures and each experiment was repeated in triplicate wells.
Flow cytometry analyses of cell cycle and apoptosis
For cell cycle analysis, cells were digested with trypsin and fixed with ice-cold 70% ethanol, treated with 5 mg/ml RNase A (Sigma), stained with propidium iodide, and analyzed by flow cytometry (FACSCalibur instrument and CELLQUEST software, Becton Dickinson). For apoptosis analysis, cells were suspended in PBS. Acridine orange/ethidium bromide (AO/EB) fluorescence staining was also used to detect cell apoptosis. Cells were stained with a 20 μl AO/EB solution (100 μg/ml, 1:1 Solarbio). Photos were obtained with a fluorescent microscope.
Wound healing assay and transwell cell migration assay
Cells were seeded into 6-well plates and allowed to grow until confluent. Following serum starvation for 24 h, a linear scratch “wound” was created onto the cell monolayer with a sterile 10 μl tip. Cells were then washed with PBS, serum-free media added, and microscopic images (100× magnification) of the linear “wound” was evaluated. The experiment was performed three times in triplicate.
Transwell chambers (8-μm pore size, 6.5 mm diameter, Corning Costar Corporation) were used to perform the migration assay. CRC cells were resuspended in serum-free medium and added to the upper chamber (2 × 10⁴ cells per chamber), and the lower chamber was filled with 700 μl migration-induced medium containing 10% FBS. After incubation (LoVo for 24 h, SW480 for 48 h) cells that migrated the lower chamber were fixed with methanol, stained with hematoxylin, cells on the upper side wiped off using a Q-tip, and cells counted using a microscope.
Invasion assay
Transwell chamber inserts coated with 100 μl Matrigel (2.5 mg/ml; BD Biosciences Discovery Labware, 1:5 dilution) were used for the invasion assay. Cells were seeded onto the upper wells of pre-coated transwell chambers. Lower wells of the transwells were filled with 700 μl of the same medium with 10% FBS. After incubation (LoVo for 48 h, SW480 for 72 h) cells were fixed with 4% paraformaldehyde then stained for 30 min with Crystal violet. After wiping off cells on the upper side of the filter on the transwell Inserts using cotton swabs, microphotograms of the cells that had migrated to the lower side of the filter were taken using light microscopy.
Immunofluorescence staining
The expression and localization of epithelial/mesenchymal markers were assessed using immunofluorescence (IF) analysis. Cells cultured on small round glass coverslips were fixed in 4% paraformaldehyde for 15 min and then blocked for 30 min at room temperature. The coverslip were subsequently washed three times with 1×PBS and incubated with 40 μl of specific primary antibodies overnight at 4°C in a moist environment. Negative control sections were performed using PBS instead of working primary antibodies. After washing with PBS, sections were incubated with 40 μl of fluorochrome-labeled secondary antibodies (1:100) for 1 h at room temperature in the dark. Counterstaining with DAPI (1 μg/ml) was performed and the coverslip mounted with 15% glycerol (or a small volume of hydromount) and subsequently visualized using a fluorescence microscope.
Western blot
Cells were lysed using protein extraction reagent (Thermo Scientific, Rockford, IL, USA) containing the protease inhibitor phenylmethanesulfonyl fluoride (PMSF) and a phosphatase inhibitor cocktail (Sigma, St. Louis, MO, USA). Total protein concentrations were measured using the BCA protein assay reagent (Thermo Scientific, Rockford, IL, USA). Lysates was separated using sodium dodecyl-sulfate/polyacrylamide gel electrophoresis (SDS-PAGE) and transferred onto polyvinylidene fluoride (PVDF) membranes for antibody incubation. The membranes were incubated with blocking buffer (PBS with 5% non-fat milk and 0.1% Tween 20), primary antibodies, and second antibodies (Promega, Madison, WI, USA) and visualized using the Enhanced Chemiluminescence (ECL) detection kit (Thermo Scientific). The primary antibodies used were as follows: rabbit anti-OPCML (1:500) were from Abcam (#Ab100923, Abcam, UK), p-Smad2 (Ser465/467) (138D4), Smad2 (D43B4) XP, Smad2/3 (D7G7) XP, p-Smad3 (Ser423/425) (C25A9), Smad3 (C67H9), and Smad4 rabbit mAbs were from Cell Signaling Technology, Inc. (#12747, Denvers, MA, USA). Rabbit anti-GAPDH (1:2000 dilution; Ab9485, Abcam, UK) antibodies served as the loading controls. Anti-rabbit IgG horseradish peroxidase conjugate secondary antibodies were from Cell Signaling.
Statistical analyses
Statistical analyes were performed using SPSS version 16 software (SPSS Inc., Chicago, IL). Colony formation data , flow cytometry analyses data , AO/EB staining data ,wound healing data, migration data and invasion assay data are calculated as mean±SD from three independent cultures. Then statistical significance was analyzed by the X2-test or 2-tailed t-test. Original real-time PCR data was calculated using the 2-ΔΔCt method and β-actin as a reference gene. The expression analysis of OPCML between tumor tissues and the corresponding adjacent tissues were assessed using the Student’s t-test. Fisher’s exact test was used when appropriate. Differences were considered statistically significant if a p-value was less than 0.05.
Results
OPCML is downregulated in CRC cells and specimens
Although broadly expressed in normal tissues, OPCML gene expression is dramatically repressed or completely silenced in multiple carcinoma cell lines derived from the esophagus, stomach, colon, and liver, as well as virtually all lymphoma cell lines examined [13]. To examine the expression levels of OPCML in CRC specimens, analysis of OPCML mRNA expression were performed using the online cancer microarray database, Oncomine (www.oncomine.org, Compendia biosciences, Ann Arbor, MI, USA). Two studies showed decreased OPCML mRNA expression in CRC samples compared to normal colon tissue. Data was taken from TCGA colorectal statistics (https://tcga-data.nci.nih.gov/tcga/) (Figure 1A, 1B). We also examined OPCML expression using quantitative RT-PCR analysis in five paired tissue samples from five patients (Figure 1C).
Figure 1.
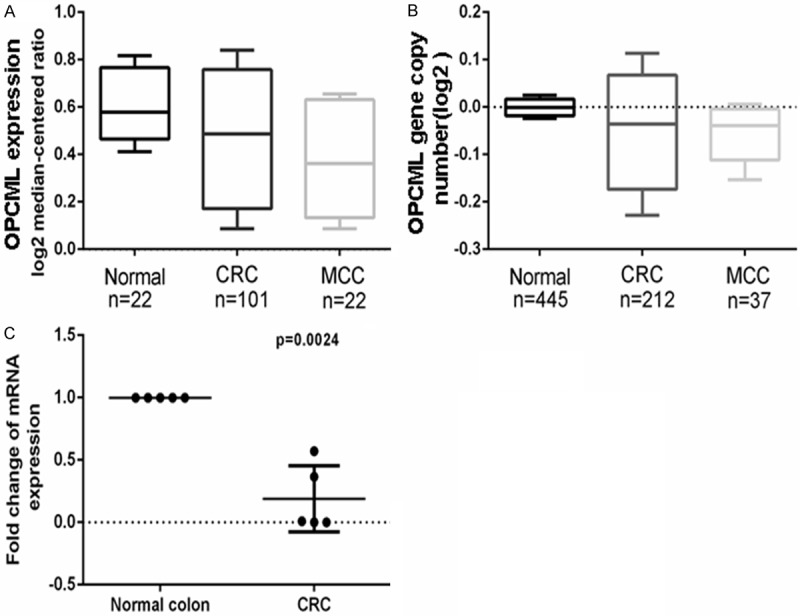
OPCML is downregulated in CRC specimens. A, B. OPCML mRNA expression level was assayed. C. Quantitative RT-PCR showed OPCML expression in five paired tissue samples.
OPCML downregulation is mediated by promoter methylation in colon cancer
Using our previously designed primers [13], we performed MSP analysis on 50 colon tumor samples and 7 paired normal colon tissues. Hypermethylation of the OPCML promoter commonly occurs in all primary colon tumors and significant lower methylation in paired normal colon tissues (Figure 2A, 2B). To further determine whether CpG island methylation directly mediates OPCML silencing, two hypermethylated cell lines were treated with the demethylating agent Aza in combination with TSA. OPCML expression was significantly induced after drug treatment in SW480 cells and partly restored in LoVo cells (Figure 2C). Collectively, evidence from promoter methylation, mRNA studies strongly suggested that OPCML promoter hypermethylation significantly correlates with the reduction or loss of OPCML expression.
Figure 2.
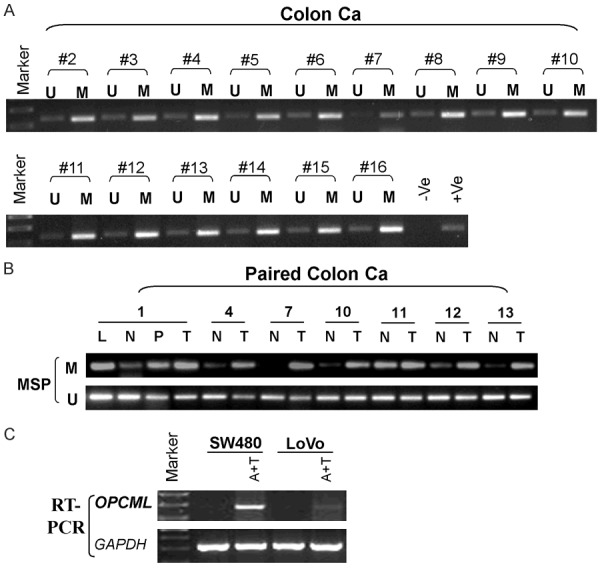
OPCML downregulation is mediated by promoter methylation A. Colon primary tumor tissues. B. Paired colon tissues. N: Normal colon tissues. T: Tumor tissues. P: Paired normal tumor-adjacent tissue. L: Lymphogenous metastasis. M: Methylated. U: Unmethylated. C. Pharmacological demethylation using Aza together with TSA restores OPCML expression.
OPCML modulates the growth and survival of colorectal cancer cells
The ectopic expression of OPCML markedly inhibited the colony formation ability in stable transfection colon cancer cells compared with the empty vector control group (P<0.001) (Figure 3A-C). These data suggested that OPCML inhibits cell proliferation in colon cancer.
Figure 3.
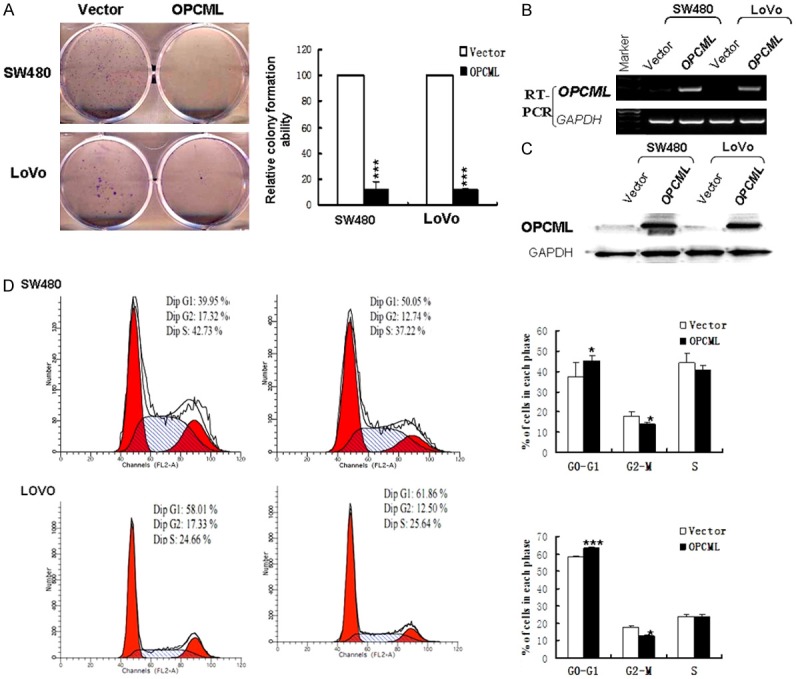
Effects of OPCML on the colony formation and cell cycle. A. Representative colony formation assay of OPCML in cell lines. Quantitative analysis of colony formation. B. Expression of OPCML was assayed by RT-PCR. C. OPCML protein levels in cell lines were analyzed by western blot. D. Left: Representative distribution of cell cycles in cells. Right : Flow cytometry data was summarized. Values are expressed as mean+SD from three experiments and the asterisks indicate statistical significance compared to controls. *P<0.05; **P<0.01; ***p<0.001.
OPCML induces G0/G1 cell cycle arrest and apoptosis in colon cancer cells
Cell-cycle distribution was analyzed by flow cytometry in cells transfected with OPCML (or vector as a control) (Figure 3D). Results showed that OPCML-transfected cells were significantly increased in the G0/G1 phase (P<0.05) compared to control-transfected cells. We next performed AO/EB and annexin V-FITC/PI staining assays. AO/EB staining results showed that apoptosis was markedly promoted in OPCML-transfected cells (Figure 4B, 4C). Consistent with the results of the AO/EB assay, the number of Annexin V-PI-positive cells increased in OPCML-transfected cells compared with the control groups (Figure 4A). Overall, these analyses indicated that the inhibition of cell proliferation by OPCML is most likely mediated by G0/G1 cell cycle arrest and proapoptosis.
Figure 4.
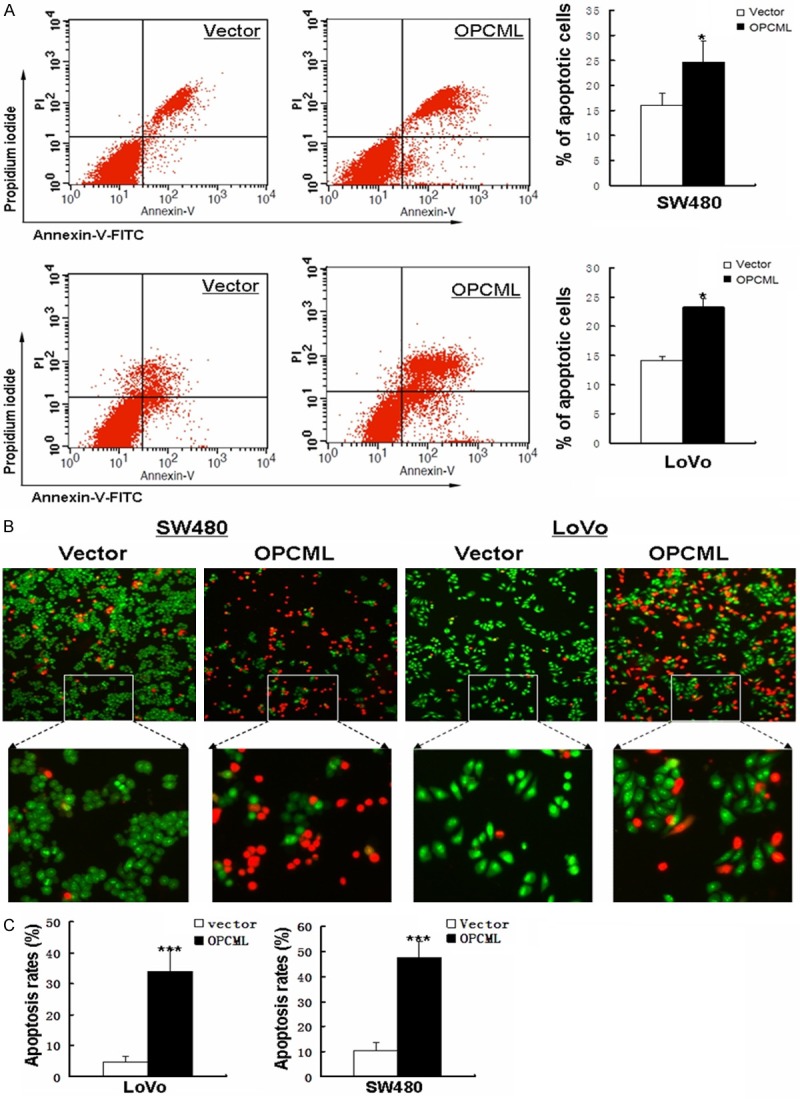
Detection of apoptosis induced by OPCML. A. Induction of apoptosis detected by flow cytometric analysis with AnnexinV-FITC and PI double staining. Right panel shows quantities analysis of this assay. B. Apoptotic cells were detected by AO/EB staining. C. Results of AO/EB staining are presented as average ± S.D. According to AO/EB staining test, Statistical significance was assessed by Student’s t-test. *P<0.05; **P<0.01; ***p<0.001.
OPCML suppresses colon cancer cell migration and invasion
Wound healing assays showed that OPCML-expressing cells migrate along the wound edges remarkably slower than vector-transfected cells (Figure 5A). In transwell experiments, which measure migration and/or invasion, significantly less cells transfected with the OPCML gene adhered to the lower membrane compared with the control groups (P<0.05) (Figure 5B, 5C). These results indicated that OPCML indeed possesses the ability to inhibit metastasis in colon cancer.
Figure 5.
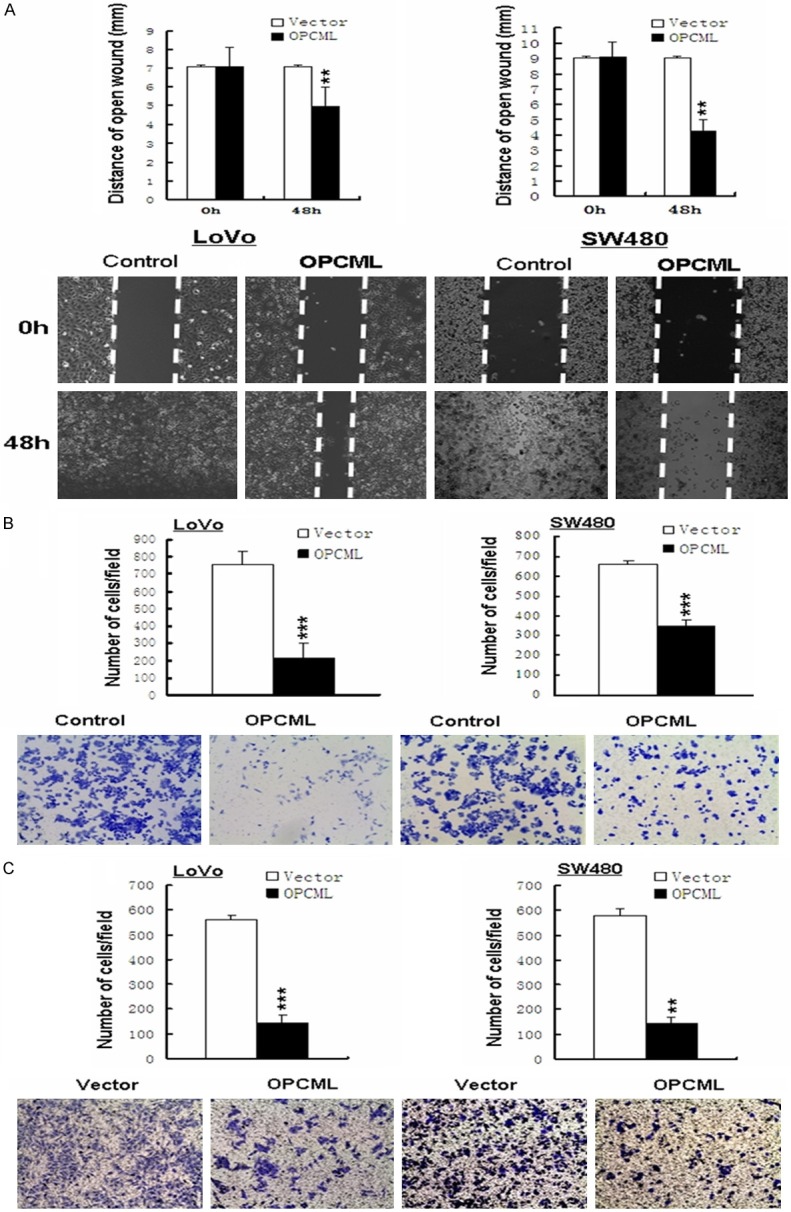
Ectopic OPCML expression inhibits colon cancer cell motility. A. wound healing assay. A representative image from three independent experiments is shown. B, C. Transwell experiments assay shows metastasis of cells with or without OPCML. Photographs represented the cells travelled through the micropore membrane. Quantities analysis of this showed the number of migrant cells by statistical analyses. *P<0.05; **P<0.01; ***p<0.001.
Ectopic expression of OPCML inhibits EMT-like morphological changes through the TGF-β pathway in colorectal carcinomas
TGF-β can induce epithelial to mesenchymal transition (EMT) in cancer [21]. We analyzed whether the ectopic expression of OPCML affects the occurrence of EMT and TGF-β signaling in colon cancer [20]. Here, we show that ectopic expression of OPCML caused significant changesin cell morphology (Figure 6A). Forty-eight hours after transfection, N-cadherin and vimentin expression were suppressed and the epithelial markers E-cadherin and β-catenin were increased in OPCML-transfected CRC cells compared vector-transfected CRC cells (Figure 6B, 6C, Supplementary Figure 1). OPCML also inhibited endogenous Smad3 and Smad2 mRNA levels (Figure 7A). Smad4 (DPC4), the downstream mediator of Smad3 and Smad2, also decreased in OPCML-transfected CRC cells compared with control cells. Downregulation of phosphorylated Smad2/Smad3 and Smad4 were also further confirmed from western blot results (Figure 7B). The TGF-β ligand, p53 and p21 increased in OPCML-transfected CRC cells (Figure 7A, 7C), which indicated that OPCML repressed the TGF-beta- responsive genes in the absence of ligand and may be involved in feedback regulation of TGF-beta signaling. Overall, these findings suggest that OPCML may regulate CRC cell migration, at least in part, through the inhibition of EMT induced through TGF-β.
Figure 6.
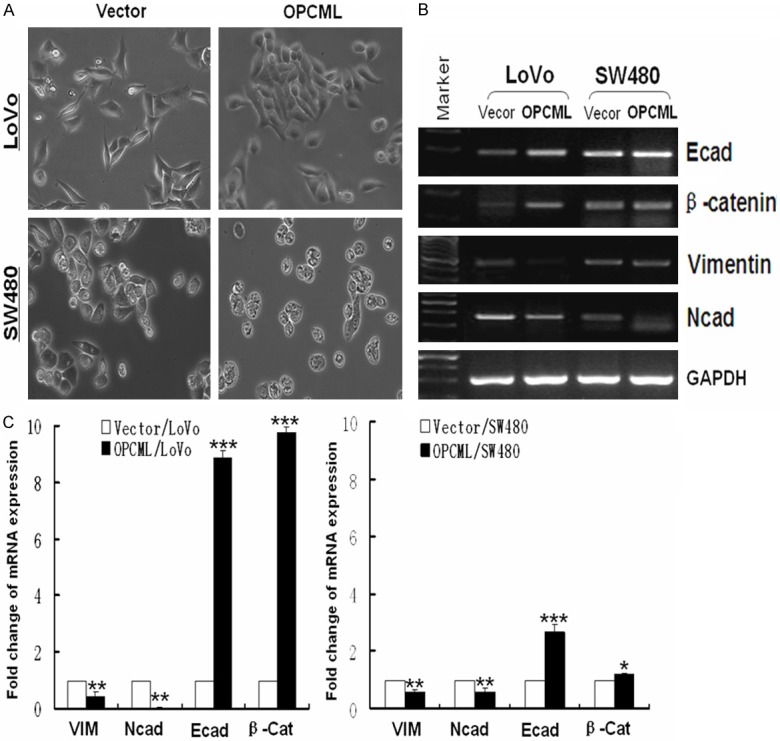
Ectopic expression of OPCML inhibits EMT. A. Cell morphology was observed using phase contrast microscopy. B. Expression levels of cell markers were measured using RT-PCR. C. mRNA of cell markers was analyzed by qRT-PCR. *P<0.05; **P<0.01; ***p<0.001.
Figure 7.
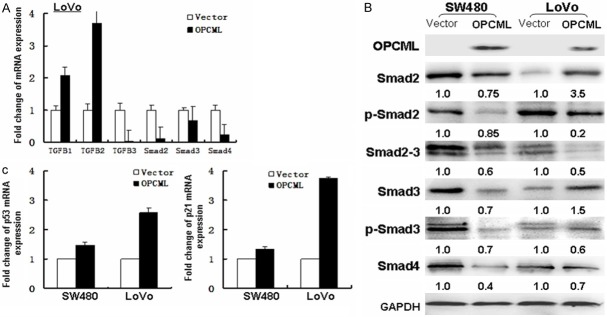
OPCML inhibits activation of Smad. A. mRNA expression of TGFB and smad were examined by Real-time PCR. Histogram were obtained through the statistical analysis. B. Western blot analyze smad-related signaling components proteins. C. Real-time PCR analyze mRNA expression of cell cycle- and apoptosis-related p53 and p21.
OPCML expression is associated with ERRa and RORa
The MAPPER2 Database (http://genome.ufl.edu/mapperdb), revealed estrogen-related receptors a (ERRa) and retinoid orphan nuclear receptor alpha (RORa) as potential transcription factors of the OPCML promoter (Figure 8A). RT-PCR and quantitative real-time RT-PCR studies showed there was a positive correlation between RORa and OPCML mRNA levels, and a negative correlation between ERRa and OPCML (Figure 8B-D), consistent with the hypothesis that RORa and ERRa competitively regulate OPCML expression in colon cancer cells. Interestingly, we found ectopic expression of OPCML caused significant upregulation of RORa and downregulation of ERRa. However, the role of these nuclear receptors in targeting OPCML mRNA needs to be established experimentally.
Figure 8.

OPCML expression is associated with upstream factor ERRa and RORa. A. Transcription factor binding sites of OPCML was analyzed. B. RT-PCR showed the expression of ERRa, RORa and OPCML. C. The quantitative real-time RT-PCR showed the fold change of ERRa, RORa and OPCML mRNA expression. D. The bar chart showed relationship of ERRa and RORa to OPCML expression.
Discussion
Many TSGs encoded from human chromosome 11q correlate with the pathogenesis of various tumors [24], including ovarian [11], human oral [25], nasopharyngeal, breast and gastrointestinal tract cancer. Gene expression analysis in silico using the microarray database revealed that OPCML, located at the 11q25 locus, is underexpressed in a variety of cancers, such as lung, prostate, bladder, ovarian, and breast cancers, compared with normal tissues. Our study results found that OPCML is expressed in normal colon tissues, but is frequently downregulated or silenced in colon cancer due to promoter methylation. Hypermethylation of the OPCML promoter was frequent (100% in cell lines and primary tumors) and the predominant mechanism for the loss or downregulation of OPCML expression in colon cancer [13].
Real-time quantitative RT-PCR revealed that the OPCML gene is frequently downregulated in human colon cancer. However, we could not group the present cases into different histopathological types of colon cancer due to the low number of samples examined. Still, We found that five colon carcinomas had significantly reduced levels of OPCML mRNA. Thus, OPCML gene downregulation may begin in early stage colon cancer irrespective of the histopathological subtype. To confirm these findings, 42 paired primary tumors and seven distant normal colon tissues were examined for OPCML promoter hypermethylation. All tumors and tumor-adjacent tissues were methylated, thus confirming the results observed in the colon cancer cell lines. In contrast, the proportions of methylation were mostly lower in 7 normal colon tissues. Pharmacologic unmasking of epigenetic silencing in colon cancer cells restored OPCML expression. It suggested that we may be able to treat colon cancer patients through demethylation. Of course, there is a difference between cells and the human body. In order to achieve the goal of treating patients, late clinical trials is necessary. Taken together, these results suggest that OPCML expression is epigenetically inactivated through promoter-specific hypermethylation in colon cancer.
We elucidated the biological significance of OPCML epigenetic silencing in colon cancer by performing cell assays with the enforced expression of OPCML in two colon cancer model cell lines, LoVo and SW480. The ectopic expression of OPCML suppressed colony formation and proliferation of colon tumor cells lines by inducing G0/G1 cell cycle arrest and apoptosis. Meanwhile, we found that ectopic expression of OPCML caused significant changes in cell morphology and dissemination corresponding to EMT characteristics. In addition, OPCML resulted in decreased cell invasion and migration. To verify that the changes in cell morphology and dissemination are caused by inhibiting EMT, expression levels of epithelial and mesenchymal markers were compared.
EMT can be regulated or induced by various growth and differentiation factors. TGF-β signaling pathway has proved to be the major inducer of EMT during cancer progression. We hypothesized that the TGF-β signaling pathway might play a critical role in OPCML-regulated EMT [26]. Thus, we tested expression levels of TGFB1, TGFB2, TGFB3, Smad2, Smad3, and Smad4. The expression levels of Smad2/Smad3 and Smad4 were significantly repressed by OPCML, suggesting a potent role of Smad2 and Smad3 in OPCML-regulated EMT.
In addition, bioinformatic analysis indicated putative binding sites for important transcriptional factors such as RORa, ERRa, Blimp-1, and olf-1 in the promoter region of OPCML. Interestingly, ERRa and RORa are located at the same site in the promoter region of OPCML. ERRs are orphan nuclear hormone receptors [27]. RORa also belongs to a family of orphan nuclear receptors. RORa is frequently inactivated in multiple types of tumors [28]. The ligand-induced activation of RORa also significantly reduces the growth of murine colon 38 adenocarcinoma [29]. RORa overexpression leads to increased p53 protein stability and the expression of p53 target genes [30]. Indeed, we observed a positive correlation between RORa and OPCML mRNA levels, and a negative correlation between ERRa and OPCML in clinical CRC samples and cell lines. Intriguingly, consistent with this observation, increasing OPCML expression in these cells led to increased RORa levels and decreased ERRa expression, through a potential feedback regulation. Further experiments are needed to confirm this regulatory relationship.
In summary, our study identified OPCML as a functional tumor suppressor epigenetically silenced in colon cancer. OPCML overexpression inhibited the TGF-β /Smad signaling pathway. Our study will help elucidate the anti-invasive mechanisms of OPCML and establish new chemotherapeutic strategies for human colon cancer.
Acknowledgements
This study was supported by grants from National Natural Science Foundation (#81372238, #81000907, #31171243, #81372898, #81172582) and the Chinese University of Hong Kong.
Disclosure of conflict of interest
None.
Supporting Information
References
- 1.Siegel R, Naishadham D, Jemal A. Cancer statistics 2012. CA Cancer J Clin. 2012;62:10–29. doi: 10.3322/caac.20138. [DOI] [PubMed] [Google Scholar]
- 2.Tang YR, Wang P, Yin R, Ge JX, Wang GP, Lin L. Five-year follow-up of 263 cases of functional bowel disorder. World J Gastroenterol. 2013;19:1466–1471. doi: 10.3748/wjg.v19.i9.1466. [DOI] [PMC free article] [PubMed] [Google Scholar]
- 3.Irizarry RA, Ladd-Acosta C, Wen B, Wu Z, Montano C, Onyango P, Cui H, Gabo K, Rongione M, Webster M, Ji H, Potash JB, Sabunciyan S, Feinberg AP. The human colon cancer methylome shows similar hypo- and hypermethylation at conserved tissue-specific CpG island shores. Nat Genet. 2009;41:178–186. doi: 10.1038/ng.298. [DOI] [PMC free article] [PubMed] [Google Scholar]
- 4.Yin X, Xiang T, Li L, Su X, Shu X, Luo X, Huang J, Yuan Y, Peng W, Oberst M, Kelly K, Ren G, Tao Q. DACT1, an antagonist to Wnt/beta-catenin signaling, suppresses tumor cell growth and is frequently silenced in breast cancer. Breast Cancer Res. 2013;15:R23. doi: 10.1186/bcr3399. [DOI] [PMC free article] [PubMed] [Google Scholar]
- 5.Hackanson B, Daskalakis M. Decitabine. Recent Results Cancer Res. 2014;201:269–297. doi: 10.1007/978-3-642-54490-3_18. [DOI] [PubMed] [Google Scholar]
- 6.Yun H, Damm F, Yap D, Schwarzer A, Chaturvedi A, Jyotsana N, Lubbert M, Bullinger L, Dohner K, Geffers R, Aparicio S, Humphries RK, Ganser A, Heuser M. Impact of MLL5 expression on decitabine efficacy and DNA methylation in acute myeloid leukemia. Haematologica. 2014;99:1456–64. doi: 10.3324/haematol.2013.101386. [DOI] [PMC free article] [PubMed] [Google Scholar]
- 7.Liang W, Shao W, Jiang G, Wang Q, Liu L, Liu D, Wang Z, Zhu Z, He J. Chinese multi-institutional registry (CMIR) for resected non-small cell lung cancer: survival analysis of 5,853 cases. J Thorac Dis. 2013;5:726–729. doi: 10.3978/j.issn.2072-1439.2013.12.32. [DOI] [PMC free article] [PubMed] [Google Scholar]
- 8.Kolligs FT, Graser A. [Early detection of colorectal cancer: role of endoscopy and imaging] . Internist (Berl) 2013;54:797–802. doi: 10.1007/s00108-012-3237-9. [DOI] [PubMed] [Google Scholar]
- 9.Moon JW, Lee SK, Lee JO, Kim N, Lee YW, Kim SJ, Kang HJ, Kim J, Kim HS, Park SH. Identification of novel hypermethylated genes and demethylating effect of vincristine in colorectal cancer. J Exp Clin Cancer Res. 2014;33:4. doi: 10.1186/1756-9966-33-4. [DOI] [PMC free article] [PubMed] [Google Scholar]
- 10.Shark KB, Lee NM. Cloning, sequencing and localization to chromosome 11 of a cDNA encoding a human opioid-binding cell adhesion molecule (OBCAM) Gene. 1995;155:213–21. doi: 10.1016/0378-1119(94)00830-l. [DOI] [PubMed] [Google Scholar]
- 11.Sellar GC, Watt KP, Rabiasz GJ, Stronach EA, Li L, Miller EP, Massie CE, Miller J, Contreras-Moreira B, Scott D, Brown I, Williams AR, Bates PA, Smyth JF, Gabra H. OPCML at 11q25 is epigenetically inactivated and has tumor-suppressor function in epithelial ovarian cancer. Nat Genet. 2003;34:337–343. doi: 10.1038/ng1183. [DOI] [PubMed] [Google Scholar]
- 12.Reed JE, Dunn JR, du Plessis DG, Shaw EJ, Reeves P, Gee AL, Warnke PC, Sellar GC, Moss DJ, Walker C. Expression of cellular adhesion molecule ’OPCML’ is down-regulated in gliomas and other brain tumours. Neuropathol Appl Neurobiol. 2007;33:77–85. doi: 10.1111/j.1365-2990.2006.00786.x. [DOI] [PubMed] [Google Scholar]
- 13.Cui Y, Ying Y, van Hasselt A, Ng KM, Yu J, Zhang Q, Jin J, Liu D, Rhim JS, Rha SY, Loyo M, Chan AT, Srivastava G, Tsao GS, Sellar GC, Sung JJ, Sidransky D, Tao Q. OPCML is a broad tumor suppressor for multiple carcinomas and lymphomas with frequently epigenetic inactivation. PLoS One. 2008;3:e2990. doi: 10.1371/journal.pone.0002990. [DOI] [PMC free article] [PubMed] [Google Scholar]
- 14.McKie AB, Vaughan S, Zanini E, Okon IS, Louis L, de Sousa C, Greene MI, Wang Q, Agarwal R, Shaposhnikov D, Wong JL, Gungor H, Janczar S, El-Bahrawy M, Lam EW, Chayen NE, Gabra H. The OPCML tumor suppressor functions as a cell surface repressor-adaptor, negatively regulating receptor tyrosine kinases in epithelial ovarian cancer. Cancer Discov. 2012;2:156–171. doi: 10.1158/2159-8290.CD-11-0256. [DOI] [PMC free article] [PubMed] [Google Scholar]
- 15.McNeish IA, Bell SJ, Lemoine NR. Gene therapy progress and prospects: cancer gene therapy using tumour suppressor genes. Gene Ther. 2004;11:497–503. doi: 10.1038/sj.gt.3302238. [DOI] [PubMed] [Google Scholar]
- 16.Duarte-Pereira S, Paiva F, Costa VL, Ramalho-Carvalho J, Savva-Bordalo J, Rodrigues A, Ribeiro FR, Silva VM, Oliveira J, Henrique R, Jeronimo C. Prognostic value of opioid binding protein/cell adhesion molecule-like promoter methylation in bladder carcinoma. Eur J Cancer. 2011;47:1106–1114. doi: 10.1016/j.ejca.2010.12.025. [DOI] [PubMed] [Google Scholar]
- 17.Teodoridis JM, Hall J, Marsh S, Kannall HD, Smyth C, Curto J, Siddiqui N, Gabra H, McLeod HL, Strathdee G, Brown R. CpG island methylation of DNA damage response genes in advanced ovarian cancer. Cancer Res. 2005;65:8961–8967. doi: 10.1158/0008-5472.CAN-05-1187. [DOI] [PubMed] [Google Scholar]
- 18.Ye F, Zhang SF, Xie X, Lu WG. OPCML gene promoter methylation and gene expression in tumor and stroma cells of invasive cervical carcinoma. Cancer Invest. 2008;26:569–574. doi: 10.1080/07357900701837044. [DOI] [PubMed] [Google Scholar]
- 19.Chen H, Ye F, Zhang J, Lu W, Cheng Q, Xie X. Loss of OPCML expression and the correlation with CpG island methylation and LOH in ovarian serous carcinoma. Eur J Gynaecol Oncol. 2007;28:464–467. [PubMed] [Google Scholar]
- 20.Pain M, Bermudez O, Lacoste P, Royer PJ, Botturi K, Tissot A, Brouard S, Eickelberg O, Magnan A. Tissue remodelling in chronic bronchial diseases: from the epithelial to mesenchymal phenotype. Eur Respir Rev. 2014;23:118–130. doi: 10.1183/09059180.00004413. [DOI] [PMC free article] [PubMed] [Google Scholar]
- 21.Massague J. TGFbeta in Cancer. Cell. 2008;134:215–230. doi: 10.1016/j.cell.2008.07.001. [DOI] [PMC free article] [PubMed] [Google Scholar]
- 22.Lee JM, Dedhar S, Kalluri R, Thompson EW. The epithelial-mesenchymal transition: new insights in signaling, development, and disease. J Cell Biol. 2006;172:973–981. doi: 10.1083/jcb.200601018. [DOI] [PMC free article] [PubMed] [Google Scholar]
- 23.Tao Q, Huang H, Geiman TM, Lim CY, Fu L, Qiu GH, Robertson KD. Defective de novo methylation of viral and cellular DNA sequences in ICF syndrome cells. Hum Mol Genet. 2002;11:2091–2102. doi: 10.1093/hmg/11.18.2091. [DOI] [PubMed] [Google Scholar]
- 24.Mei FC, Young TW, Liu J, Cheng X. RAS-mediated epigenetic inactivation of OPCML in oncogenic transformation of human ovarian surface epithelial cells. FASEB J. 2006;20:497–499. doi: 10.1096/fj.05-4586fje. [DOI] [PubMed] [Google Scholar]
- 25.Uzawa K, Suzuki H, Komiya A, Nakanishi H, Ogawara K, Tanzawa H, Sato K. Evidence for two distinct tumor-suppressor gene loci on the long arm of chromosome 11 in human oral cancer. Int J Cancer. 1996;67:510–514. doi: 10.1002/(SICI)1097-0215(19960807)67:4<510::AID-IJC8>3.0.CO;2-V. [DOI] [PubMed] [Google Scholar]
- 26.Papageorgis P, Lambert AW, Ozturk S, Gao F, Pan H, Manne U, Alekseyev YO, Thiagalingam A, Abdolmaleky HM, Lenburg M, Thiagalingam S. Smad signaling is required to maintain epigenetic silencing during breast cancer progression. Cancer Res. 2010;70:968–978. doi: 10.1158/0008-5472.CAN-09-1872. [DOI] [PMC free article] [PubMed] [Google Scholar]
- 27.Wang J, Wang Y, Wong C. Oestrogen-related receptor alpha inverse agonist XCT-790 arrests A549 lung cancer cell population growth by inducing mitochondrial reactive oxygen species production. Cell Prolif. 2010;43:103–113. doi: 10.1111/j.1365-2184.2009.00659.x. [DOI] [PMC free article] [PubMed] [Google Scholar]
- 28.Lu D, Kiriyama Y, Lee KY, Giguere V. Transcriptional regulation of the estrogen-inducible pS2 breast cancer marker gene by the ERR family of orphan nuclear receptors. Cancer Res. 2001;61:6755–6761. [PubMed] [Google Scholar]
- 29.Winczyk K, Pawlikowski M, Guerrero JM, Karasek M. Possible involvement of the nuclear RZR/ROR-alpha receptor in the antitumor action of melatonin on murine Colon 38 cancer. Tumour Biol. 2002;23:298–302. doi: 10.1159/000068569. [DOI] [PubMed] [Google Scholar]
- 30.Wang Y, Solt LA, Kojetin DJ, Burris TP. Regulation of p53 stability and apoptosis by a ROR agonist. PLoS One. 2012;7:e34921. doi: 10.1371/journal.pone.0034921. [DOI] [PMC free article] [PubMed] [Google Scholar]
Associated Data
This section collects any data citations, data availability statements, or supplementary materials included in this article.