

Abstract
miRNA expression is deregulated in non-small cell lung cancer (NSCLC), and some miRNAs are associated with gefitinib sensitivity. Here, we investigated if circulating miRNAs could be a useful biomarker for the prediction of EGFR mutation and the patient’s prognosis. The differential miRNAs related to gefitinib sensitivity were screened and identified by microRNA array. Using Taqman-based real-time RT-PCR, we analyzed the expression of selected miRNAs in tumor tissues and plasma of 150 NSCLC patients. Kaplan-Meier survival analysis and Cox proportional hazards regression were used to determine the association between miRNAs expression and survival. Receiver operating characteristic curve analysis was also performed. Compared with PC9 cell line, 41 microRNAs detected by microarray were significantly differentially expressed in A549 and H1299 cells. The 5 selected hsa-miRNAs were all found differently expressed between wild and mutant EGFR carriers (all P<0.01). Down-regulation of 5 selected miRNAs were independently associated with lymphatic invasion (all P<0.01) and clinical stage (all P<0.01), respectively. Both down-regulation of has-miR-195 (P=0.012) and has-miR-21 (P=0.004) were associated with poor differentiation. All up-regulation of 5 has-miRNAs were associated with smoking (All P<0.05). 5 hsa-miRNAs were up-regulated both in plasma and tissue samples. A model including 4 hsa-miRNAs may predict EGFR mutational status and gefitinib-sensitivity (both AUC: 0.869). Plasma levels of has-miR-125b expression were associated with disease-free survival (P=0.033) and overall survival in the patients (P=0.028). In a word, Circulating 5 selected miRNAs may especially be useful in predicting EGFR mutation, and circulating hsa-miR-125b may have prognostic values in NSCLC patients.
Keywords: Non-small cell lung cancer (NSCLC), miRNAs, EGFR mutation, gefitinib, acquired resistance
Introduction
Lung cancer is the main cause of cancer-related death worldwide and non-small cell lung cancer (NSCLC) accounts for 80~85% [1], and the prognosis is very poor because lacking of the technology of early diagnosis and effective treatment [2]. Targeted molecular medicine has the advantages of high specificity, obvious curative effect and small side reaction, which is widely used in the advanced NSCLC [3]. EGFR (ErbB1/HER1) is a member of the ErbB family of transmembrane receptor tyrosine kinases involved in signal transduction pathways that regulate apoptosis and proliferation [4]. EGFR mutations were initially reported in 2004 [5] and its abnormal activation was found in 40~80% NSCLC, which indicates a poor prognosis. Tyrosine kinase inhibitors (TKIs) against the epidermal growth factor receptor (EGFR) are a relatively new class of targeted therapeutics used to treat a number of diseases and disorders, primarily tumors. Gefitinib is a kind of epidermal growth factor receptor tyrosine kinase inhibitor (EGFR-TKI), widely used in clinical treatment of non-small cell lung cancer (NSCLC), and achieved good efficacy, but the frequent appearance of drug resistance has limited its further development [6,7].
How to determine the optimal candidate of gefitinib treatment is a research hotspot and difficulty. Li T et al [7] reported that the successful analysis of EGFR mutations in advanced NSCLC had provided many patients with EGFR mutation positive tumors with the opportunity to receive optimal, targeted treatments. Garassino MC et al [8] found that the use of EGFR TKIs in tumors without an EGFR sensitizing mutation led to minimal clinical benefits in most advanced NSCLC cases. Then, EGFR mutation may be regarded as a biomarker for evaluating gefitinib sensitivity. However, mutation analysis of EGFR in clinical samples exist certain technical difficulty. EGFR mutation detected by PCR technology is simple and convenient, but there are some non-specific reactions, and high false positive rate. Sequencing of EGFR is the gold standard, but the positive rate is low.
MicroRNAs (miRNAs) are small non-coding RNA molecules with a length of 20 to 22 nucleotides that regulate gene expression by either translational inhibition or mRNA degradation. miRNAs function as either oncogenes or tumor suppressors by inhibiting the expression of target genes, some of which are either directly or indirectly involved with the drug resistance of tumor cells [9]. It has been reported that the interaction between growth factor activation of the EGFR signal transduction pathway and the transcriptional activation of specific miRNAs [10]. Hayashi et al observed in a fetal murine submandibular salivary grand (SMG) model and discovered that different miRNA profiles were expressed specifically at different EGF concentrations in vitro [10]. Avraham et al [11] showed that EGF stimulation initiated a coordinated transcriptional program of microRNAs and transcription factors, that permitted rapid induction of oncogenic transcription factors, such as c-FOS, encoded by immediate early genes. These findings identify specific microRNAs as attenuators of growth factor signaling and oncogenesis. Teixeira AL, et al found that miR-221/222, as transcriptional targets of EGFR, was associated with the expression levels of matrix metalloproteinases (MMPs) and repression of cell cycle inhibitors, which are key molecules in oncogenesis [12]. Despite the interaction link between EGFR signal transduction pathway and miRNA expression profiles has been known, little is known about whether specific microRNAs could be used to screen optimum population of gefitinib treatment, and improve the management of advanced NSCLC.
Material and methods
Patients
The Institutional Review Board on Medical Ethics, Zhejiang Province Cancer Hospital, approved the method of tissue collection including informed consent. All of the patients had given informed consent before collection of the samples according to institutional guidelines. Snap-frozen tissue samples were obtained from surgically resected NSCLC specimens from January 2008 to May 2011 at Zhejiang Province Cancer Hospital. One hundred and fifty tumor, paired non-neoplastic and plasma samples were collected. These patients underwent surgery for primary NSCLC resection and had not received any preoperative radiotherapy and chemotherapy or other co-existing diseases. Pathological diagnosis of surgically resected specimens was performed by two independently pathologists according to the criteria established by the National Comprehensive Cancer Network (NCCN). Plasma samples from twenties healthy volunteers were also collected for controls. Volunteers provided written informed consent. The details of patients were shown in Table 1A and 1B.
Table 1A.
The clinicopathological characteristics, EGFR Mutations and expression of the 3 selected miRNAs in NSCLC patients
| Variable | n | hsa-miR-25 | hsa-miR-122 | hsa-miR-195 | |||||||||
|---|---|---|---|---|---|---|---|---|---|---|---|---|---|
|
|
|
|
|||||||||||
| Tissue (%) | P-value | Plasma (%) | P-value | Tissue (%) | P-value | Plasma (%) | P-value | Tissue (%) | P-value | Plasma (%) | P-value | ||
| Sex | |||||||||||||
| Male | 103 | 23 (22.3) | .493 | 32 (31.1) | .242 | 27 (26.2) | .140 | 32 (31.1) | .242 | 19 (18.4) | .872 | 28 (27.2) | .197 |
| Female | 46 | 8 (17.4) | 10 (21.7) | 7 (15.2) | 10 (21.7) | 9 (19.6) | 8 (17.4) | ||||||
| Age (years) | |||||||||||||
| <60 | 54 | 11 (20.4) | .921 | 14 (25.9) | .644 | 12 (22.2) | .896 | 15 (27.8) | .933 | 6 (11.1) | .070 | 12 (22.2) | .677 |
| ≥60 | 95 | 20 (21.1) | 28 (29.5) | 22 (23.2) | 27 (28.4) | 22 (23.2) | 24 (25.3) | ||||||
| Histology | |||||||||||||
| Adeno | 60 | 19 (31.7) | .007 | 27 (45.0) | .000 | 20 (33.3) | .012 | 25 (41.7) | .003 | 17 (28.3) | .014 | 22 (36.7) | .003 |
| SCC | 89 | 12 (13.5) | 15 (16.9) | 14 (15.7) | 17 (19.1) | 11 (12.4) | 14 (15.7) | ||||||
| Differentiation | |||||||||||||
| Mod/well | 68 | 18 (26.5) | .119 | 25 (36.8) | .033 | 19 (27.9) | .172 | 25 (36.8) | .033 | 18 (26.5) | .028 | 23 (33.8) | .012 |
| Poor | 81 | 13 (16.0) | 17 (21.0) | 15 (18.5) | 17 (21.0) | 10 (12.3) | 13 (16.0) | ||||||
| T stage | |||||||||||||
| T1-2 | 131 | 100 (76.3) | 0.02 | 89 (67.9) | 0.005 | 98 (74.8) | 0.063 | 90 (68.7) | 0.023 | 103 (78.6) | 0.03 | 97 (74.0) | 0.168 |
| T3-4 | 18 | 18 (100.0) | 18 (100.0) | 17 (94.4) | 17 (94.4) | 18 (100.0) | 16 (88.9) | ||||||
| Lymph node | |||||||||||||
| Negative | 54 | 25 (46.3) | .000 | 28 (51.9) | .000 | 28 (51.9) | .000 | 31 (57.4) | .000 | 25 (46.3) | .000 | 28 (51.9) | .000 |
| Positive | 95 | 6 (6.3) | 14 (14.7) | 6 (6.3) | 11 (11.6) | 3 (3.2) | 8 (8.4) | ||||||
| Metastasis | |||||||||||||
| M0 | 147 | 31 (21.1) | .466 | 42 (28.6) | .372 | 34 (23.1) | .439 | 42 (28.6) | .372 | 28 (19.0) | .493 | 36 (24.5) | .422 |
| M1 | 2 | 0 (0.0) | 0 (0.0) | 0 (0.0) | 0 (0.0) | 0 (0.0) | 0 (0.0) | ||||||
| Clincal stage | |||||||||||||
| I-II | 92 | 61 (66.3) | .000 | 50 (54.3) | .000 | 58 (63.0) | .000 | 50 (54.3) | .000 | 64 (69.6) | .000 | 56 (60.9) | .000 |
| III-IV | 57 | 57 (100.0) | 57 (100.0) | 57 (100.0) | 57 (100) | 57 (100.0) | 57 (100.0) | ||||||
| EGFR mutation (Tissue) | |||||||||||||
| - | 86 | 31 (36.0) | .000 | 42 (48.8) | .000 | 34 (39.5) | .000 | 40 (46.5) | .000 | 27 (31.4) | .000 | 36 (41.9) | .000 |
| + | 63 | 0 (0.0) | 0 (0.0) | 0 (0.0) | 2 (3.2) | 1 (1.6) | 0 (0.0) | ||||||
| EGFR mutation (Plasma) | |||||||||||||
| - | 90 | 31 (34.4)) | .000 | 42 (46.7) | .000 | 34 (37.8) | .000 | 42 (46.7) | .000 | 27 (30.0) | .000 | 36 (40.0) | .000 |
| + | 59 | 0 (0.0) | 0 (0.0) | 0 (0.0) | 0 (0.0) | 1 (1.7) | 0 (0.0) | ||||||
| Smoking status | |||||||||||||
| No | 64 | 8 (12.5) | .030 | 11 (17.2) | .010 | 8 (12.5) | .009 | 11 (17.2) | .010 | 9 (14.1) | .200 | 8 (12.5) | .004 |
| Yes | 85 | 23 (27.1) | 31 (36.5) | 26 (30.6) | 31 (36.5) | 19 (22.4) | 28 (32.9) | ||||||
Adeno: Adenocarcinoma; SCC: squamous cell carcinoma.
Table 1B.
The clinicopathological characteristics, EGFR Mutations and expression of the 2 selected miRNAs in NSCLC patients
| Variable | n | hsa-miR-21 | hsa-miR-125b | ||||||
|---|---|---|---|---|---|---|---|---|---|
|
|
|
||||||||
| Tissue (%) | P-value | Plasma (%) | P-value | Tissue (%) | P-value | Plasma (%) | P-value | ||
| Sex | |||||||||
| Male | 103 | 34 (33.0) | .050 | 42 (40.8) | .085 | 31 (30.0) | .054 | 47 (45.6) | .081 |
| Female | 46 | 8 (17.4) | 12 (26.1) | 7 (15.2) | 14 (30.4) | ||||
| Age (years) | |||||||||
| <60 | 54 | 13 (24.1) | .400 | 16 (29.6) | .206 | 13 (24.1) | .763 | 22 (40.7) | .970 |
| ≥60 | 95 | 29 (30.5) | 38 (40.0) | 25 (26.3) | 39 (41.1) | ||||
| Histology | |||||||||
| Adeno | 60 | 26 (43.3) | .001 | 34 (56.7) | .000 | 26 (43.3) | .000 | 34 (56.7) | .001 |
| SCC | 89 | 16 (18.0) | 20 (22.5) | 12 (13.5) | 27 (30.3) | ||||
| Differentiation | |||||||||
| Mod/well | 68 | 25 (36.8) | .033 | 33 (48.5) | .004 | 22 (32.4) | .079 | 32 (47.1) | .164 |
| Poor | 81 | 17 (21.0) | 21 (25.9) | 16 (19.8) | 29 (35.8) | ||||
| T stage | |||||||||
| T1-2 | 131 | 91 (69.5) | 0.086 | 80 (61.1) | 0.065 | 95 (72.5) | 0.135 | 77 (58.8) | 0.85 |
| T3-4 | 18 | 16 (88.9) | 15 (83.3) | 16 (88.9) | 11 (61.1) | ||||
| Lymph node | |||||||||
| Negative | 54 | 33 (61.1) | .000 | 33 (61.1) | .000 | 26 (48.1) | .000 | 39 (72.2) | .000 |
| Positive | 95 | 9 (9.5) | 21 (22.1) | 12 (12.6) | 22 (23.2) | ||||
| Metastasis | |||||||||
| M0 | 147 | 42 (28.6) | .372 | 54 (36.7) | .283 | 38 (25.9) | .405 | 61 (41.5) | .236 |
| M1 | 2 | 0 (0.0) | 0 (0.0) | 0 (0.0) | 0 (0.0) | ||||
| Clincal stage | |||||||||
| I-II | 92 | 52 (56.5) | .000 | 47 (51.1) | .000 | 58 (63.0) | .000 | 42 (45.7) | .000 |
| III-IV | 57 | 55 (96.5) | 48 (84.2) | 53 (93.0) | 46 (80.7) | ||||
| EGFR mutation (Tissue) | |||||||||
| - | 86 | 39 (45.3) | .000 | 52 (60.5) | .000 | 37 (43.0) | .000 | 56 (65.1) | .000 |
| + | 63 | 3 (4.8) | 2 (3.2) | 1 (1.6) | 5 (7.9) | ||||
| EGFR mutation (Plasma) | |||||||||
| - | 90 | 40 (44.4) | .000 | 54 (60.0) | .000 | 38 (42.2) | .000 | 58 (64.4) | .000 |
| + | 59 | 2 (3.4) | 0 (0.0) | 0 (0.0) | 3 (5.1) | ||||
| Smoking status | |||||||||
| No | 64 | 10 (15.6) | .003 | 12 (18.8) | .000 | 8 (12.5) | .002 | 17 (26.6) | .002 |
| Yes | 85 | 32 (37.6) | 42 (49.4) | 30 (35.3) | 44 (51.8) | ||||
Adeno: Adenocarcinoma; SCC: squamous cell carcinoma.
Cell lines and cell cultures
Gefitinib-resistant human NSCLC cell lines A549 and H1299, Gefitinib-sensitive human lung adenocarcinoma cell line PC9, were maintained in Dulbecco’s Modified Eagle Medium and RPMI-1640 (Gibco), respectively, and supplemented with 10% FBS (Invitrogen-GIBCO), 2 mM L-glutamine, 100 mg/mL streptomycin, and 100 IU/mL penicillin. Cells were incubated at 37°C in 5% CO2. They had been passed for less than 6 months in culture when the experiments were carried out. Cell lines were characterized using DNA analysis by short tandem repeat fingerprinting.
microRNA extraction
Total RNA was extracted from tissues using miRNeasy Mini Kit (Qiagen, Hilden, Germany) following the manufacturer’s instructions. EDTA blood was centrifuged at 1600×g for 10 minutes at 4°C , and plasma was transferred into new tubes followed by further centrifugation at 16000×g for 10 minutes at 4°C. Total RNA containing small RNA was extracted from 500 μl of plasma using Trizol LS reagent (Invitrogen) and miRNeasy Mini Kit (Qiagen) according to the manufacturer’s protocol with the small modifications as previously described [13]. DNase treatment (Qiagen) was carried out to remove any contaminating DNA. RNA integrity was assessed by Agilent 2100 Bioanalyzer (Agilent Technologies, Santa Clara, CA, USA) using the Agilent RNA 6000 Nano Kit according to the manufacturer’s protocol.
miRNA expression microarray
Agilent Human miRNA (V19.0) containing a total of 1888 mature miRNA sequences were used in our microarray design. Raw data were normalized by Quantile algorithm, Gene Spring Software 11.0 (Agilent technologies, Santa Clara, CA, US). 6 miRNAs were randomly selected as targets, and their expression levels were validated by Taqman-based real-time RT-PCR.
miRNA expression by Taqman-based real-time RT-PCR
The measurement of the expression levels of individual microRNAs was performed using miRNA sequence specific primers (Applied Biosystems, Foster City, CA, USA) by the Taqman-based real-time RT-PCR detection methodology. Briefly, 10 ng of total RNA was reverse transcribed using High-Capacity cDNA Archive kit (Applied Biosystems) followed by amplification on an ABI 7500 Real-Time PCR System (Applied Biosystems). U6 small nucleolar RNA was used as endogenous control. miRNA expression levels were calculated by relative quantitation using the ABI 7500 Real-Time PCR SDS 1.2 software (Applied Biosystems), and the fold expression changes were determined by 2-ΔΔCt method [14]. The data were presented as the fold change of miRNA expression in lung tumors relatively to paired normal lung tissues after normalization to an endogenous control (U6 snRNA).
Genotyping of EGFR mutational status in NSCLC tumor tissues and plasma specimens
Genomic DNA and cell-free DNA were extracted from formalin-fixed, paraffin-embedded lung tumor tissues and plasma samples, respectively, by using a QIAamp DNA FFPE Tissue Kit or a QIAamp Circulating Nucleic Acid Kit (Qiagen, Hilden, Germany) as appropriate. The assays of EGFR mutational status were performed on an ABI7500 real-time PCR instrument (Applied Biosystems, Foster City, CA) using the AmoyDx Human EGFR Gene 29 Mutations Detection kit with fluorescence PCR (Amoy Diagnostics, Xiamen, China). This EGFR kit detects 29 mutations in exons 18 to 21, including T790M, L858R, L861Q, S768I, G719S, G719A, and G719C; three insertions in exon 20; and 19 deletions in exon 19. Primers were labeled with 6-carboxyfluorescein and HEX/VIC. DNAs were amplified by PCR according to the previously reported procedures [15].
Statistical analyses
The statistical analyses were performed with Graphpad Prism 5.0 statistical software. Survival analysis was performed with the Kaplan-Meier method. The Cox hazard regression model was used to analyze the miRNAs as risk factors for lung cancer. A probability (P)-value <0.05 was considered statistically significant.
Results
The mutational status of EGFR in NSCLC cell lines
To search for differences of EGFR mutations between gefitinib-sensitive human lung adenocarcinoma cells (PC-9) and gefitinib-resistant human lung adenocarcinoma cells (A549 and H1299), the EGFR mutational status was detected in NSCLC cell lines by using the amplification refractory mutation system (ARMS) PCR method. Results showed that EGFR mutations in exon 19 was found in PC-9 cells, however, no EGFR mutation was found in A549 and H1299 cells.
Identification of hsa-miRNAs whose expressions are associated with gefitinib- sensitivity
MicroRNA arrays were performed in the gefitinib-sensitive human lung adenocarcinoma cells (PC-9) and the gefitinib-resistant human lung adenocarcinoma cells (A549 and H1299), that contained 1888 human miRNA probes (Agilent Human miRNA (Vesion 19.0). A total of 41 has-miRNAs were differentially expressed between the two kinds of cell lines (Figure 1). Among those, 6 hsa-miRNAs (hsa-miR-122, hsa-miR-424, hsa-miR-182, hsa-miR-27a, hsa-miR-7d, and has-miR-205) were randomly selected for the validation of expression level by TaqMan-based real-time RT-PCR. The results were very similar to that by microarray (Figure 2).
Figure 1.
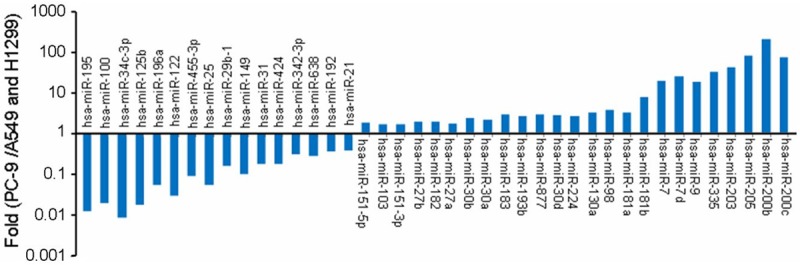
41 differential hsa-miRNAs related to gefitinib sensitivity between PC9 and A549/H1299 cells were screened and identified by microRNA array.
Figure 2.
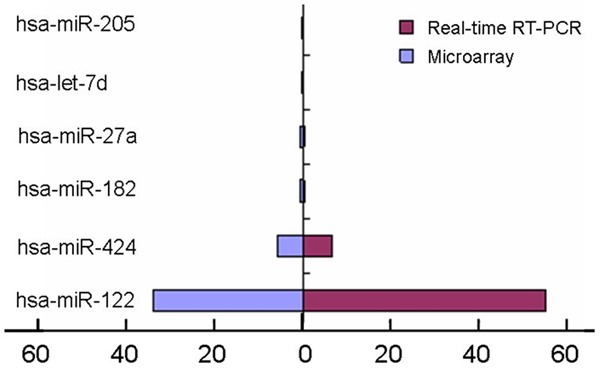
6 hsa-miRNAs were randomly selected for the validation of expression level by TaqMan-based real-time RT-PCR.
We selected 25 tissue samples with EGFR mutation for gefitinib-sensitivity and 10 samples with EGFR mutation for gefitinib-resistant, including 5 samples with EGFR 19Glu-Ala750del mutation, 5 samples with EGFR 21L-858R mutation, 5 samples with EGFR 20S768I mutation, 5 samples with EGFR 21L861Q mutation, 5 samples with EGFR 18G719A mutation, 5 samples with EGFR 20T790M mutation and 5 samples with EGFR 20V769-D770insASV mutation. Using TaqMan real-time RT-PCR analysis, we detected the level of these 41 hsa-miRNAs expression in 35 tissue samples with EGFR mutation. The confirmed dysregulated hsa-miRNAs were hsa-miR-25, hsa-miR-122, hsa-miR-195, hsa-miR-21, hsa-miR-125b, which were associated with gefitinib-sensitivity (Figure 3).
Figure 3.
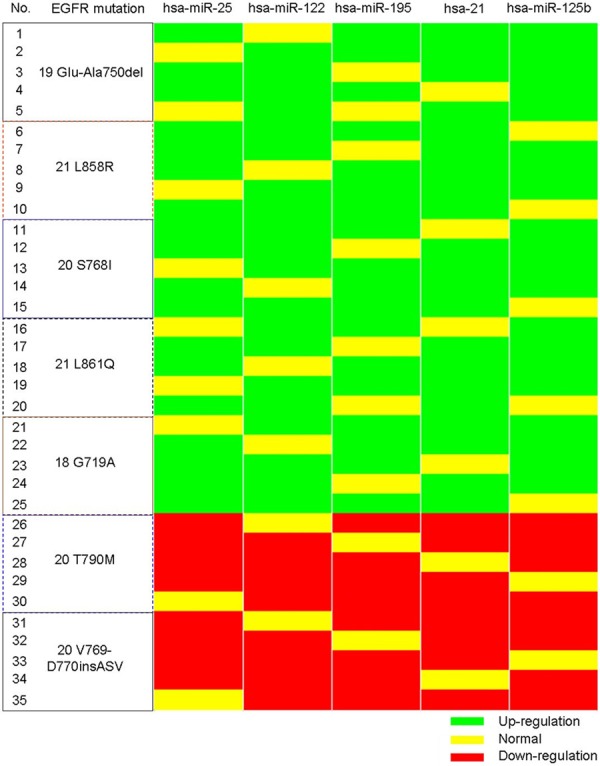
Identification of hsa-miRNAs whose expressions are associated with different EGFR mutations.
EGFR status in tumor tissues or plasma
There is a failure case in both EGFR mutation and miRNA experiment. EGFR mutations were detected in 63 of 149 (42.3%) primary tumor tissues by ARMS-PCR assays, in which 2 cases with EGFR 18G719A mutation, 30 cases with EGFR 19Glu-Ala750del mutation, 22 cases with EGFR 19Glu-Thr751del ins Ile mutation, 2 cases with EGFR 20S768I mutation, and 7 samples with EGFR 21L858R mutation. EGFR mutations were detected in 59 of 149 (39.6%) paired plasma by ARMS-PCR assays. EGFR mutation of plasma was not detected in 4 cases with positive EGFR mutation in their tumor tissues. The EGFR mutational status was identical when the comparison of positive EGFR mutation between tumor tissues and paired plasma was performed.
Relationships between the expression levels of the 5 selected hsa-miRNAs and the clinical characteristics of NSCLC patients
The expression levels of the 5 selected target hsa-miRNAs (hsa-miR-25, hsa-miR-122, hsa-miR-195, hsa-miR-21, and hsa-miR-125b) were validated by TaqMan real-time RT-PCR using tumor tissues, their corresponding adjacent normal lung tissues collected a minimum distance of 5 cm from the tumor and paired plasma samples in 149 patients with primary NSCLC. The 5 selected hsa-miRNAs in tumor tissues were significantly up-regulated than that in their paired adjacent normal lung tissues (all P<0.01), in which the fold-changes was 4.52, 4.51, 4.44, 3.9 and 3.94 times, respectively. The 5 selected hsa-miRNAs in paired plasma were also significantly up-regulated than the mean value in plasma from 20 healthy people, in which the fold-changes was 4.09, 3.91, 4.02, 3.55 and 3.55, respectively. The expression level of the 5 selected hsa-miRNAs in plasma compared with the results detected in their tumor tissues have the better consistency, and the correlation coefficient is 0.971, 0.943, 0.943, 0.976 and 0.966, respectively (all P=0.000, Figure 4).
Figure 4.
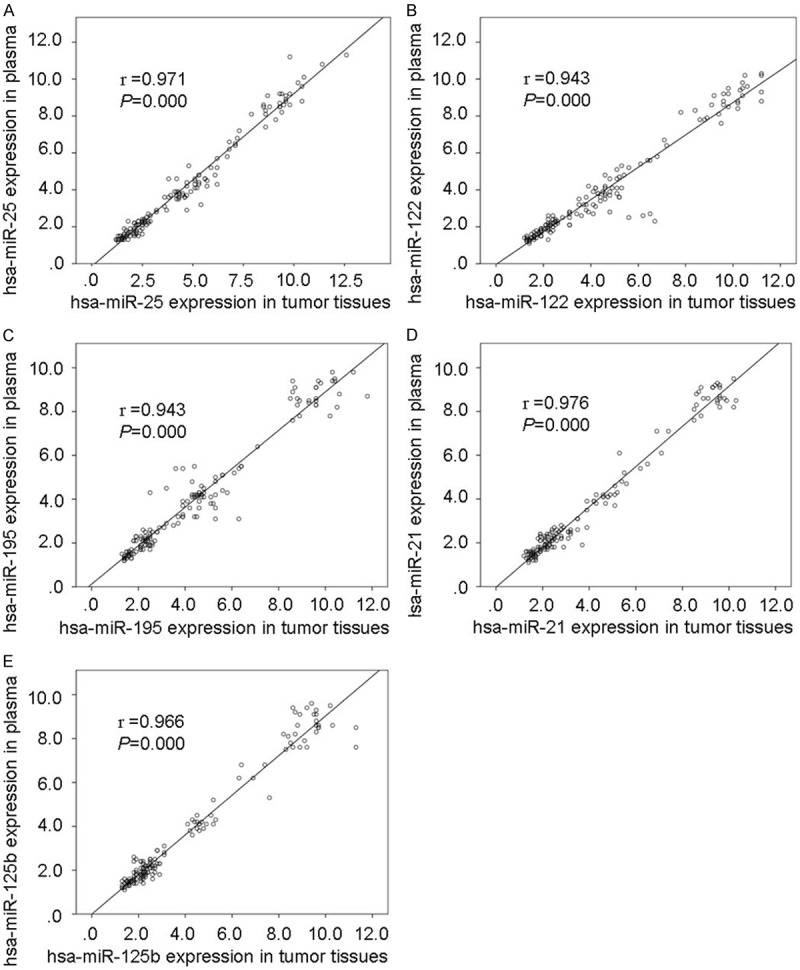
Correlation of hsa-miRNAs expression in tumor tissues with its expression in paired plasma. A: hsa-miR-25; B: hsa-miR-122; C: hsa-miR-195; D: hsa-miR-21; E: hsa-miR-125b.
The correlation between the 5 selected hsa-miRNAs results with clinicopathological factors was further analyzed. It was found that the up-regulation of the 5 selected hsa-miRNAs in tumor tissues and plasma were not correlated with sex and age at diagnosis, respectively (all P>0.05, Table 1A and 1B). The data showed that both up-regulation of the 5 selected hsa-miRNAs in tumor tissues and plasma significantly correlated with lymphatic involvement (all P=0.000), distant metastasis (all P=0.000), and clinical stage (all P=0.000), respectively (Table 1A and 1B).
Comparative studies between adenocarcinoma and squamous cell carcinoma have revealed significantly histological differences in the level of the 5 selected hsa-miRNAs expression, which was significantly up-regulated in lung adenocarcinoma than that in lung squamous cell carcinoma (all P<0.05). Both the expression of hsa-miRNA-25 and hsa-miR-122 in plasma were positively related with differentiation (both P=0.033), but there was no statistical significance in tissues. The expression level of hsa-miRNA-195 and hsa-miRNA-21 in NSCLC with moderate/well differentiation were significantly higher than that in patients with poor differentiation, whether it is from tissue or plasma specimens (all P<0.05). Both the hsa-miRNA-125b expression in tumor tissues or plasma were not related with differentiation (both P>0.05). Both the up-regulation of hsa-miR-25 in the tumor tissues and plasma were positively related with T-stage (P=0.02, 0.005, respectively). Plasma hsa-miR-122 level was positively related with T-stage (P=0.023), but the correlation of hsa-miR-122 level in tumor tissues with T-stage was close to significant difference (P=0.063). The up-regulation of hsa-miR-195 in tumor tissues was positively related with T-stage (P=0.03), but T-stage has not significant effect on plasma hsa-miR-195 level (P=0.168). The expression level of the has-miR-21 and has-miR-125b in both tumor tissues and plasma were not related with T-stage (all P>0.05). It is interesting that all the expression level of the 5 selected hsa-miRNAs in NSCLC with smoking were higher than that in those without smoking (all P<0.05), whether in tumor tissue or plasma specimens (Table 1A and 1B).
Collectively, these data based on Table 1A and 1B indicated that both the up-regulation of the 5 selected hsa-miRNAs in tumor tissues and plasma were significantly associated with tumor progression, but were not related with metastasis.
Discriminatory power of hsa-miRNAs associated gefitinib-sensitivity for primary NSCLC
Next, we investigated the correlation between the up-regulation of the 5 selected hsa-miRNAs in both tumor tissues and plasma with EGFR mutation in NSCLC patients. Results showed that up-regulation of the 5 selected hsa-miRNAs were related significantly with EGFR mutation in both tumor tissues and plasma (all P=0.000), which may be novel biomarker for EGFR mutation in NSCLC patients. The ROC analysis were established to evaluate the discriminatory power of detecting EGFR mutation using plasma miRNAs; the AUCs (area under the curve) were 0.733 (P=0.000, 95% confidence interval [CI]: 0.655-0.812), 0.733 (P=0.000, 95% CI: 0.655-0.812), 0.7 (P=0.000, 95% CI: 0.618-0.782), 0.8 (P=0.000, 95% CI: 0.730-0.870) and 0.797 (P=0.000, 95% CI: 0.725-0.869), respectively. The AUC of an optimum combination of 4 plasma hsa-miRNAs (miR-195, miR-122, miR-125, miR-21 and miR-25) is 0.869 (P=0.000, 95% CI: 0.808-0.930) (Figure 5).
Figure 5.
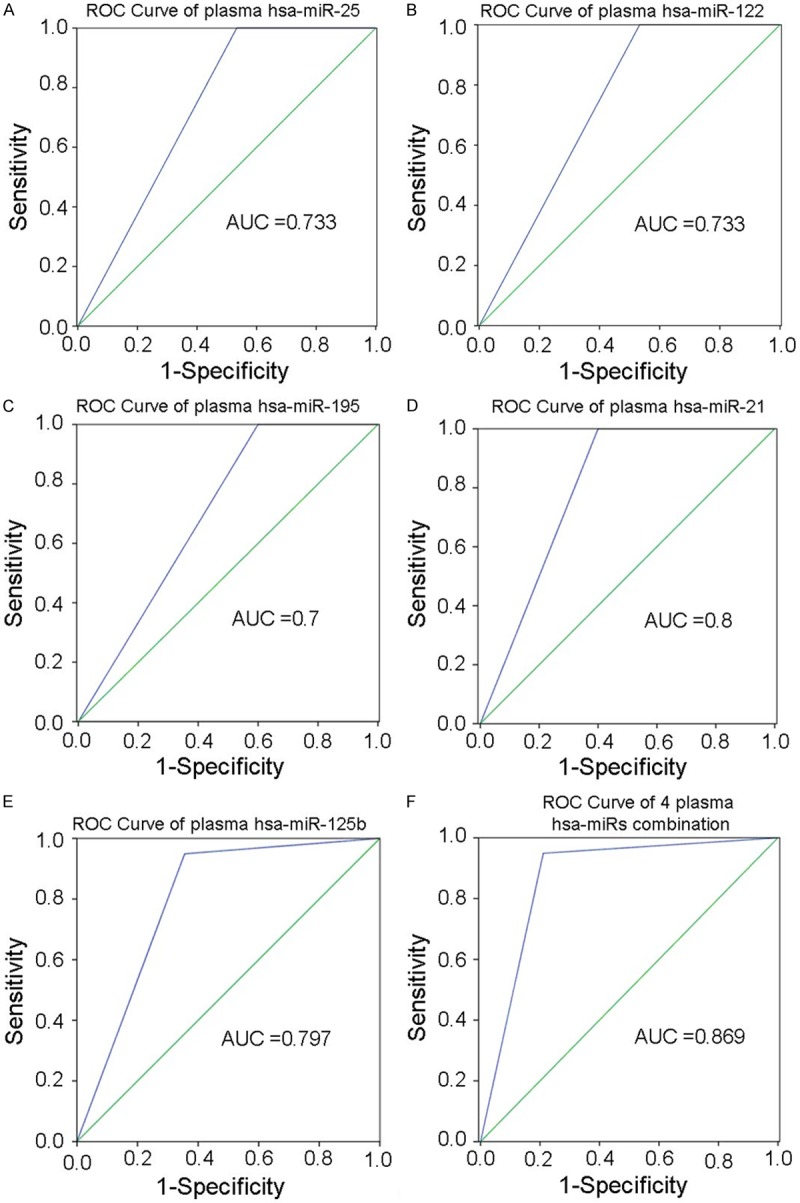
ROC analysis of 5 selected plasma hsa-miRNAs for EGFR mutation in NSCLC. A: hsa-miR-25; B: hsa-miR-122; C: hsa-miR-195; D: hsa-miR-21; E: hsa-miR-125b; F: The combination of 4 plasma hsa-miRNAs (miR-195, miR-122, miR-125, miR-21 and miR-25).
Circulating hsa-miR-125b predicts a poor prognosis for NSCLC patients
Kaplan-Meier analysis was used to analyze the association between the 5 selected miRNAs expression in the tumor tissues or plasma and patients survival. As shown in Figure 6, only hsa-miR-125b expression in plasma was an unfavorable predictor for the survival of NSCLC patients after surgery. Patients with hsa-miR-125b overexpression (≥2-folds) had significantly lower disease-free survival (DFS) as compared with those with lower hsa-miR-125b expression (<2-folds) (P=0.033; Figure 6A). There was significant difference in the overall survival (OS) between patients with hsa-miR-125b overexpression (≥2-folds) and those patients with lower hsa-miR-125b expression (<2-folds) (P=0.028). Cox regression models indicated that hsa-miR-125b overexpression in plasma is not a promising independent predictor of survival in NSCLC patients (P=0.166).
Figure 6.
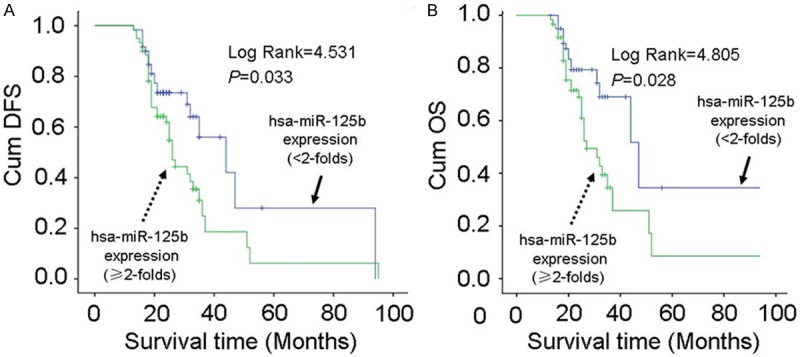
Correlation of plasma hsa-miR125b level with survival of NSCLC patients. A: Kaplan-Meier curves of DFS in NSCLC patients after surgery according to plasma hsa-miR125b level. B: Kaplan-Meier curves of OS in NSCLC patients after surgery according to plasma hsa-miR125b level.
Discussion
Global cancer statistics indicate that lung carcinoma is the leading cause of cancer deaths worldwide [16]. Recent clinical trials have demonstrated the efficacy of EGFR-TKI in the treatment of patients with advanced NSCLC. Successful analysis of EGFR mutations in advanced NSCLC has provided many patients with EGFR mutation-positive tumors with the opportunity to receive optimal, targeted treatments [7]. However, it is widely accepted that there are challenges in EGFR mutation testing practice. In the last few years, this has been particularly evident in the Asia-Pacific region, where a lack of access and/or adoption of EGFR mutation testing were a barrier to large-scale testing [17]. In a 2011 consensus meeting, tumor tissue acquisition and pre-test sample evaluation was considered as important steps to increase specificity and sensitivity of EGFR mutation testing, and to thus help standardize mutation test methodology in East Asia [17], but this sample type is not available for many patients. Then, a molecular-based treatment decision in these patients may be problematic, not only at diagnosis but also at progression, to detect sensitivity mutations (e.g., Glu-Ala750del, L858R, S768I, L861Q, G719A) in those who prepare to start first-line treatment with EGFR-TKI, like gefitinib.
Douillard JY, et al reported that patients with EGFR mutation-positive ctDNA, had a similar objective response rate (ORR) to patients with EGFR mutation-positive tumors (76.9% and 69.8%, respectively). Furthermore, the concordance, specificity, and sensitivity were all high. This result suggested that plasma was a suitable substitute for EGFR mutation analysis regardless of mutation subtype [18]. However, there are still challenges/gaps in current knowledge: Firstly, the mutation detection kits now are often validated solely on tumor-derived DNA, kits for use on surrogate sample types such as plasma are extremely rare; Secondly, the detectable mutations in the ctDNA of some patients is apparent lack, just as noted in the study above, the detection rate of EGFR mutation was 13.7% in tumor DNA and 10.5% in matched ctDNA [18]. It is therefore important to identify new markers in plasma that can be used to assess EGFR mutation status more accurately and conveniently.
Recently, the area of miRNAs has increased in intensity because of its important role in tumorigenesis and they have been considered promising candidates to be diagnostic markers and therapeutic targets [19-21]. MicroRNA (miRNA) expression is deregulated in lung cancer, and some miRNAs are associated with poor prognosis and survival [22-24]. Dacic S et al reported that despite the similarity in miRNA expression among lung adenocarcinomas with different somatic mutations, some miRNAs showed unique expression patterns, which were in strong correlation with the mutation type, suggesting different carcinogenic pathway for these tumors. These miRNAs can be further explored for their diagnostic and prognostic use [22]. It has been proved that miRNAs are present in human plasma in a remarkably stable form that is protected from endogenous RNase activity. Circulating cell-free microRNAs might play as stable noninvasive blood-based diagnostic, prognostic, and predictive biomarkers for common cancer [25-29]. It has been demonstrated that miRNAs in lung tissues and plasma might act as molecular predictors of lung carcinoma development and management outcome [30].
We analyzed the expression of 5 hsa-miRNAs (hsa-miR-195, hsa-miR-122, hsa-miR-125, hsa-miR-21 and hsa-miR-25) in NSCLC tissue and plasma samples for the analysis of association with EGFR mutation and clinicopathological data after miRNA array and validation experiments were performed, Results showed that plasma levels of the 5 hsa-miRNAs were associated with EGFR status. Guo H et al [31] reported that hsa-miR-195 was significantly decreased in both NSCLC tissues and cell lines, and miR-195 could significantly suppressed proliferation, invasion and migration of NSCLC cells by targeting HDGF [31] and IGF1R genes [32], which suggested a potential therapeutic target of miR-195 for NSCLC. We found that down-regulation of plasma hsa-miR-195 was associated with EGFR mutation, poor differentiation and lymphatic metastasis, especially in non-smoking advanced NSCLC patients. miR-122 is a liver-specific miRNAs representing two thirds of hepatic miRNAs, and the down-regulation of miR-122 was associated with HCC progression [33]. We found that down-regulation of plasma hsa-miR-122 was associated with EGFR mutation and lymphatic metastasis, especially in non-smoking advanced NSCLC patients. Zhang H, et al [34] also reported that miR-122 may have prognostic values in predicting the overall survival (OS) and the EGFR mutation in non-smoking female NSCLC patients, and plasma miR-122 may be useful for EGFR mutant NSCLC patients. miR-125 has been reported to be implicated in a variety of carcinomas. Wang GF, et al [35] demonstrated that miR-125a-5p inhibited migration and invasion of lung cancer cells and regulated the expression of several downstream genes of EGFR signaling, which provide compelling evidence that miR-125a-5p may function as a metastatic suppressor in lung cancer. Our results demonstrated that down-regulation of plasma hsa-miR-125p was associated with EGFR mutation and lymphatic metastasis, especially in non-smoking NSCLC patients, and plasma hsa-miR-125p level was correlated with DFS and OS of NSCLC patients. miR-21 is an oncogenic miRNA, which related to tumor growth and metastasis [36]. Shen H, et al [37] discovered that up-regulation of miR-21 decreased gefitinib sensitivity by down-regulating PTEN expression and activating Akt and ERK pathways in PC-9 cells, which provided a new basis for using miR-21/PTEN-based therapeutic strategy to reverse gefitinib resistance in NSCLC. We found that up-regulation of plasma hsa-miR-21 was associated with EGFR mutation, poor differentiation and lymphatic metastasis, which supports an important role of altered hsa-miR-21 expression during tumor development and indicates that hsa-miR-21 modulates gefitinib sensitivity in NSCLC patients. miR-25 may have diverse roles in different types of tumors [38]. Xu FX, et al. [39] reported that up-regulation of miR-25 in tissues was significantly associated with clincal stage, lymph node metastasis, and poor prognosis in female non-smoking NSCLC patients. But, no correlation of the miR-25 expression between tumor tissue and plasma levels in these patients was found. We found that up-regulation of hsa-miR-25 was associated with EGFR mutation and lymphatic metastasis, which indicates that miR-25 modulates gefitinib sensitivity in NSCLC patients, and there was a close correlation of the miR-25 expression between tumor tissue and plasma levels in NSCLC patients.
Circulating miRNAs could be useful for predicting EGFR mutation in NSCLC. Zhang H, et al [34] analyzed the plasma level of 20 miRNAs in 105 female NSCLC patients, and found plasma levels of miR-195 and miR-122 were associated with OS of patients, especially in those advanced patients with EGFR mutation. Weiss GJ, et al [35] initially showed that miR-128b directly regulated EGFR and was significantly correlated with clinical response and survival following gefitinib. We found that there was a high concordance of the 5 selected miRNAs level between in tumor tissues and plasma in NSCLC patients, suggesting the feasibility of plasma miRNAs as a biomarker. The ROC analysis showed that the AUCs of hsa-miR-25, hsa-miR-122, hsa-miR-195, hsa-miR-21 and hsa-miR-125b was 0.733, 0.733, 0.7, 0.8 and 0.797, respectively. We used the method of miRNAs combination to searching the most sensitive model in predict EGFR mutation and gefitinib-sensitivity. The AUC of an optimum combination using 4 plasma hsa-miRNAs (miR-195, miR-122, miR-125, miR-21 and miR-25) is 0.869. In conclusion, our study showed that plasma level of the 5 selected miRNAs were associated with EGFR mutation in NSCLC patients, respectively. A model including miR-195, miR-125, miR-21 and miR-25 may predict EGFR mutation and gefitinib-sensitivity better. Circulating miRNAs are potential non-invasive biomarker for prediction of EGFR mutation.
Acknowledgements
This research was partly supported by a grant from Qianjiang Talent Project of Zhejiang Province (QJD1102015), a grant from the Backbone Talent of Zhejiang Provincial Medicine and Hygiene Platform Programs (no. 2011RCA016), partly sponsored by Zhejiang Provincial Program for the Cultivation of High-level Innovative Health talents (Ling ZQ), and the Major Training Personnel from Zhejiang Provincial Program for the Training and Development Project for 151 talents (Ling ZQ).
Disclosure of conflict of interest
None.
References
- 1.Kotoulas C, Panagiotou I, Tsipas P, Melachrinou M, Alexopoulos D, Dougenis D. Experimental studies in the bronchial circulation. Which is the ideal animal model? J Thorac Dis. 2014;6:1506–1512. doi: 10.3978/j.issn.2072-1439.2014.09.32. [DOI] [PMC free article] [PubMed] [Google Scholar]
- 2.Sardenberg RA, Mello ES, Younes RN. The lung adenocarcinoma guidelines: what to be considered by surgeons. J Thorac Dis. 2014;6:S561–567. doi: 10.3978/j.issn.2072-1439.2014.08.25. [DOI] [PMC free article] [PubMed] [Google Scholar]
- 3.Karachaliou N, Rosell R. Systemic treatment in EGFR-ALK NSCLC patients: second line therapy and beyond. Cancer Biol Med. 2014;11:173–81. doi: 10.7497/j.issn.2095-3941.2014.03.003. [DOI] [PMC free article] [PubMed] [Google Scholar]
- 4.Jorge SE, Kobayashi SS, Costa DB. Epidermal growth factor receptor (EGFR) mutations in lung cancer: preclinical and clinical data. Braz J Med Biol Res. 2014;47:929–939. doi: 10.1590/1414-431X20144099. [DOI] [PMC free article] [PubMed] [Google Scholar]
- 5.Paez JG, Jänne PA, Lee JC, Tracy S, Greulich H, Gabriel S, Herman P, Kaye FJ, Lindeman N, Boggon TJ, Naoki K, Sasaki H, Fujii Y, Eck MJ, Sellers WR, Johnson BE, Meyerson M. EGFR mutations in lung cancer: correlation with clinical response to gefitinib therapy. Science. 2004;304:1497–1500. doi: 10.1126/science.1099314. [DOI] [PubMed] [Google Scholar]
- 6.Sequist LV, Joshi VA, Jänne PA, Muzikansky A, Fidias P, Meyerson M, Haber DA, Kucherlapati R, Johnson BE, Lynch TJ. Response to treatment and survival of patients with non-small cell lung cancer undergoing somatic EGFR mutation testing. Oncologist. 2007;12:90–98. doi: 10.1634/theoncologist.12-1-90. [DOI] [PubMed] [Google Scholar]
- 7.Li T, Kung HJ, Mack PC, Gandara DR. Genotyping and genomic profiling of non-small-cell lung cancer: implications for current and future therapies. J. Clin. Oncol. 2013;31:1039–1049. doi: 10.1200/JCO.2012.45.3753. [DOI] [PMC free article] [PubMed] [Google Scholar]
- 8.Garassino MC, Martelli O, Broggini M, Farina G, Veronese S, Rulli E, Bianchi F, Bettini A, Longo F, Moscetti L, Tomirotti M, Marabese M, Ganzinelli M, Lauricella C, Labianca R, Floriani I, Giaccone G, Torri V, Scanni A, Marsoni S TAILOR trialists. Erlotinib versus docetaxel as second-line treatment of patients with advanced non-small-cell lung cancer and wild-type EGFR tumours (TAILOR): a randomised controlled trial. Lancet Oncol. 2013;14:981–988. doi: 10.1016/S1470-2045(13)70310-3. [DOI] [PubMed] [Google Scholar]
- 9.Shah MY, Calin GA. MicroRNAs miR-221 and miR-222: a new level of regulation in aggressive breast cancer. Genome Med. 2011;3:56. doi: 10.1186/gm272. [DOI] [PMC free article] [PubMed] [Google Scholar]
- 10.Hayashi T, Koyama N, Gresik EW, Kashimata M. Detection of EGF-dependent microRNAs of the fetal mouse submandibular gland at embryonic day 13. J Med Invest. 2009;56(Suppl):250–252. doi: 10.2152/jmi.56.250. [DOI] [PubMed] [Google Scholar]
- 11.Avraham R, Sas-Chen A, Manor O, Steinfeld I, Shalgi R, Tarcic G, Bossel N, Zeisel A, Amit I, Zwang Y, Enerly E, Russnes HG, Biagioni F, Mottolese M, Strano S, Blandino G, Børresen-Dale AL, Pilpel Y, Yakhini Z, Segal E, Yarden Y. EGF decreases the abundance of microRNAs that restrain oncogenic transcription factors. Sci Signal. 2010;3:ra43. doi: 10.1126/scisignal.2000876. [DOI] [PubMed] [Google Scholar]
- 12.Teixeira AL, Gomes M, Medeiros R. EGFR signaling pathway and related-miRNAs in age-related diseases: the example of miR-221 and miR-222. Front Genet. 2012;3:286. doi: 10.3389/fgene.2012.00286. [DOI] [PMC free article] [PubMed] [Google Scholar]
- 13.Ng EK, Chong WW, Jin H, Lam EK, Shin VY, Yu J, Poon TC, Ng SS, Sung JJ. Differential expression of microRNAs in plasma of patients with colorectal cancer: a potential marker for colorectal cancer screening. Gut. 2009;58:1375–1381. doi: 10.1136/gut.2008.167817. [DOI] [PubMed] [Google Scholar]
- 14.Nikiforova MN, Tseng GC, Steward D, Diorio D, Nikiforov YE. MicroRNA expression profiling of thyroid tumors: biological significance and diagnostic utility. J Clin Endocrinol Metab. 2008;93:1600–1608. doi: 10.1210/jc.2007-2696. [DOI] [PMC free article] [PubMed] [Google Scholar]
- 15.Yang H, Cai L, Zhang Y, Tan H, Deng Q, Zhao M, Xu X. Sensitive detection of EGFR mutations in cerebrospinal fluid from lung adenocarcinoma patients with brain metastases. J Mol Diagn. 2014;16:558–563. doi: 10.1016/j.jmoldx.2014.04.008. [DOI] [PubMed] [Google Scholar]
- 16.Jemal A, Bray F, Center MM, Ferlay J, Ward E, Forman D. Global cancer statistics. CA Cancer J Clin. 2011;61:69–90. doi: 10.3322/caac.20107. [DOI] [PubMed] [Google Scholar]
- 17.Salto-Tellez M, Tsao MS, Shih JY, Thongprasert S, Lu S, Chang GC, Au JS, Chou TY, Lee JS, Shi YK, Radzi A, Kang JH, Kim SW, Tan SY, Yang JC. Clinical and testing protocols for the analysis of epidermal growth factor receptor mutations in East Asian patients with non-small cell lung cancer: a combined clinical-molecular pathological approach. J Thorac Oncol. 2011;6:1663–1639. doi: 10.1097/JTO.0b013e318227816a. [DOI] [PubMed] [Google Scholar]
- 18.Douillard JY, Ostoros G, Cobo M, Ciuleanu T, Cole R, McWalter G, Walker J, Dearden S, Webster A, Milenkova T, McCormack R. Gefitinib treatment in EGFR mutated caucasian NSCLC: circulating-free tumor DNA as a surrogate for determination of EGFR status. J Thorac Oncol. 2014;9:1345–1353. doi: 10.1097/JTO.0000000000000263. [DOI] [PMC free article] [PubMed] [Google Scholar]
- 19.Bovell LC, Putcha BD, Samuel T, Manne U. Clinical implications of microRNAs in cancer. Biotech Histochem. 2013;88:388–396. doi: 10.3109/10520295.2013.788735. [DOI] [PMC free article] [PubMed] [Google Scholar]
- 20.Krell J, Frampton AE, Stebbing J. MicroRNAs in the cancer clinic. Front Biosci (Elite Ed) 2013;5:204–13. doi: 10.2741/e608. [DOI] [PubMed] [Google Scholar]
- 21.Qian B, Nag SA, Su Y, Voruganti S, Qin JJ, Zhang R, Cho WC. miRNAs in cancer prevention and treatment and as molecular targets for natural product anticancer agents. Curr Cancer Drug Targets. 2013;13:519–541. doi: 10.2174/15680096113139990031. [DOI] [PubMed] [Google Scholar]
- 22.Dacic S, Kelly L, Shuai Y, Nikiforova MN. miRNA expression profiling of lung adenocarcinomas: correlation with mutational status. Mod Pathol. 2010;23:1577–1582. doi: 10.1038/modpathol.2010.152. [DOI] [PubMed] [Google Scholar]
- 23.Cancer Genome Atlas Research Network. Comprehensive molecular profiling of lung adenocarcinoma. Nature. 2014;511:543–550. doi: 10.1038/nature13385. [DOI] [PMC free article] [PubMed] [Google Scholar]
- 24.Ma J, Mannoor K, Gao L, Tan A, Guarnera MA, Zhan M, Shetty A, Stass SA, Xing L, Jiang F. Characterization of microRNA transcriptome in lung cancer by next-generation deep sequencing. Mol Oncol. 2014;8:1208–1219. doi: 10.1016/j.molonc.2014.03.019. [DOI] [PMC free article] [PubMed] [Google Scholar]
- 25.Zandberga E, Kozirovskis V, Ābols A, Andrējeva D, Purkalne G, Linē A. Cell-free microRNAs as diagnostic, prognostic, and predictive biomarkers for lung cancer. Genes Chromosomes Cancer. 2013;52:356–369. doi: 10.1002/gcc.22032. [DOI] [PubMed] [Google Scholar]
- 26.Sun Y, Zhang K, Fan G, Li J. Identification of circulating microRNAs as biomarkers in cancers: what have we got? Clin Chem Lab Med. 2012;50:2121–2126. doi: 10.1515/cclm-2012-0360. [DOI] [PubMed] [Google Scholar]
- 27.Mitchell PS, Parkin RK, Kroh EM, Fritz BR, Wyman SK, Pogosova-Agadjanyan EL, Peterson A, Noteboom J, O’Briant KC, Allen A, Lin DW, Urban N, Drescher CW, Knudsen BS, Stirewalt DL, Gentleman R, Vessella RL, Nelson PS, Martin DB, Tewari M. Circulating microRNAs as stable blood-based markers for cancer detection. Proc Natl Acad Sci U S A. 2008;105:10513–10518. doi: 10.1073/pnas.0804549105. [DOI] [PMC free article] [PubMed] [Google Scholar]
- 28.Kodahl AR, Lyng MB, Binder H, Cold S, Gravgaard K, Knoop AS, Ditzel HJ. Novel circulating microRNA signature as a potential non-invasive multi- marker test in ER-positive early-stage breast cancer: a case control study. Mol Oncol. 2014;8:874–883. doi: 10.1016/j.molonc.2014.03.002. [DOI] [PMC free article] [PubMed] [Google Scholar]
- 29.Selth LA, Tilley WD, Butler LM. Circulating microRNAs: macro-utility as markers of prostate cancer? Endocr Relat Cancer. 2012;19:R99–R113. doi: 10.1530/ERC-12-0010. [DOI] [PubMed] [Google Scholar]
- 30.Boeri M, Verri C, Conte D, Roz L, Modena P, Facchinetti F, Calabrò E, Croce CM, Pastorino U, Sozzi G. MicroRNA signatures in tissues and plasma predict development and prognosis of computed tomography detected lung cancer. Proc Natl Acad Sci U S A. 2011;108:3713–3718. doi: 10.1073/pnas.1100048108. [DOI] [PMC free article] [PubMed] [Google Scholar]
- 31.Guo H, Li W, Zheng T, Liu Z. miR-195 Targets HDGF to inhibit proliferation and invasion of NSCLC cells. Tumour Biol. 2014;35:8861–8866. doi: 10.1007/s13277-014-2153-0. [DOI] [PubMed] [Google Scholar]
- 32.Wang X, Wang Y, Lan H, Li J. miR-195 inhibits the growth and metastasis of NSCLC cells by targeting IGF1R. Tumour Biol. 2014;35:8765–8770. doi: 10.1007/s13277-014-2140-5. [DOI] [PubMed] [Google Scholar]
- 33.Gramantieri L, Ferracin M, Fornari F, Veronese A, Sabbioni S, Liu CG, Calin GA, Giovannini C, Ferrazzi E, Grazi GL, Croce CM, Bolondi L, Negrini M. Cyclin G1 is a target of miR-122a, a microRNA frequently down-regulated in human hepatocellular carcinoma. Cancer Res. 2007;67:6092–6099. doi: 10.1158/0008-5472.CAN-06-4607. [DOI] [PubMed] [Google Scholar]
- 34.Zhang H, Su Y, Xu F, Kong J, Yu H, Qian B. Circulating microRNAs in relation to EGFR status and survival of lung adenocarcinoma in female non-smokers. PLoS One. 2013;8:e81408. doi: 10.1371/journal.pone.0081408. [DOI] [PMC free article] [PubMed] [Google Scholar]
- 35.Wang G, Mao W, Zheng S, Ye J. Epidermal growth factor receptor-regulated miR-125a-5p--a metastatic inhibitor of lung cancer. FEBS J. 2009;276:5571–5578. doi: 10.1111/j.1742-4658.2009.07238.x. [DOI] [PMC free article] [PubMed] [Google Scholar]
- 36.Yang SM, Huang C, Li XF, Yu MZ, He Y, Li J. miR-21 confers cisplatin resistance in gastric cancer cells by regulating PTEN. Toxicology. 2013;306:162–168. doi: 10.1016/j.tox.2013.02.014. [DOI] [PubMed] [Google Scholar]
- 37.Shen H, Zhu F, Liu J, Xu T, Pei D, Wang R, Qian Y, Li Q, Wang L, Shi Z, Zheng J, Chen Q, Jiang B, Shu Y. Alteration in Mir-21/PTEN expression modulates gefitinib resistance in non-small cell lung cancer. PLoS One. 2014;9:e103305. doi: 10.1371/journal.pone.0103305. [DOI] [PMC free article] [PubMed] [Google Scholar]
- 38.Wu X, Ajani JA, Gu J, Chang DW, Tan W, Hildebrandt MA, Huang M, Wang KK, Hawk E. MicroRNA expression signatures during malignant progression from Barrett’s esophagus to esophageal adenocarcinoma. Cancer Prev Res (Phila) 2013;6:196–205. doi: 10.1158/1940-6207.CAPR-12-0276. [DOI] [PMC free article] [PubMed] [Google Scholar]
- 39.Xu FX, Su YL, Zhang H, Kong JY, Yu H, Qian BY. Prognostic implications for high expression of MiR-25 in lung adenocarcinomas of female non-smokers. Asian Pac J Cancer Prev. 2014;15:1197–203. doi: 10.7314/apjcp.2014.15.3.1197. [DOI] [PubMed] [Google Scholar]
- 40.Weiss GJ, Bemis LT, Nakajima E, Sugita M, Birks DK, Robinson WA, Varella-Garcia M, Bunn PA Jr, Haney J, Helfrich BA, Kato H, Hirsch FR, Franklin WA. EGFR regulation by microRNA in lung cancer: correlation with clinical response and survival to gefitinib and EGFR expression in cell lines. Ann Oncol. 2008;19:1053–1059. doi: 10.1093/annonc/mdn006. [DOI] [PubMed] [Google Scholar]