Abstract
The human tongue is composed of multiple internal muscles that work collaboratively during the production of speech. Assessment of muscle mechanics can help understand the creation of tongue motion, interpret clinical observations, and predict surgical outcomes. Although various methods have been proposed for computing the tongue's motion, associating motion with muscle activity in an interdigitated fiber framework has not been studied. In this work, we aim to develop a method that reveals different tongue muscles' activities in different time phases during speech. We use four-dimensional tagged magnetic resonance (MR) images and static high-resolution MR images to obtain tongue motion and muscle anatomy, respectively. Then we compute strain tensors and local tissue compression along the muscle fiber directions in order to reveal their shortening pattern. This process relies on the support from multiple image analysis methods, including super-resolution volume reconstruction from MR image slices, segmentation of internal muscles, tracking the incompressible motion of tissue points using tagged images, propagation of muscle fiber directions over time, and calculation of strain in the line of action, etc. We evaluated the method on a control subject and two post-glossectomy patients in a controlled speech task. The normal subject's tongue muscle activity shows high correspondence with the production of speech in different time instants, while both patients' muscle activities show different patterns from the control due to their resected tongues. This method shows potential for relating overall tongue motion to particular muscle activity, which may provide novel information for future clinical and scientific studies.
Keywords: Speech, tongue, muscle, MRI, tagged, motion, strain, fiber, compression
1. Introduction
The motor control of human tongue muscles has been of great interest to oral surgeons, neurologists, and speech pathologists, but is challenging to understand because the tongue is composed of orthogonal interdigitated muscles that interact with each other to create myriad shapes critical for producing speech[1-3]. In a normal subject's speech, the tongue is highly deformable and performs precise motion over short periods of time. However, for a patient who has received glossectomy surgery to remove a cancerous section of the tongue, the abnormal tongue morphology may result in defective muscle coordination and impaired speech function[4, 5]. We are therefore interested in linking the activity of each internal tongue muscle to different overall tongue motions.
Magnetic resonance (MR) imaging is a noninvasive technique that is capable of imaging both anatomical structures and tissue motion. Tagged MR imaging places magnetic “tags” within a region of tissue that deform together with the tongue. The motion information of the tongue is captured in the deformed tags and can be extracted by processing a time sequence of tagged MR images during speech[6]. However, tagged MR images provide only low resolution anatomical information. Therefore, to reveal the internal tongue muscles and their fiber direction, static high-resolution MR images are acquired in the same slice locations when the tongue is in a resting state. These images have much better resolution than tagged MR images and are used to manually segment tongue muscles and show their anatomical structure.
There has been previous work focusing on computing the overall motion of the tongue[7-9]. The major goal has been to increase estimation accuracy while respecting the tongue's incompressibility[10]. Meanwhile, strain derived from the estimated motion has been hard to interpret. The challenge is mainly because various tongue muscles are interdigitated and activate in different patterns to create a deformation, resulting in complex principal strain directions that are difficult to visually and quantitatively assess. In the present work, we tackle the problem by linking the estimated tongue motion with a fine segmentation of the internal muscle structures from high-resolution images. Strain along the muscle fiber directions can be computed after motion is related to individual muscles, yielding a result that enables visual and quantitative assessment. The final goal is to trace the production of speech and motion patterns back to the activation (compression) of specific muscles. Since the proposed method needs both sources of information from tagged and high-resolution MR images, various image analysis techniques are required to deal with the detailed processing, such as the accurate estimation of motion, the reconstruction of image volumes from slices, the segmentation of muscles, the generation of fiber direction, and the computation of projected strain tensors. We describe these steps in the next section with a focus on the method of computing strain in the line of action of muscle fibers.
2. Methods
During data acquisition, participants are asked to carry out a controlled speech task to pronounce the utterance “a souk” in repeated speech cycles while tagged MR images (Figures 1(a) and 1(b)) are acquired in order to capture the tongue's motion as deformed tags. The utterance is captured in one second with 26 time frames, where the tongue is expected to start from a speech-ready position at /ə/, perform a forward motion to pronounce /s/, move back into the /u/, and end with an upward motion to pronounce /k/.
Figure 1.

An example of tagged MR image in two directions is shown in (a) and (b). 3D motion computed from tag deformation is shown in (c) at time frame /s/ for forward motion and (d) at time frame /k/ for upward motion.
Tagged image slices are processed by the harmonic phase algorithm[6] at every time frame. The result is a sequence of two-dimensional (2D) motion fields at each slice location. These 2D motion slices are then combined by the enhanced incompressible deformation estimation algorithm[9] to get a dense three-dimensional (3D) motion field at every time frame that reflects the tongue's incompressible motion (Figures 1(c) and 1(d)). We denote the displacement field as u(x, t). Hereafter, we omit the variable t since we treat each deformed time frame independently.
For every subject's tongue, high-resolution MR images are acquired in a static state (Figure 2(a)). A super-resolution algorithm “SUPERV”[11] is used on the slices to generate a dense 3D high-resolution volume. Manual segmentation is performed on this volume to label all muscles of the tongue (Figure 2(b)). We study the genioglossus (GG) muscle, a major muscle of the tongue, which has fan-shaped fibers coursing from its origin at the inner aspect of the mandible to its insertion along the entire upper surface of the midline tongue, from front to back. We also focus on a second muscle called the transverse (T) muscle, which courses from left to right across the tongue, with two halves divided by the midline septum of the tongue. T interdigitates with GG for about 1 cm on either side of the midline of the tongue. The muscle fiber directions are specified (rather than measured) on every GG and T voxel (Figures 2(c) and 2(d)). We denote these directions by dGG(X) and dT(X), respectively. Here we use X for the coordinates of the undeformed static time frame. The deformation gradient tensor[12] is defined as and can be computed from the 3D motion result. The muscle fiber direction at each deformed time frame can then be propagated by dGG(x) = F(x)dGG(X(x)) and dT(x) = F(x)dT(X(x)).
Figure 2.

(a) A high-resolution MR mid-sagittal image slice. (b) Manual segmentation of the tongue muscles in 3D. (c) Genioglossus muscle fiber direction. (d) Transverse muscle fiber direction.
The Eulerian strain tensor[12], defined as , is widely used to reveal local stretch or compression caused by tissue deformation. Its three principal directions and eigenvalues show the direction and type of deformation, where positive value means stretch and negative value means compression. In order to see the deformation along the muscles, a projection of Eulerian strain to the fiber directions followed by computing the 2-norm is necessary. However, any negative value is going to be converted to positive by the norm, losing its indication of compression. To solve this problem, we use the relationship between the deformation gradient tensor and the Eulerian strain. Instead of using E(x), we project F(x) to the fiber directions, i.e.,
| (1) |
At each voxel, the result is a scalar between the first and the third singular value of F(x), indicating the ratio that a local tissue point deforms along a muscle fiber against its original length. We refer to this quantity as a strain in the line of action (SLA). A value greater than 1 shows stretch and a value less than 1 shows compression. To show compression only (which could be an indication of activation), we threshold the ratio with a value T, 0 < T < 1. The result is a sequence of masks on the corresponding muscle that shows its potentially activated region at each time frame, i.e.,
| (2) |
3. Results
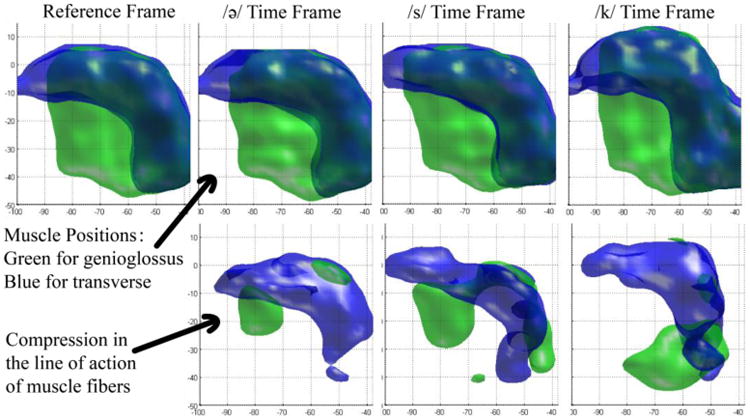
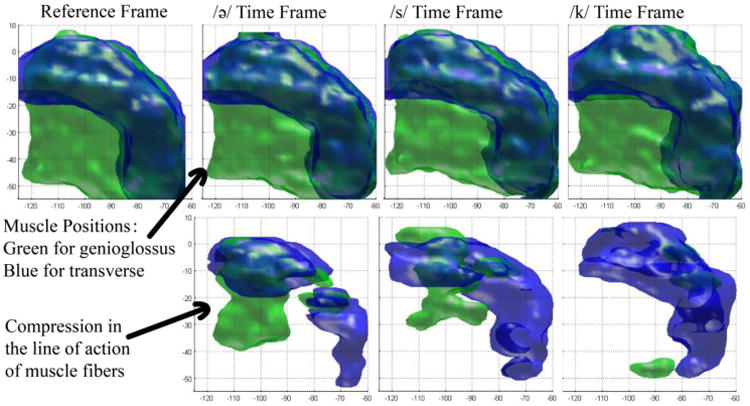
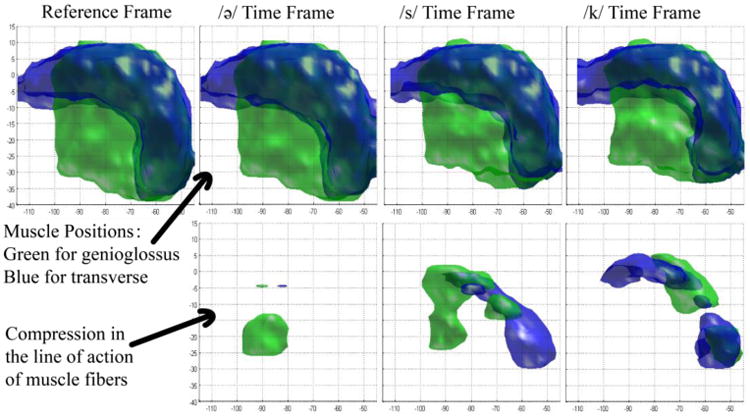
The method was evaluated on three subjects: one normal subject and two post-glossectomy patients. For each subject, we computed SLA, and considered more than 2% compression to be above the level of noise. The muscle masks after thresholding are shown in the bottom rows of Figures 3, 4, and 5 for the control, the first patient, and the second patient, respectively, while the top rows show their original muscle masks for comparison. These figures visualize the part of the GG and T muscle that is compressed during different tongue deformations. For example, GG shortens anteriorly during /ə/, medially during /s/ and posteriorly during /k/ for the control and patient 1, but not patient 2.
Figure 3.

Strain in the line of action of muscle fibers of the control. The top row is the segmented shape of GG (green) and T (blue) muscles at different time frames. In the bottom row, local compression of genioglossus is shown in green, and compression of transverse is shown in blue for the same time frames.
Figure 4.

Strain in the line of action of muscle fibers of patient 1. The top row is the segmented shapes and the bottom row is the local compression of muscles.
Figure 5.

Strain in the line of action of muscle fibers of patient 2. The top row is the segmented shapes and the bottom row is the local compression of muscles.
In addition, for numerical assessment, we computed the percentage of the compressed muscle volumes relative to the whole volume. This value at critical time frames is shown in Table 1 and reflects the portion of the GG and T muscle that is under more than 2% compression.
Table 1. Percentage of activated muscles at critical time frames during utterance “a souk”.
| Genioglossus Muscle (GG) | Transverse Muscle (T) | |||||
|---|---|---|---|---|---|---|
|
|
||||||
| Time Frame /ə/ | Time Frame /s/ | Time Frame /k/ | Time Frame /ə/ | Time Frame /s/ | Time Frame /k/ | |
| Control | 10.1 | 45.3 | 20.4 | 32.4 | 41.3 | 52.3 |
| Patient 1 | 24.5 | 25.3 | 3.7 | 6.4 | 27.3 | 49.7 |
| Patient 2 | 13.4 | 26.1 | 9.7 | 4.0 | 9.9 | 16.4 |
4. Discussion
Results on a control and two post-glossectomy patients show great correspondence between tongue muscle compression and speech production. In the control, the activated parts of GG and T muscles at different time frames can be clearly interpreted. At time frame /ə/ where the tongue is at a speech-ready position, a small portion of anterior GG and T are both compressed during the slight retraction of the tip of the tongue. Then the tip is moved forward to pronounce /s/, compressing a larger region of anterior GG and a small portion of T. During /s/, we also see that the middle portion of GG compresses in order to flatten the mid-sagittal part of the tongue and create the center groove necessary to funnel the air across the top of the tongue. Last, at the /k/ sound, anterior GG stops compressing, while posterior GG and posterior T overlap in a highly compressed region at the bottom back part of the tongue. This strong joint compression in this region is consistent with squeezing the tongue both left-right and forward-backward, making it elongate upwards, which is necessary to touch the palate and produce the /k/ sound.
On the other hand, the patients' muscle activities are less predictable than the control subject due to their resected tongues, which impair their regular motor functions. In the first patient, the pronunciation of the /ə/ sound and the /s/ sound appears normal with similar muscle behavior to the control. But during the /k/ sound, posterior GG does not show strong activity to compress the bottom of the tongue in forward and backward directions. The T muscle only is responsible for pushing the tongue upward. This could cause improper /k/ pronunciation or muscle fatigue in normal speech. In the second patient, the compressed muscle part is less than the other two subjects by a large amount. The resection of the tongue may be impeding its ordinary contracting abilities. Table 1 also provides similar interpretation. We note that although the patients' tongues show special behaviors, their general trend of motion is the same as that of the control, with strong GG activity at /s/ and increasing T activity at /k/. This enables all three subjects to be able to legibly pronounce the utterance “a souk”.
This method of strain analysis is still being developed. In the future, manual generation of fiber directions should be replaced by the result from tongue DTI techniques. Manual segmentation of the two GG and T muscles should be replaces by a complete set of internal tongue muscles obtained from registration of a tongue atlas[13]. Moreover, we are looking to study the behavior of more muscles in more subjects during various speech patterns.
5. Conclusion
In this work we have described a method for analysis of motor control of internal tongue muscles. The method combined both sources of information acquired from tagged and high-resolution MR images, and used SLA along the muscle fibers to reveal tissue compression consistent with muscle activation. Preliminary results on a small number of subjects were obtained, which showed high correspondence between muscle activities and speech production, demonstrating the method's potential to aid future motor control studies.
Acknowledgments
This project was supported by NIH/NCI 5R01CA133015.
References
- 1.Kier WM, Smith KK. Tongues, tentacles and trunks: the biomechanics of movement in muscular-hydrostats. Zoological Journal of the Linnean Society. 1985;83(4):307–324. [Google Scholar]
- 2.Abd-El-Malek S. The part played by the tongue in mastication and deglutition. Journal of anatomy. 1955;89(Pt 2):250. [PMC free article] [PubMed] [Google Scholar]
- 3.Takemoto H. Morphological analyses of the human tongue musculature for three-dimensional modeling. Journal of Speech, Language, and Hearing Research. 2001;44(1):95–107. doi: 10.1044/1092-4388(2001/009). [DOI] [PubMed] [Google Scholar]
- 4.Nicoletti G, Soutar DS, Jackson MS, Wrench AA, Robertson G, Robertson C. Objective assessment of speech after surgical treatment for oral cancer: experience from 196 selected cases. Plastic and reconstructive surgery. 2004;113(1):114–125. doi: 10.1097/01.PRS.0000095937.45812.84. [DOI] [PubMed] [Google Scholar]
- 5.Pauloski BR, Logemann JA, Colangelo LA, Rademaker AW, McConnel F, Heiser MA, et al. Esclamado R. Surgical variables affecting speech in treated patients with oral and oropharyngeal cancer. The Laryngoscope. 1998;108(6):908–916. doi: 10.1097/00005537-199806000-00022. [DOI] [PubMed] [Google Scholar]
- 6.Osman NF, McVeigh ER, Prince JL. Imaging heart motion using harmonic phase MRI. Medical Imaging, IEEE Transactions on. 2000;19(3):186–202. doi: 10.1109/42.845177. [DOI] [PubMed] [Google Scholar]
- 7.Parthasarathy V, Prince JL, Stone M, Murano EZ, NessAiver M. Measuring tongue motion from tagged cine-MRI using harmonic phase (HARP) processing. The Journal of the Acoustical Society of America. 2007;121(1):491–504. doi: 10.1121/1.2363926. [DOI] [PubMed] [Google Scholar]
- 8.Xing F, Lee J, Woo J, Murano EZ, Stone M, Prince JL. Estimating 3D tongue motion with MR images. Asilomar Conference on Signals, Systems, and Computers; Monterey, CA. 2012. [Google Scholar]
- 9.Xing F, Woo J, Murano EZ, Lee J, Stone M, Prince JL. 3D Tongue Motion from Tagged and Cine MR Images. Medical Image Computing and Computer-Assisted Intervention–MICCAI 2013. 2013:41–48. doi: 10.1007/978-3-642-40760-4_6. [DOI] [PMC free article] [PubMed] [Google Scholar]
- 10.Liu X, Abd-Elmoniem KZ, Stone M, Murano EZ, Zhuo J, Gullapalli RP, Prince JL. Incompressible deformation estimation algorithm (IDEA) from tagged MR images. Medical Imaging, IEEE Transactions on. 2012;31(2):326–340. doi: 10.1109/TMI.2011.2168825. [DOI] [PMC free article] [PubMed] [Google Scholar]
- 11.Woo J, Murano EZ, Stone M, Prince JL. Reconstruction of high-resolution tongue volumes from MRI. Biomedical Engineering, IEEE Transactions on. 2012;59(12):3511–3524. doi: 10.1109/TBME.2012.2218246. [DOI] [PMC free article] [PubMed] [Google Scholar]
- 12.Gurtin ME. An Introduction to Continuum Mechanics. Academic Press; New York: 1982. pp. 41–51. [Google Scholar]
- 13.Woo J, Lee J, Murano EZ, Xing F, Al-Talib M, Stone M, Prince JL. A high-resolution atlas and statistical model of the vocal tract from structural MRI. Computer Methods in Biomechanics and Biomedical Engineering: Imaging & Visualization. 2014:1–14. doi: 10.1080/21681163.2014.933679. ahead-of-print. [DOI] [PMC free article] [PubMed] [Google Scholar]


