

Abstract
Myelin-reactive T cells have been identified in patients with multiple sclerosis (MS) and healthy subjects with comparable frequencies, but the functional programs of self-reactive T cells that promote disease remain unknown. A total of 13,324 T cell libraries generated from blood of 23 patients and 22 healthy controls were interrogated for reactivity to myelin antigens. Libraries derived from CCR6+ myelin-reactive T cells from patients with MS exhibited significantly enhanced production of IFN-γ, IL-17, and GM-CSF compared to healthy controls. Single-cell clones isolated by MHC/peptide tetramers from CCR6+ T cell libraries also secreted more pro-inflammatory cytokines while clones isolated from controls secreted more IL-10. The transcriptomes of myelin-specific CCR6+ T cells from patients with MS were distinct from those derived from healthy controls, and of note, were enriched in Th17-induced experimental autoimmune encephalitis (EAE) gene signatures and gene signatures derived from Th17 cells isolated other human autoimmune diseases. These data, although not casual, imply that functional differences between antigen specific T cells from MS and healthy controls is fundamental to disease development and support the notion that IL-10 production from myelin-reactive T cells may act to limit disease progression, or even pathogenesis.
Introduction
Multiple sclerosis (MS) is thought to be an autoimmune disease where activated, myelin-reactive T cells migrate into the central nervous system (CNS), mediating inflammation (1–3). From recent genome-wide association scans, it has become clear that MS shares common susceptibility loci with other autoimmune diseases, such as Crohn’s disease, celiac disease and primary biliary cirrhosis (4–7). Since the discovery in 1933 that repeated injection of rabbit brain tissue into non-human primates yielded a pathologic condition—experimental autoimmune encephalitis (EAE) —resembling acute disseminated encephalomyelitis or MS (8), it has been hypothesized that autoreactivity to myelin antigens underlies the pathogenesis of MS. The identification and characterization of myelin-specific T cells in the naïve and memory repertoire is, therefore, of fundamental relevance to understanding the immune function of autoreactive T cells in MS pathogenesis (1–3).
We and others have found that patients with MS and healthy subjects have similar numbers of circulating myelin-reactive T cells, but to date, because of the low frequency of antigen-specific T cells, the diversity of TCR repertoire, the high activation threshold, and the constrains of antigen-processing and presentation, it has not been possible to discern a significant functional difference between the myelin-reactive T cells cloned from patients and healthy subjects (9–11). Investigations have shown that the minimal requirement for inducing an inflammatory autoimmune demyelinating disease in mammals is the activation of Th1/Th17 myelin-reactive T cells that secrete pathogenic interleukin (IL)-17, granulocyte-macrophage colony-stimulating factor (GM-CSF) and interferon (IFN)-γ, whereas IL-17 and IL-10 producing T cells are protective (12–16). CCL20, the ligand for CCR6, is constitutively expressed in epithelial cells of choroid plexus in mice and humans, representing the first port of entry of inflammatory T cells into the CNS (17). Moreover, CCR6− deficient mice developed a normal Th17 response in peripheral lymphoid organs, but failed to develop EAE (17–19). Additionally, IL-10 secreting Tr1 cells have been shown to function in suppressing inflammatory responses in diabetes, graft vs. host disease (20, 21), and MS (22). However, defects in peripheral tolerance mechanisms alone do not explain the pathology of MS in humans (3), and it has been difficult to ascertain whether autoreactive T cells found in healthy subjects are naïve having never been activated.
Here, we sought to establish the molecular profiles of autoreactive T cells in patients with autoimmune disease, choosing to investigate patients with MS to identify key functional differences between patients and healthy subject CD4+ T cells. Using a novel recently developed T cell library approach that allows ex vivo separation of T cell subpopulations followed by representative clonal expansion, we show that MS-derived myelin-reactive T cells are from the memory CCR6+ population and secrete more proinflammatory cytokines as compared to those from healthy controls. Additionally, single-cell clones generated from MS patients show enriched production of IL-17, GM-CSF, or IFN-γ, whereas those from healthy controls predominantly secrete IL-10. We found striking differences in the transcriptional programs of myelin-reactive T cells between MS and healthy controls. Transcriptomes of T cells derived from MS patients are enriched in Th17 gene signatures from EAE and those derived from healthy controls are enriched in interferon signaling and CTLA4 inhibitory signaling. These data highlight key functional differences between myelin-reactive T cells from MS and healthy controls, providing antigen-specific molecular signatures that suggest pathological differences between these cells and highlight specific therapeutic targets.
Results
Inflammatory myelin-reactive T cells from patients with MS
We overcame technical challenges of interrogating the function of human autoreactive T cells by using advances in T cell libraries developed by Sallusto and colleagues (23). Small numbers of T cells were isolated and pre-sorted into various subsets from peripheral blood ex vivo and then cultured in vitro with phytohemagglutinin (PHA) and IL-2 for two weeks. These libraries of polyclonally expanded T cells were then used to compare the frequency, antigen reactivity, epitope specificity, and gene expression upon exposure to a variety of myelin antigens in each CD4+ T cell compartment (fig. S1). A total of 13,324 T cell libraries were generated from 23 patients and 22 controls by sorting populations of naïve, C-C chemokine receptor (CCR) 6− memory, or CCR6+ memory T cells prior to performing T cell amplification (table S1). CCR6 was chosen as a marker to enrich in Th17 and Tr1 cells (24, 25). The ex vivo sorting of these distinct subsets prior to stimulation eliminated populations of CD25high regulatory T cells to allow polyclonal expansion (fig. S2).
Each expanded library was subsequently interrogated for antigen reactivity. Since progressive disease in the EAE model is marked by increased diversity in autoreactive epitopes (26, 27), we chose to use pools of peptides representative of previously identified immunodominant epitopes from myelin basic protein (MBP), proteolipid protein (PLP), and myelin oligodendrocyte glycoprotein (MOG) (table S2) (9, 28, 29). Candida albicans (C. albicans) served as a positive control since it has been used previously to identify populations of human Th17 cells secreting IL-17 and IFN-γ (30). The proliferation of antigen-specific T cells to myelin peptides was measured by 3H-thymidine incorporation. We also measured the production of four cytokines (IFN-γ, IL-17, GM-CSF, and IL-10) by enzyme-linked immunosorbent assay (ELISA) that have distinguished pathogenic and protective Th17 cells in EAE (13–16). Representative data from one MS and healthy control pair is presented in Figure 1. Libraries generated from naïve and CCR6− memory populations generally exhibited minimal functional responses to all antigens except to C. albicans (Fig. 1). In contrast, subsets of CCR6+ libraries from patients with MS demonstrated an increase in rates of proliferation and production of GM-CSF to myelin-derived peptides relative to those from healthy subjects. Libraries derived from these cells also produced more pro-inflammatory cytokines IFN-γ, IL-17, and GM-CSF, but similar quantities (or less) anti-inflammatory cytokine IL-10, in response to myelin peptides than those from healthy subjects. These results imply that a functional difference exists between T cells isolated from MS patients and healthy subjects, mainly in the CCR6+ memory compartment compared to naive and CCR6− memory subsets.
Fig. 1. Phenotypic analysis of oligoclonal libraries of myelin-reactive CD4+ T cells from a patient with MS and a healthy control subject.
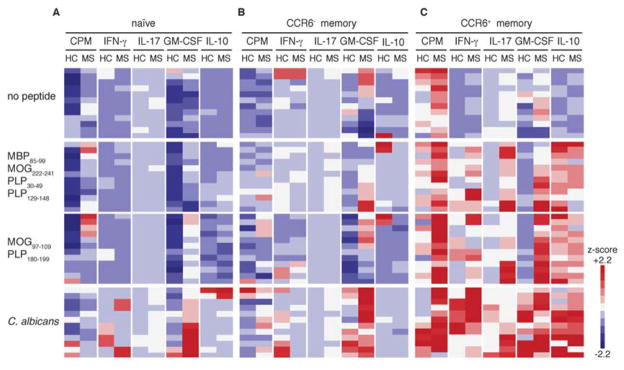
Heatmap comparing functional responses of (A) Naïve, (B), CCR6− memory, and (C) CCR6+ memory CD4+ T cells cultured with irradiated autologous monocytes with or without myelin peptides (MBP85-99, MOG222-241, PLP30-49 and PLP129), or (MOG97-109 and PLP180-199) or C. albicans. Proliferation was measured by 3H-thymidine incorporation on day 5, and culture supernatants were measured on day 7 by ELISA for IFN-γ, IL-17, GM-CSF and IL-10. Data show one representative experiment (out of 13) and were z-score normalized for each parameter. Each bar per column represents one oligoclonal library.
We then aimed to understand this observed functional distinction further by performing principal component analysis (PCA) using data measured from T cell libraries derived from thirteen healthy controls and thirteen patients with MS (Fig. 2, fig. S3, fig S4, and table S3). In the absence of antigen, there was no segregation of the basal responses exhibited by populations of T cells from healthy subjects or patients with MS (Fig. 2A). As expected, the responses to C. albicans were most robust in the libraries from CCR6+ memory T cells, segregating from other subsets in a projection of the first two principal components with enhanced production of IFN-γ, IL-10, IL-17, or GM-CSF (Fig. 2B). It was of interest that there were modest increases in IL-17 secretion with C. albicans stimulation in patients with MS as compared to control subjects (p = 0.0136). These data are consistent with previous data showing that stimulated T cells from patients with MS also secrete higher amounts of IL-17 (31). CCR6− subsets from patients with MS showed a bias towards increased proliferation (p = 0.0017) and GM-CSF (p < 0.0001) production (fig. S3). Remarkably, this analysis affirmed two functionally-distinct responses in the CCR6+ memory CD4+ T cell libraries expanded from MS patients when stimulated with myelin peptides. One response was associated with the production of GM-CSF (p = 0.0114), while the other was associated with the production of IL-17 (p < 0.0001) or IFN-γ (p < 0.0001), and proliferation (p < 0.0001) (Fig. 2C). There was also a distinct population of IL-10 producing healthy control libraries in response to myelin peptides (p = 0.0005) that appears along the projection of IL-10 (Fig. 2C). Additionally, the frequency of myelin-reactive T cells in the CCR6+ MS memory population was significantly higher than those from the healthy control (p = 0.0006, Fisher’s Exact Test).
Fig. 2. Principal component analysis of functional phenotypes of myelin-reactive CCR6+ memory CD4+ T cells.
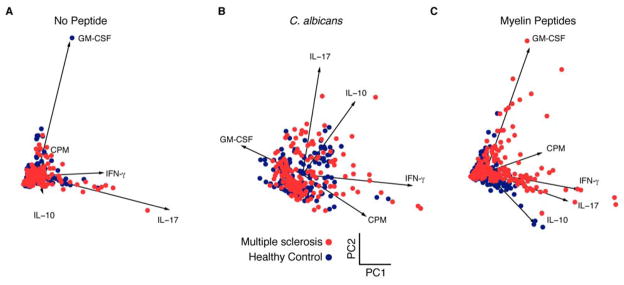
Scatterplots show measured penta-dimensional responses (proliferation, IFN-γ, IL-17, GM-CSF and IL-10) for individual amplified T cell libraries (each dot) projected onto the first two principal components. Analysis is shown for (A) no peptide, (B) C. albicans, and (C) myelin peptides from thirteen healthy subjects and thirteen MS patients. Projections of the vectors for each data class are also shown and annotated for reference. Statistically significant p-values of myelin-reactive T cells for IL-17 (p < 0.0001), GM-CSF (p = 0.0114), IFN-γ (p < 0.0001), IL-10 (p = 0.0005) and proliferation (p < 0.0001).
Overall, these data indicate that the CCR6+ memory compartment of patients with MS, but not healthy subjects, can be stratified into functionally different groups based on cytokine production in response to peptide-specific stimulation. With respect to MS, these data indicate that there are myelin-reactive T cells within this compartment that produce GM-CSF, IL-17, or IFN-γ, and a smaller population that may be protective IL-10 producers in healthy control patients. While these IL-10-secreting myelin-reactive T cells were more frequent in control subjects, these cells in MS may play an active role in disease remission. Nevertheless, since magnetic resonance imaging (MRI) investigations have shown the concurrent formation of new plaques while others are healing, it precludes a simple temporal association of functional CD4+ T cell populations with the state of disease (32).
Inflammatory myelin-specific T cells from patients with MS
The mixed functional responses evident in the CCR6+ T cell libraries could arise from oligoclonal populations. We, therefore, assessed the specificity and functional programs of individual myelin-reactive T cells isolated from these libraries. It has been shown that both human leukocyte antigen (HLA)-DR2 and HLA-DR4 are MS susceptibility molecules (33). However, we and others have found that HLA-DR2 tetramers loaded with the dominant epitopes of myelin basic protein do not work, so we chose HLA-DR4 tetramers to sort antigen-specific cells in this study. Expanded CCR6+ memory T cell libraries from HLA-DR4+ MS patients and healthy subjects were restimulated with two DR4-restricted myelin peptides (MOG97-109 & PLP180-199), and libraries that exhibited the highest scores for proliferation were used for single-cell cloning. In order to characterize the functional profile of antigen-specific single cells, we generated 144 single-cell clones from two DR4+ MS patients and two DR4+ healthy subjects by sorting cells labeled with DRB1*0401/MOG97-109-tetramers and DRB1*0401/PLP180-199-tetramers (fig. S5). We measured their proliferation and production of cytokines by ELISA following stimulation with autologous monocyte and DR4 peptides. The resulting clones showed MOG97-109 or PLP180-199 specific proliferation in both patients with MS and healthy controls (fig. S6). Hierarchical clustering of these data identified five dominant functional profiles (Fig. 3 and fig. S7). Approximately half of the tetramer-positive clones did not respond to peptides upon restimulation (42 healthy control and 41 MS clones), and could not be classified into inflammatory or anti-inflammatory groups, which either showed much lower proliferation or lower cytokine production from both MS and healthy controls, consistent with expectations for single-cell cloning (11). The responsive myelin-reactive single-cell clones from patients with MS showed enriched production of IL-17 and GM-CSF, GM-CSF alone, or predominantly IFN-γ. Strikingly, 22 of 23 IL-10 producing clones were isolated from healthy subjects, supporting observations that autoreactive T cells in the circulation in healthy subjects can be actively suppressed by IL-10 producing T cells (34, 35). The active responses elicited in the clones from MS patients were significantly different from those from healthy subjects (p < 4×10⁻⁵, Fisher’s Exact Test). In agreement with our data derived from amplified T cells, these data suggest myelin-reactive T cells from MS patients tend to produce pro-inflammatory cytokines (IFN-γ, IL-17, and GM-CSF) compared to clones from healthy subjects producing protective IL-10.
Fig. 3. Single-cell clonal analysis of myelin-reactive CCR6+ memory CD4+ T cells in HLA-DR4+ patients with MS and healthy control subjects.

Tetramer-sorted single cell clones (n = 144) were stimulated with DR4 myelin peptides (MOG97-109 and PLP180-199) to verify the specificity. Heatmap shows functional profiles of individual clones measured on day 5 after stimulation. Data were z-score normalized within a given parameter, and organized by hierarchical clustering. Clusters that separated in the dendrogram by a distance metric of 3 are shown in each box, and pie charts indicate proportion of clones within a given cluster derived from healthy (black) or MS (grey) subjects. The numbers next the pie charts refer to the clones classified into each proportion. Clones that did not respond after re-stimulation (42 healthy control and 41 MS clones) are not shown here, but did cluster together.
Pathogenic gene profiles of myelin-reactive T cells from patients with MS
To refine the molecular signatures associated with myelin-reactive T cells, we compared the transcriptomes of these cells from patients with MS and healthy subjects. For RNA sequencing, we sorted both tetramer-positive and tetramer-negative CCR6+ CD4+ memory T cells for five patients and four healthy subjects from T cell libraries that exhibited the highest scores for proliferation (fig. S6 and S8). Biological replicates showed good correlation overall and the expression of housekeeping genes and CD4 T cell specific genes was similar across all samples (fig. S9). Differential expression analysis revealed 197 differentially expressed genes that were unique to MS tetramer positive samples (fig. S10A). K-means clustering of these genes across all samples revealed that samples segregated based on tetramer and disease status (fig. S10B). Gene Ontology (GO) enrichment analysis of each cluster was performed, and we found that three out of five clusters were enriched for biological functions. Cluster two was significantly enriched in cytokine receptor binding, cytokine activity, and lymphocyte proliferation, while cluster four was enriched in cellular proliferation, differentiation, and IL-17 production (fig. S10C). The cluster predominantly upregulated in both healthy control samples and MS tetramer-negative samples, cluster zero, was not enriched in any GO functions, nor was cluster one.
To take a pathway-centered approach to these data, we then performed Gene Set Enrichment Analysis (GSEA) (36). The high degree of similarity in the profiles of mapped transcripts in MS tetramer-negative and healthy control tetramer-positive samples allowed us to perform GSEA using the comparison between MS tetramer-positive and MS tetramer-negative samples (fig. S11). GSEA revealed 305 enriched gene sets (FDR < 0.25) in MS tetramer-positive samples (n = 5) relative to tetramer-negative samples (table S4) and 135 enriched gene sets in the healthy control tetramer-positive samples relative to tetramer-negative samples (table S5). Of those gene sets enriched in tetramer-positive samples with a FDR < 0.05, 19 were enriched in both MS and healthy control tetramer-positive samples (Fig. 4A). These include gene sets involved in translation and metabolism, and may represent the non-specific pathways that are activated upon tetramer staining. There are also 112 pathways that were unique to the MS tetramer-positive samples, including one emphasizing cytokine signaling, chemokine signaling, the IL-23 pathway and AP1 pathways, and several gene sets specific to autoimmune diseases (Fig 4A and fig. S12). In contrast, of 27 gene sets enriched in the tetramer-positive samples from healthy controls, the top-scoring sets related to immune cell function, antigen presentation, CTLA4 inhibitory signaling, and interferon signaling (Fig 4A). Compared to tetramer-positive samples from healthy controls, the cells from MS patients were enriched in gene sets related to T cell function and autoimmunity, indicating that the transcriptional profiles obtained from these samples could be used to identify key molecular signatures of myelin-reactive T cells.
Fig. 4. Gene expression analysis of myelin-reactive CCR6+ memory T cells in HLA-DR4+ patients with MS and healthy subjects.

CCR6+ memory CD4+ T cells from healthy subjects (n= 3) and MS patients (n = 5) were amplified by PHA and IL-2, scored for proliferation upon restimulation, and sorted as myelin tetramer+ and tetramer− cells for RNA sequencing. (A) Gene sets enriched in the MS tetramer+ samples (yellow), healthy control (HC) tetramer+ samples (green), or both as determined by GSEA (FDR < 0.05). Representative gene sets from each category are shown. (B) Venn diagram summarizes the overlap of genes with the core pathologic EAE set (white), and the total genes in the leading edge (light grey), within the differentially expressed gene set reported by Lee et al (dark grey) (16). The heatmap (right) shows the z-score normalized log2FPKM values for the indicated genes in MS tetramer+ or tetramer− samples. Genes that are bold with asterisk are contained within the leading edge gene set. (C) −log(FDR) values of GSEA results for gene sets indicated. FDR values that were reported as zero were set to 4 for display purposes (pathogenic Th17, Th17 differential expression, Th17 cytokines, and Th17 combinatorial core). Dashed line shows FDR > 0.05. (D) A network representation of molecules enriched in MS tetramer+ samples. The color of each molecule shows fold change of MS tetramer+ relative to MS tetramer− as indicated by the key. Solid (direct) or dashed (indirect) cyan lines denote known molecular interactions. Select molecules are labeled and molecules highlighted in orange were differentially expressed.
It was of interest to determine whether the gene signature identified in tetramer-positive CCR6+ MS T cells was shared with that of pathological T cells that cause EAE. We determined the degree of overlap between the transcripts identified in tetramer-positive MS CCR6+ T cells and pathogenic Th17 cells induced by TGF-β3 that have been shown to drive EAE (16). Since adoptive transfer of potentially encephalitogenic clones into humans can never be performed, it is reasonable to speculate that the molecular signatures of pathogenic myelin-reactive T cells in one mammal reflects that of another species. By performing GSEA with the pathologic gene signature defined by Lee et al., we found that 10 out of 13 genes associated with pathogenic Th17 cells were present in the leading edge subset of the MS tetramer-positive cells (Fig. 4B). Although not present in the leading edge, Cxcl3, a highly over-expressed gene of the pathogenic EAE signature, was expressed in two of five MS tetramer-positive samples, but not in MS tetramer-negative samples. We then compared our data to pathogenic signatures derived from genes differentially expressed in MOG-induced EAE in rat (37), Th1, Th2 and Th17 signatures derived from mouse (38), Th17 cell lineage specifications in mouse (39), and several gene signatures derived from Th17 effector memory subsets in humans (40) (Fig. 4C and table S6). There was significant enrichment, defined as FDR < 0.05, in several Th17 signatures in mouse, as well as the human-derived Th17 effector memory selective signature and a Th2 signature. Interestingly, there was also enrichment in the gene signature derived from Th17.1 (CCR7loCCR6+CCR4loCXCR3hi) effector memory cells isolated from Crohn’s patient lesions (40). Taken together, these data highlight the substantial though not complete overlap between genes expressed by myelin-reactive MS T cells and Th17 effector memory cells.
In order to define a larger gene signature of myelin-reactive MS tetramer-positive T cells, we performed an analysis of genes present in the leading edge subsets of 17 significantly enriched gene sets chosen based on function, uniqueness to MS tetramer positive cells, and significance (FDR < 0.03) (table S7). We found that out of 224 genes in the leading edge, the most commonly shared genes were IL-8, followed by IFNG, IL-2, CCL20 and CCL5 (fig. S13). IL-10 was also present in the leading edge but it was not produced in the T cell library assay, potentially indicating post-translational regulation of IL-10 (41). A clustering analysis of this gene signature showed that samples segregated based on disease status (healthy versus MS), regardless of tetramer status (fig. S14). Tetramer-positive and negative T cells from patients with MS also partitioned into two distinct groups, indicating that the gene signature could be used to differentiate between myelin-reactive and non-reactive MS T cells.
Finally, we performed a pathway analysis of the 224-gene signature for the tetramer-positive T cells from patients with MS to gain a better understanding of their molecular relationships and connectivities. Top-scoring canonical pathways enriched in these samples included glucocorticoid receptor signaling, T helper cell differentiation, and type I diabetes mellitus signaling (fig. S15A). These findings are consistent with our recent data that glucocorticoid receptor signaling and IL-8 signaling were enriched in patients with MS at higher risk for a demyelinating event (42). Of 14 networks constructed by IPA, three top-scoring networks were merged based on their network score, inclusion of more than ten identified genes, and their relevance to immune function (table S8). The aggregated network comprises 118 highly inter-connected molecules, of which 54 are over-expressed (log2FC > 1.5), and 20 are differentially expressed (fig. S15B). When expression data from tetramer-positive healthy control samples is overlaid onto this network, we see no significant increased expression of these molecules, except for IL-2 and IL-26.
Molecules were grouped by molecular categories to identify functional hubs within the network (Fig. 4D). This highlights several highly connected molecules from each category, including those that may reflect the functional response of pathogenic, myelin-reactive T cells. For example, IFN-γ, GM-CSF, IL-23a, and IL-21 are all highly connected cytokines that are important in differentiating pathogenic and non-pathogenic Th17 cells (13–16, 30). A group of receptors comprised the largest functional unit of the network. Of note, prostaglandin receptor E2 and E4 (PTGER2 and PTGER4), which have identified risk alleles, have recently been linked to the production of IFN-γ and GM-CSF in Th17 cells from patients with MS (43). Additionally, it has been shown that AP-1, by action of FOSL2, plays a key role in Th17 specification (39) and has recently emerged as a key stimulus-dependent regulatory element in the context of autoimmune T cell activation by analysis of single nucleotide polymorphisms on chromatid maps (7). The presence of molecules associated with T follicular helper (Tfh) cells (CXCR5, ICOS, and IL-21) may implicate a Tfh-like function for myelin-reactive T cells, supporting the hypothesis that Tfh cells may drive disease progression (44, 45). IL-17a appeared in the network, but its master transcription factor ROR-γt did not. We found that ROR-γt was expressed in three out of five MS tetramer positive samples. The discordance could reflect activities of STAT5 and IL-2, both present in the network that can transiently down-regulate ROR-γt and IL-17a in re-stimulated memory CD4+ T cell (30). Several key transcription factors were also present, including BATF, IRF4, FOSL2, FOSL1, STAT1 and TBX21. BATF, IRF, and FOSL2 have central roles in Th17 cell differentiation, but their relative contributions to the function of fully differentiated Th17 cells is not known (39). Several adhesion and tissue homing molecules, including CCL20 (ligand for CCR6), CCL4/L1, CXCL10, CXCR5 and XCL1 appear in the network. CCL20/4, and CXCL10 also appear in the combinatorial core of genes important in Th17 cell specifications, and have been described as important for migration from the periphery to the CNS (46), though the role of XCL1 is not clear. Finally, we also created a merged network of other top scoring networks (table S8), which highlights additional transcriptional hubs, such as HLA molecules (fig. S16). Taken together, this analysis provides a comprehensive basis for a functional transcriptional network that distinguishes myelin-reactive MS T cells, highlighting the complex interplay between several transcription factors, cytokines/chemokines, and receptors.
Discussion
Autoreactive T cells are readily identified in healthy individuals and patients with autoimmune diseases, though their relative functional programs are unknown (9–11). Here, we examined self-reactive T cells generating a total of 13,324 T cell libraries from patients with MS and controls, interrogating the immune function of myelin reactive CD4 cells. We demonstrate functional and transcriptional differences in myelin-reactive CD4+ T cells in patients with MS as compared to healthy controls, identifying secretion of IL-17, GM-CSF and IFN-γ in MS as compared to IL-10 secretion in healthy controls. Further, these autoreactive T cells are CCR6+ memory CD4+ T cells in both patients and controls. Single-cell clones isolated by MHC/peptide tetramers from CCR6+ T cell libraries also secreted more pro-inflammatory cytokines while clones isolated from controls secreted IL-10. The transcriptomes of myelin-specific CCR6+ T cells from patients with MS were distinct from those derived from healthy controls, and of note, were enriched in Th17-induced EAE gene signatures and gene signatures derived from Th17 cells isolated other human autoimmune diseases. These data, although not casual, imply that this functional difference between antigen specific T cells from MS and healthy controls is fundamental to disease development and support the hypothesis that IL-10 production from myelin-reactive T cells may act to limit disease progression, or even pathogenesis.
Both Th1 and Th17 cells are implicated in the pathogenesis of EAE (12–16, 47). Recently, it was shown that GM-CSF plays a pathogenic role in EAE pathology (14–15). Furthermore, GM-CSF-producing T helper cells display a district transcriptional profile and may represent a novel subset of T cells (48). GM-CSF was increased in both CCR6− and CCR6+ memory myelin-reactive T cells from MS compared with that from healthy controls. In this study, we reported CCR6+ memory T cells highlighted the functional and transcriptional phenotypes of myelin-reactive T cells from MS. Further markers are needed to elucidate whether pathogenic myelin-reactive T cells from MS are located in specific subsets, such as Th1 (CXCR3+CCR4−CCR6−), Th17 (CXCR3−CCR4+CCR6+) (47). Nevertheless, these data indicate that circulating myelin-reactive T cells in healthy individuals without autoimmune disorders are not in a naïve state and have undergone previous activation leading to the secretion of inhibitory functional programs characterized by the secretion of IL-10.
Previous reports that have studied transcriptional differences in the context of MS have highlighted the role of T cells and B cells, and have also identified lymphocyte activation pathways that can stratify patients into treatment groups (7, 42). To date, there has been a lack of information about the transcriptome of antigen-specific T cells in the context of MS. We found that gene expression profiles for presumably pathogenic myelin-specific T cells from patients with MS shared significant numbers of upregulated genes with encephalitogenic CD4+ T cells isolated from animals with EAE, signatures from memory Th17 cells isolated from Crohn’s patients, and many other Th17-related gene signatures. These data highlight the important role that Th17 cells may play in MS pathophysiology, and analysis of these cells in patients with active forms of disease would determine if and how these populations shift during relapse. Additionally, these gene signatures were distinct from CD4+ tetramer-negative cells isolated from the same oligoclonal library or from activated myelin-reactive T cells isolated from control subjects. This could indicate that even though myelin-reactive T cells were found in these healthy subjects, they were functionally different, possibly due to the role of CTLA4.
Using this unique gene signature to perform a network analysis, we identified key molecules that may distinguish the functionality of myelin-reactive T cells that is unique to MS, including transcription factors (BATF, IRF4, FOSL2), cytokines (IFN-γ, GM-CSF, and IL-23), and receptors (PTGER2, PTGER4, and ICOS). The presence of Th17, Th1, and Tfh-associated molecules underscores the complexity and heterogeneity of the transcriptional regime of myelin-reactive T cells. The use of single-cell techniques, such as single-cell sequencing, may allow for finer phenotypic profiling of these cells leading to a better understanding of the relative contributions of these molecules to cell behavior. It will also be of interest to use this powerful new tool to examine the autoreactive T cells in the circulation of patients with non-autoimmune CNS tissue disease to better understand the molecular profile of CD4+ T cells involved with repairing damaged CNS tissue.
It has long been debated whether EAE is a model for MS. Clearly the afferent aspect of sensitization to self-antigens in MS is not well modeled by EAE, as the latter requires disruption of tolerance with adjuvant and lacks the genetic variation reflecting the human disease, but the efferent aspects of EAE have been useful in modeling MS (49). Specifically, anti-VLA-4 monoclonal antibodies that hinder T cell trafficking to the CNS in EAE were highly predictive of the clinical efficacy in patients (50). It has not been known, however, whether the functional cytokine profiles in encephalitogenic CD4+ T cells isolated from the periphery at all reflect the myelin-reactive CD4+ T cells in patients with MS. Here, using an unbiased library approach followed by RNA sequencing, we observe a distinct homology of cytokines secreted and mRNA expressed between patients with MS and encephalitogenic CD4+ T cells. These data suggest that activated, myelin reactive T cells observed in the EAE may model pathogenic, myelin reactive CD4 cells in patients with MS.
Materials and Methods
Study subjects
Peripheral blood was drawn from healthy individuals and patients with MS after informed consent and approval by the Institutional Review Board at Yale University School of Medicine. All patients had relapsing-remitting MS (RRMS) and were of age of 42 ± 12 years. All patients were immunotherapeutic naïve (untreated) or had not received treatment for at least 12 months. Healthy donors were age- and sex- matched with the MS patients, with no history of autoimmune disease, or malignancies and no acute or chronic infections.
Antibodies and reagents
The following monoclonal antibodies were purchased from BD Biosciences (San Jose, CA): anti-CD45RA (Hl100), anit-CD45RO (UCHL1), anti-CD25 (M-A251) and anti-CD196 (CCR6, G034E3), anti-CD3 (UCHT1) and anti-CD28 (28.2). Completed medium used in the experiments was RPMI 1640 medium (Life Technologies, Carlsbad, CA) supplemented with 2 mM L-glutamine, 5 mM HEPES, 0.1 mM non-essential amino acids, 1 mM sodium pyruvate, 50 U/ml penicillin, 50 U/ml streptomycin (Lonza, Walkersville, MD) and 5% human serum (Immune Tolerance Network, San Francisco, CA). Recombinant human IL-2 was obtained through the AIDS Research and Reference Reagent Program (Division of AIDS, National Institute of Allergy and Infectious Diseases, National Institutes of Health). Myelin peptides and control peptides (table S1) were synthesized by AnaSpec (Fremont, CA).
Cell purification and sorting
Peripheral blood mononuclear cells (PBMCs) were isolated by standard Ficoll-Paque PLUS (GE Healthcare, Piscataway, NJ) gradient centrifugation. and were used either fresh or after Monocytes were pre-selected by human CD14+ positive isolation kit (StemCell Technologies, Vancouver, BC) and cryopreservated in 90% human AB serum plus 10% DMSO and storage in liquid nitrogen for further use. CD4+ T cells were subsequently isolated by using the human CD4+ T cell enrichment kit (StemCell Technologies). Monocytes served as antigen presenting cells for T cell libraries assay. Untouched CD4+ T cells were used for T cell subpopulation isolation. Naïve (CD45RA+CD45RO−CD25−), CCR6− memory (CD45RA− CD45RO+CD25−CCR6−), and CCR6+ memory (CD45RA−CD45RO+CD25−CCR6+) CD4+ T cells were sorted with the depletion of CD25high regulatory T cells on a fluorescence-activated cell sorting (FACS) Aria (BD Biosciences) to a purity > 98% as verified by post-sort analysis.
Amplified T cell libraries assay
Amplified T cell libraries assay were carried out as previous described (23). Naïve, CCR6− and CCR6+ memory CD4+ T from paired MS patients and healthy controls were pre-sorted and cultured in 96-well round-bottom plates (Costar, Cambridge, MA) at 2 × 10³ cells per well in complete RPMI 1640 medium, and stimulated with 1 μg/ml PHA (Roche, Nutley, NJ) and 20 U/ml IL-2 in the presence of irradiated (45Gy) allogeneic feeder cells (2×10⁴/well). IL-2 was added on day 4, 7 and 10. Cultures were washed and split into two 96-well plates after 2-weeks of stimulation and expansion. Library screening was performed by culturing ~ 106 T cells/well with autologous monocytes (~105), which were either unpulsed or pulsed for 3 h with 10 μg/ml myelin peptide pools (MBP85-99, MOG222-241, PLP30-49, PLP129-148, MOG97-109, PLP180-199), or C. albicans (GREER, Lenoir, NC). [3H] (Perkin Elmer, Waltham, MA) was added into the cultures 16 h before harvest. On day 5, cell proliferation was measured by 3H-thymidine incorporation on a scintillation beta-counter (Perkin Elmer). Culture supernatants were taken on day 7 for cytokine profiling as described below.
Enzyme-linked immunosorbent assay (ELISA)
Culture supernatants from amplified T cell libraries assay were assayed for the presence of cytokines by ELISA. ELISA measurement of cytokines was performed with purified coating and biotinylated detection antibodies, as follows: IFN-γ, clone 2G1 and human IFN-γ mAb biotin-labeled (Thermo Scientific, Walthman, MA); IL-10, clone JES3-19F1 and biotin anti-human and viral IL-10 (BD Biosciences). Production of IL-17 and GM-CSF were measured with a DuoSet ELISA Development kit (R&D Systems, Minneapolis, MN). The absorbance was measured and analyzed on a microplate read (Bio-Rad, Hercules, CA).
Single cell cloning and specificity testing
CCR6+ memory CD4+ T cells from HLA-DR4+ healthy controls and HLA-DR4+ MS patients were expanded under T cell library assay, and stimulated by irradiated autologous monocytes and DR4 myelin peptides (MOG97-109 and PLP180-199). Cell proliferation was measured by 3H-thymidine incorporation and two of the highest proliferated wells were picked for DR4 tetramers staining (MOG97-109-tetramers and PLP180-199-tetramers). Tetramer positive cells were sorted as single cell into 96-well plates using a FACSAria cell sorter (BD Biosciences). Clones thus obtained were expanded for 28 day by stimulation with irradiated allogeneic PMBCs in the presence of soluble anti-CD3 (1 μg/ml), anti-CD28 (1 μg/ml) and IL-2 (10 U/ml). Antigen-stimulated proliferation of each clone was tested by restimulating with autologous monocytes either unpulsed or pulsed with MOG97-109 or PLP180-199. The single cell clones were further stimulated by autologous monocytes and DR4 myelin peptides (MOG97-109 and PLP180-199) to testify the specificity and functionality by 3H-thymidine incorporation (for proliferation) and ELISA (for cytokine production).
Tetramer preparation and tetramer staining
DRB1*0401 and DRB1*1501 soluble class II molecules were generated as previously described (11). MOG97-109 and PLP180-199 were used to load the DRB1*0401 molecule to generate the DRB1*0401/MOG97-109 tetramers and DRB1*0401/PLP180-199 tetramers. Phycoerythrin (PE, BioSource International, Camarillo, CA) conjugated streptavidin was used for cross-linking of peptide-MHC II monomers.
CCR6+ memory CD4+ T cells from HLA-DR4+ healthy controls and HLA-DR4+ MS patients were expanded under T cell library assay. After re-stimulated by DR4 myelin peptides for 5 days, the cells were washed with PBS, and then stained with 10 μg/ml DR4 tetramers (MOG97-109 tetramers and PLP180-199 tetramers), anti-CD4, and live/dead dye (Life technologies) at 37 °C for 30 minutes in RPMI 1640 medium with 2% human AB serum. The subsequent washing and cell sorting were then performed at 4°C. Live CD4+tetramer+ and/or CD4+tetrmaer− T cells were sorted for single cell cloning and RNA sequencing.
RNA sequencing
CCR6+ memory CD4+ T cells from HLA-DR4+ healthy controls and HLA-DR4+ MS patients were amplified by PHA and IL-2 and stimulated by irradiated autologous monocytes and DR4 myelin peptides (MOG97-109 and PLP180-199). Cell proliferation was measured and two of the highest proliferated wells were picked for DR4 tetramers staining (MOG97-109-tetramers and PLP180-199-tetramers). Myelin tetramer+ and tetramer− cells were sorted into RNA lysis buffer for RNA sequencing. RNA was extracted using the NucleoSpin RNA XS Kit (Macherey-Nagel, Bethlehem, PA) according to the manufacturers instructions. cDNA synthesis and amplification were performed using SMARTer Ultra Low Input RNA for Illumina Sequencing High Volume Kit (Clontech, Mountain View, CA) according to the manufacturers instructions. The average number of cells used to isolate RNA was 3,000, which yielded >1ng input RNA. Paired-end sequencing libraries were prepared using the Nextera XT DNA sample Prep Kit (Illumina, San Diego, CA) according to the manufacturers instructions. Libraries were pooled in an equimolar ratio and sequenced on a HiSeq 2500 sequencer with 200 cycles per lane (Illumina, San Diego, CA).
All samples were processed through Tophat (v1.4.1). Sequence reads were mapped to the human genome (hg19), with an average of 12 million paired end reads aligned per library and >90% of the mapped read were in genic regions. Alignments were then sorted and merged before processing with Cufflinks (v 2.1.1). Samples for which the 5′ to 3′ read density >0.8 were kept for down stream analysis. The log2FPKM values for mapped transcripts in each sample were used to create the input .gct file for Gene Set Enrichment Analysis (GSEA) (v2.0) as previously described (36). GSEA (classic scoring scheme, 10 set minimum, 1000 permutations) was performed using pre-ranked data sets based on fold change comparisons, as suggested by the GSEA user guide. Leading edge analysis of selected gene sets was performed using custom MATLAB (vR2014a) scripts for enumerating unique genes. Data were further analyzed using IPA core analysis (Ingenuity® Systems, www.ingenuity.com), FuncAssociate (v2.0) (Berriz, 2009) for GO enrichment, and GeneE data visualization tool (http://www.broadinstitute.org/cancer/software/GENE-E/index.html).
Statistical Analysis and Additional Data Analysis Notes
Fisher’s Exact Test (two-tailed) was performed using R statistical software (v2.11.1) and Prism (v6). Principal components analysis was performed on z-score normalized data using the pca() function. Over 50% of the variance occurs in the first two principal components for each cell subset (table S2), thus, the data was visualized along these two components using the biplot() function in MATLAB (vR2014.a) and custom scripts to differentially color MS and HC derived libraries. Hierarchical clustering of z-score normalized data was performed with custom scripts in MATLAB, using the pdist(), linkage() and cluster() functions with the following respective metrics: correlative clustering method, average linkage method and the maximum allowable clusters. One-way ANOVA statistical tests on z-score normalized cytokine and proliferation data was performed in Prism (v6) with Dunn’s multiple comparisons test.
Supplementary Material
Acknowledgments
The authors would like to thank S. Liu, L. Devine and C. Wang for technical assistance, Hafler lab members for helpful comments and suggestions, and all of the blood donors for their participation.
Funding: This work was supported by National Institutes of Health Grants P01 AI045757 (to J.C.L. and D.A.H.), U19 AI046130, U19 AI070352, and P01 AI039671 (to D.A.H.). This work was also supported in part by the Koch Institute Support (core) Grant P30-CA14051 from the National Cancer Institute, and we thank the Koch Institute Swanson Biotechnology Center for technical support, specifically the BioMicroCenter. D.A.H. is also supported by grants from the National Institute of Neurological Disorders and Stroke, and the Nancy Taylor Foundation for Chronic Diseases, Inc. J.C.L. is a Camille Dreyfus Teacher-Scholar.
Footnotes
Competing Interests: The authors declare no competing financial interests.
Author Contribution: Y.C. designed the study, planned and performed experiments, analyzed data and wrote the manuscript. B.A.T. performed experiments, analyzed data and wrote the manuscript. K. R., G.T.N., W.K.K. R.J.N. and K.O.C. provided technical support. J.C.L. planned experiments, analyzed data, and wrote the manuscript. D.A.H. designed the study, planned experiments, analyzed data, and wrote the manuscript.
References and Notes
- 1.McFarland HF, Martin R. Multiple sclerosis: a complicated picture of autoimmunity. Nat Immunol. 2007;8:913–919. doi: 10.1038/ni1507. [DOI] [PubMed] [Google Scholar]
- 2.Goverman J. Autoimmune T cell responses in the central nervous system. Nat Rev Immunol. 2009;9:393–407. doi: 10.1038/nri2550. [DOI] [PMC free article] [PubMed] [Google Scholar]
- 3.Nylander A, Hafler DA. Multiple sclerosis. J Clin Invest. 2012;122:1180–1188. doi: 10.1172/JCI58649. [DOI] [PMC free article] [PubMed] [Google Scholar]
- 4.International Multiple Sclerosis Genetics Consortium. Risk alleles for multiple sclerosis identified by a genomewide study. N Engl J Med. 2007;357:851–862. doi: 10.1056/NEJMoa073493. [DOI] [PubMed] [Google Scholar]
- 5.International Multiple Sclerosis Genetics Consortium, Wellcome Trust Case Control Consortium. Genetic risk and a primary role for cell-mediated immune mechanisms in multiple sclerosis. Nature. 2011;476:214–219. doi: 10.1038/nature10251. [DOI] [PMC free article] [PubMed] [Google Scholar]
- 6.Parkes M, Cortes A, van Heel DA, Brown MA. Genetic insights into common pathways and complex relationships among immune-mediated diseases. Nat Rev Genet. 2013;14:661–673. doi: 10.1038/nrg3502. [DOI] [PubMed] [Google Scholar]
- 7.Farh KK, Marson A, Zhu J, Kleinewietfeld M, Housley WJ, Beik S, Shoresh N, Whitton H, Ryan RJ, Shishkin AA, Hatan M, Carrasco-Alfonso MJ, Mayer D, Luckey CJ, Patsopoulos NA, De Jager PL, Kuchroo VK, Epstein CB, Daly MJ, Hafler DA, Bernstein BE. Genetic and epigenetic fine mapping of causal autoimmune disease variants. Nature. 2014 doi: 10.1038/nature13835. published online EpubOct 29. [DOI] [PMC free article] [PubMed] [Google Scholar]
- 8.Rivers TM, Sprunt DH, Berry GP. Observations on Attempts to Produce Acute Disseminated Encephalomyelitis in Monkeys. J Exp Med. 1933;58:39–53. doi: 10.1084/jem.58.1.39. [DOI] [PMC free article] [PubMed] [Google Scholar]
- 9.Ota K, Matsui M, Milford EL, Mackin GA, Weiner HL, Hafler DA. T-cell recognition of an immunodominant myelin basic protein epitope in multiple sclerosis. Nature. 1990;346:183–187. doi: 10.1038/346183a0. [DOI] [PubMed] [Google Scholar]
- 10.Martin R, Howell MD, Jaraquemada D, Flerlage M, Richert J, Brostoff S, Long EO, McFarland HF. A myelin basic protein peptide is recognized by cytotoxic T cells in the context of four HLA-DR types associated with multiple sclerosis. J Exp Med. 1991;173:19–24. doi: 10.1084/jem.173.1.19. [DOI] [PMC free article] [PubMed] [Google Scholar]
- 11.Raddassi K, Kent SC, Yang J, Bourcier K, Bradshaw EM, Seyfert-Margolis V, Nepom GT, Kwok WW, Hafler DA. Increased frequencies of myelin oligodendrocyte glycoprotein/MHC class II-binding CD4 cells in patients with multiple sclerosis. J Immunol. 2011;187:1039–1046. doi: 10.4049/jimmunol.1001543. [DOI] [PMC free article] [PubMed] [Google Scholar]
- 12.Bettelli E, Sullivan B, Szabo SJ, Sobel RA, Glimcher LH, Kuchroo VK. Loss of T-bet, but not STAT1, prevents the development of experimental autoimmune encephalomyelitis. J Exp Med. 2004;200:79–87. doi: 10.1084/jem.20031819. [DOI] [PMC free article] [PubMed] [Google Scholar]
- 13.Ghoreschi K, Laurence A, Yang XP, Tato CM, McGeachy MJ, Konkel JE, Ramos HL, Wei L, Davidson TS, Bouladoux N, Grainger JR, Chen Q, Kanno Y, Watford WT, Sun HW, Eberl G, Shevach EM, Belkaid Y, Cua DJ, Chen W, O’Shea JJ. Generation of pathogenic T(H)17 cells in the absence of TGF-beta signalling. Nature. 2010;467:967–971. doi: 10.1038/nature09447. [DOI] [PMC free article] [PubMed] [Google Scholar]
- 14.El-Behi M, Ciric B, Dai H, Yan Y, Cullimore M, Safavi F, Zhang GX, Dittel BN, Rostami A. The encephalitogenicity of T(H)17 cells is dependent on IL-1- and IL-23-induced production of the cytokine GM-CSF. Nat Immunol. 2011;12:568–575. doi: 10.1038/ni.2031. [DOI] [PMC free article] [PubMed] [Google Scholar]
- 15.Codarri L, Gyulveszi G, Tosevski V, Hesske L, Fontana A, Magnenat L, Suter T, Becher B. RORgammat drives production of the cytokine GM-CSF in helper T cells, which is essential for the effector phase of autoimmune neuroinflammation. Nat Immunol. 2011;12:560–567. doi: 10.1038/ni.2027. [DOI] [PubMed] [Google Scholar]
- 16.Lee Y, Awasthi A, Yosef N, Quintana FJ, Xiao S, Peters A, Wu C, Kleinewietfeld M, Kunder S, Hafler DA, Sobel RA, Regev A, Kuchroo VK. Induction and molecular signature of pathogenic TH17 cells. Nat Immunol. 2012;13:991–999. doi: 10.1038/ni.2416. [DOI] [PMC free article] [PubMed] [Google Scholar]
- 17.Reboldi A, Coisne C, Baumjohann D, Benvenuto F, Bottinelli D, Lira S, Uccelli A, Lanzavecchia A, Engelhardt B, Sallusto F. C-C chemokine receptor 6-regulated entry of TH-17 cells into the CNS through the choroid plexus is required for the initiation of EAE. Nat Immunol. 2009;10:514–523. doi: 10.1038/ni.1716. [DOI] [PubMed] [Google Scholar]
- 18.Liston A, Kohler RE, Townley S, Haylock-Jacobs S, Comerford I, Caon AC, Webster J, Harrison JM, Swann J, Clark-Lewis I, Korner H, McColl SR. Inhibition of CCR6 function reduces the severity of experimental autoimmune encephalomyelitis via effects on the priming phase of the immune response. J Immunol. 2009;182:3121–3130. doi: 10.4049/jimmunol.0713169. [DOI] [PubMed] [Google Scholar]
- 19.Moriguchi K, Miyamoto K, Tanaka N, Yoshie O, Kusunoki S. The importance of CCR4 and CCR6 in experimental autoimmune encephalomyelitis. J Neuroimmunol. 2013;257:53–58. doi: 10.1016/j.jneuroim.2013.02.002. [DOI] [PubMed] [Google Scholar]
- 20.Gagliani N, Jofra T, Stabilini A, Valle A, Atkinson M, Roncarolo MG, Battaglia M. Antigen-specific dependence of Tr1-cell therapy in preclinical models of islet transplant. Diabetes. 2010;59:433–439. doi: 10.2337/db09-1168. [DOI] [PMC free article] [PubMed] [Google Scholar]
- 21.Gregori S, Battaglia M, Roncarolo MG. Re-establishing immune tolerance in type 1 diabetes via regulatory T cells. Novartis Found Symp. 2008;292:174–183. doi: 10.1002/9780470697405.ch16. discussion 183–176, 202–173. [DOI] [PubMed] [Google Scholar]
- 22.Astier AL, Meiffren G, Freeman S, Hafler DA. Alterations in CD46-mediated Tr1 regulatory T cells in patients with multiple sclerosis. J Clin Invest. 2006;116:3252–3257. doi: 10.1172/JCI29251. [DOI] [PMC free article] [PubMed] [Google Scholar]
- 23.Geiger R, Duhen T, Lanzavecchia A, Sallusto F. Human naive and memory CD4+ T cell repertoires specific for naturally processed antigens analyzed using libraries of amplified T cells. J Exp Med. 2009;206:1525–1534. doi: 10.1084/jem.20090504. [DOI] [PMC free article] [PubMed] [Google Scholar]
- 24.Trifari S, Kaplan CD, Tran EH, Crellin NK, Spits H. Identification of a human helper T cell population that has abundant production of interleukin 22 and is distinct from T(H)-17, T(H)1 and T(H)2 cells. Nat Immunol. 2009;10:864–871. doi: 10.1038/ni.1770. [DOI] [PubMed] [Google Scholar]
- 25.Rivino L, Gruarin P, Haringer B, Steinfelder S, Lozza L, Steckel B, Weick A, Sugliano E, Jarrossay D, Kuhl AA, Loddenkemper C, Abrignani S, Sallusto F, Lanzavecchia A, Geginat J. CCR6 is expressed on an IL-10-producing, autoreactive memory T cell population with context-dependent regulatory function. J Exp Med. 2010;207:565–577. doi: 10.1084/jem.20091021. [DOI] [PMC free article] [PubMed] [Google Scholar]
- 26.Tuohy VK, Yu M, Yin L, Kawczak JA, Johnson JM, Mathisen PM, Weinstock-Guttman B, Kinkel RP. The epitope spreading cascade during progression of experimental autoimmune encephalomyelitis and multiple sclerosis. Immunol Rev. 1998;164:93–100. doi: 10.1111/j.1600-065x.1998.tb01211.x. [DOI] [PubMed] [Google Scholar]
- 27.McMahon EJ, Bailey SL, Castenada CV, Waldner H, Miller SD. Epitope spreading initiates in the CNS in two mouse models of multiple sclerosis. Nat Med. 2005;11:335–339. doi: 10.1038/nm1202. [DOI] [PubMed] [Google Scholar]
- 28.Markovic-Plese S, Fukaura H, Zhang J, al-Sabbagh A, Southwood S, Sette A, Kuchroo VK, Hafler DA. T cell recognition of immunodominant and cryptic proteolipid protein epitopes in humans. J Immunol. 1995;155:982–992. [PubMed] [Google Scholar]
- 29.Bielekova B, Sung MH, Kadom N, Simon R, McFarland H, Martin R. Expansion and functional relevance of high-avidity myelin-specific CD4+ T cells in multiple sclerosis. J Immunol. 2004;172:3893–3904. doi: 10.4049/jimmunol.172.6.3893. [DOI] [PubMed] [Google Scholar]
- 30.Zielinski CE, Mele F, Aschenbrenner D, Jarrossay D, Ronchi F, Gattorno M, Monticelli S, Lanzavecchia A, Sallusto F. Pathogen-induced human TH17 cells produce IFN-gamma or IL-10 and are regulated by IL-1beta. Nature. 2012;484:514–518. doi: 10.1038/nature10957. [DOI] [PubMed] [Google Scholar]
- 31.Brucklacher-Waldert V, Stuerner K, Kolster M, Wolthausen J, Tolosa E. Phenotypical and functional characterization of T helper 17 cells in multiple sclerosis. Brain: a journal of neurology. 2009;132:3329–3341. doi: 10.1093/brain/awp289. [DOI] [PubMed] [Google Scholar]
- 32.Filippi M, Rocca MA, Barkhof F, Bruck W, Chen JT, Comi G, DeLuca G, De Stefano N, Erickson BJ, Evangelou N, Fazekas F, Geurts JJ, Lucchinetti C, Miller DH, Pelletier D, Popescu BF, Lassmann H. Attendees of the Correlation between Pathological MRI findings in MS workshop, Association between pathological and MRI findings in multiple sclerosis. Lancet Neurol. 2012;11:349–360. doi: 10.1016/S1474-4422(12)70003-0. [DOI] [PubMed] [Google Scholar]
- 33.International MHC Autoimmunity Genetics Network. Mapping of multiple susceptibility variants within the MHC region for 7 immune-mediated diseases. Proc Natl Acad Sci USA. 2009;106:18680–18685. doi: 10.1073/pnas.0909307106. [DOI] [PMC free article] [PubMed] [Google Scholar]
- 34.Roncarolo MG, Battaglia M. Regulatory T-cell immunotherapy for tolerance to self antigens and alloantigens in humans. Nat Rev Immunol. 2007;7:585–598. doi: 10.1038/nri2138. [DOI] [PubMed] [Google Scholar]
- 35.Huber S, Gagliani N, Esplugues E, O’Connor W, Jr, Huber FJ, Chaudhry A, Kamanaka M, Kobayashi Y, Booth CJ, Rudensky AY, Roncarolo MG, Battaglia M, Flavell RA. Th17 cells express interleukin-10 receptor and are controlled by Foxp3(−) and Foxp3+ regulatory CD4+ T cells in an interleukin-10-dependent manner. Immunity. 2011;34:554–565. doi: 10.1016/j.immuni.2011.01.020. [DOI] [PMC free article] [PubMed] [Google Scholar]
- 36.Subramanian A, Tamayo P, Mootha VK, Mukherjee S, Ebert BL, Gillette MA, Paulovich A, Pomeroy SL, Golub TR, Lander ES, Mesirov JP. Gene set enrichment analysis: a knowledge-based approach for interpreting genome-wide expression profiles. Proc Natl Acad Sci USA. 2005;102:15545–15550. doi: 10.1073/pnas.0506580102. [DOI] [PMC free article] [PubMed] [Google Scholar]
- 37.Raddatz BB, Hansmann F, Spitzbarth I, Kalkuhl A, Deschl U, Baumgartner W, Ulrich R. Transcriptomic meta-analysis of multiple sclerosis and its experimental models. PLoS One. 2014;9:e86643. doi: 10.1371/journal.pone.0086643. [DOI] [PMC free article] [PubMed] [Google Scholar]
- 38.Wei G, Abraham BJ, Yagi R, Jothi R, Cui K, Sharma S, Narlikar L, Northrup DL, Tang Q, Paul WE, Zhu J, Zhao K. Genome-wide analyses of transcription factor GATA3-mediated gene regulation in distinct T cell types. Immunity. 2011;35:299–311. doi: 10.1016/j.immuni.2011.08.007. [DOI] [PMC free article] [PubMed] [Google Scholar]
- 39.Ciofani M, Madar A, Galan C, Sellars M, Mace K, Pauli F, Agarwal A, Huang W, Parkurst CN, Muratet M, Newberry KM, Meadows S, Greenfield A, Yang Y, Jain P, Kirigin FK, Birchmeier C, Wagner EF, Murphy KM, Myers RM, Bonneau R, Littman DR. A validated regulatory network for Th17 cell specification. Cell. 2012;151:289–303. doi: 10.1016/j.cell.2012.09.016. [DOI] [PMC free article] [PubMed] [Google Scholar]
- 40.Ramesh R, Kozhaya L, McKevitt K, Djuretic IM, Carlson TJ, Quintero MA, McCauley JL, Abreu MT, Unutmaz D, Sundrud MS. Pro-inflammatory human Th17 cells selectively express P-glycoprotein and are refractory to glucocorticoids. J Exp Med. 2014;211:89–104. doi: 10.1084/jem.20130301. [DOI] [PMC free article] [PubMed] [Google Scholar]
- 41.Saraiva M, O’Garra A. The regulation of IL-10 production by immune cells. Nat Rev Immunol. 2010;10:170–181. doi: 10.1038/nri2711. [DOI] [PubMed] [Google Scholar]
- 42.Ottoboni L, Keenan BT, Tamayo P, Kuchroo M, Mesirov JP, Buckle GJ, Khoury SJ, Hafler DA, Weiner HL, De Jager PL. An RNA profile identifies two subsets of multiple sclerosis patients differing in disease activity. Sci Transl Med. 2012;4:153ra131. doi: 10.1126/scitranslmed.3004186. [DOI] [PMC free article] [PubMed] [Google Scholar]
- 43.Kofler DM, Marson A, Dominguez-Villar M, Xiao S, Kuchroo VK, Hafler DA. Decreased RORC-dependent silencing of prostaglandin receptor EP2 induces autoimmune Th17 cells. J Clin Invest. 2014;124:2513–2522. doi: 10.1172/JCI72973. [DOI] [PMC free article] [PubMed] [Google Scholar]
- 44.Peters A, Pitcher LA, Sullivan JM, Mitsdoerffer M, Acton SE, Franz B, Wucherpfennig K, Turley S, Carroll MC, Sobel RA, Bettelli E, Kuchroo VK. Th17 cells induce ectopic lymphoid follicles in central nervous system tissue inflammation. Immunity. 2011;35:986–996. doi: 10.1016/j.immuni.2011.10.015. [DOI] [PMC free article] [PubMed] [Google Scholar]
- 45.Ma CS, Deenick EK. Human T follicular helper (Tfh) cells and disease. Immunol Cell Biol. 2014;92:64–71. doi: 10.1038/icb.2013.55. [DOI] [PubMed] [Google Scholar]
- 46.Cheng W, Chen G. Chemokines and chemokine receptors in multiple sclerosis. Mediators Inflamm. 2014;2014:659206. doi: 10.1155/2014/659206. [DOI] [PMC free article] [PubMed] [Google Scholar]
- 47.Noster R, Riedel R, Mashreghi MF, Radbruch H, Harms L, Haftmann C, Chang HD, Radbruch A, Zielinski CE. IL-17 and GM-CSF expression are antagonistically regulated by human T helper cells. Sci Transl Med. 2014;6:241ra280. doi: 10.1126/scitranslmed.3008706. [DOI] [PubMed] [Google Scholar]
- 48.Sheng W, Yang F, Zhou Y, Yang H, Low PY, Kemeny DM, Tan P, Moh A, Kaplan MH, Zhang Y, Fu XY. STAT5 programs a distinct subset of GM-CSF-producing T helper cells that is essential for autoimmune neuroinflammation. Cell Res. 2014;24:1387–1402. doi: 10.1038/cr.2014.154. [DOI] [PMC free article] [PubMed] [Google Scholar]
- 49.Gold R, Linington C, Lassmann H. Understanding pathogenesis and therapy of multiple sclerosis via animal models: 70 years of merits and culprits in experimental autoimmune encephalomyelitis research. Brain. 2006;129:1953–1971. doi: 10.1093/brain/awl075. [DOI] [PubMed] [Google Scholar]
- 50.von Andrian UH, Engelhardt B. Alpha4 integrins as therapeutic targets in autoimmune disease. N Engl J Med. 2003;348:68–72. doi: 10.1056/NEJMe020157. [DOI] [PubMed] [Google Scholar]
Associated Data
This section collects any data citations, data availability statements, or supplementary materials included in this article.