

Abstract
Kaposi's sarcoma (KS) is an infectious cancer occurring in immune-compromised patients, caused by Kaposi's sarcoma associated herpesvirus (KSHV). Our vision is to simplify the process of KS diagnosis through the creation of a smartphone based point-of-care system capable of yielding an actionable diagnostic readout starting from a raw biopsy sample. In this work we develop the sensing mechanism for the overall system, a smartphone accessory capable of detecting KSHV nucleic acids. The accessory reads out microfluidic chips filled with a colorimetric nanoparticle assay targeted at KSHV. We calculate that our final device can read out gold nanoparticle solutions with an accuracy of .05 OD, and we demonstrate that it can detect DNA sequences from KSHV down to 1 nM. We believe that through integration with our previously developed components, a smartphone based system like the one studied here can provide accurate detection information, as well as a simple platform for field based clinical diagnosis and research.
Introduction
Kaposi's sarcoma (KS) is an opportunistic infectious cancer that first became widely known during the acquired immunodeficiency syndrome (AIDS) epidemic of the 1980s1-4. During this time period, the appearance of KS symptoms, red lesions on the skin, became signs that an individual was infected with human immunodeficiency virus (HIV), and KS itself became known as an AIDS-defining illness. As the battle against AIDS waged on, the introduction of highly active anti-retroviral therapy (HAART) helped reduce KS incidence5. Years later, however, HIV infected individuals still contract KS at a higher occurrence than when compared to the pre-AIDS era6. Considering its prevalence in HIV infected individuals, KS if often found in regions with high levels of AIDS. KS is the fourth leading cancer in sub-Saharan Africa, and in some countries, such as Uganda, is the most prevalent cancer in men7-8.
The root cause of KS is the Kaposi's sarcoma associated herpesvirus (KSHV), also called human herpesvirus 8 (HHV-8)9-10. While the virus is often asymptomatic in healthy individuals, a number of populations, including those immune-compromised by HIV, are vulnerable to its symptoms and aggressive disease. The virus is commonly believed to be transmitted through saliva11. It rapidly spreads beginning in childhood and in some regions eventually reaches seroprevalences of over 50%8, 12. Like other herpesviruses, KSHV can establish a latent infection, and can remain without causing any disease for life in most infected hosts, being necessary but not sufficient for KS development. Considering this, one of the biggest challenges in diagnosing KS involves having to detect KSHV in a biopsy sample and not simply a blood draw.
If typical hematoxylin and eosin (H&E) staining is applied to a KS biopsy section a number of unique features can be observed, including many and large vascular spaces as well as high numbers of spindle cells thought to be of lymphatic endothelial origin13-14. However, due to the existence of similarly presenting diseases, such as bacillary angiomatosis (BA), identification of these features is frequently not sufficient for diagnosis of KS15. In modern hospitals, this is solved through immunohistochemistry staining for protein markers of KSHV, or through application of PCR for KSHV sequences.
However, neither of these techniques are readily adaptable for point of care situations in limited resource settings, where KS is most prevalent. Our long term goal is to create a biopsy diagnostic that can be used in this scenario, enabling the entire process from sample collection to diagnostic readout. In previous work, we began addressing this challenge to create point of care biopsy diagnostics for KS by creating a colorimetric nanoparticle based detection system, similar to the works of Thompson et al.16 and Storhoff et al.17-19, that was capable of detecting KSHV DNA20. However, one of the shortcomings of the system is that without laboratory technology, the test can only be read out as a binary assay, and thus the amount of information it could provide was limited.
Recently, a number of mobile health technologies have been developed that seek to solve this problem of quantifiable point of care diagnosis. These devices take advantage of all of the computational, connectivity, display, and other functionality already built into a smartphone and use it to create better point-of-care devices. Further, they capitalize on the ubiquitous nature of smartphones, and the near universal ability to use them. A number of papers have been published in the literature showing how smartphones can be used as field-portable microscopes21-24, as colorimetric test strip readers25-27, as rapid diagnostic test readers28, for allergen detection29, and even for label free detection30. More recent work even extends the state-of-the-art to include multiplexed ratiometric nanoparticle measurements, and fluorescence measurements of single viruses31-32. These devices have proven extremely useful for portable imaging and in cases where diagnostic tests are commercially available. They advance the state of the art towards biochemical testing, yet are currently limited to only a few tests.
In this work we create a smartphone accessory capable of measuring KSHV DNA concentrations. We develop a working accessory, a smartphone app, and disposable microfluidic chips, then demonstrate how we can detect KSHV DNA in a PDMS microfluidic chip. Overall, we show that we can measure nanoparticle solutions down to nanomolar concentrations, and detect KSHV DNA at similar levels. We hope that in the future the detection technology developed here will be integrated with other components, including syringe biopsy technology and solar thermal DNA amplification33, to fully enable point-of-care biopsy based KS detection.
Experimental
Two smartphone accessories were created capable of reading out nanoparticle aggregation assays in standard laboratory cuvettes and 1 cm long microfluidic channels. The cuvette based reader was used as a proof-of-concept device to determine how to create the optical system. The rest of the work focuses on the microfluidic system, composed of a smartphone accessory, disposable microfluidic chips and nanoparticles. The accessory connects to Android devices and is controlled by an Android application to obtain absorbance readouts across microfluidic chips. The microfluidic chips contain gold nanoparticle conjugates functionalized for the detection of KSHV DNA. Figure 1 illustrates the system and its three components.
Fig. 1.

(a) An image of the entire smartphone system is shown including the Android application, the smartphone accessory, and a microfluidic cartridge being inserted. (b) The inside of the smartphone accessory is shown, with some wiring disconnected for easier display. (c) An example microfluidic cartridge is shown illustrating the 1 cm optical path the light travels through and the magnetic latch to help align the chip with the reader.
Software Development
The smartphone app was developed in Eclipse (Eclipse Foundation, Ottawa, Canada) for the Android platform (Google, Mountain View, CA). The code was written in Java and used the Android SDK tools (Google, Mountain View, CA). The software was written to communicate with a USB accessory in accessory mode (host mode for the cuvette prototype), allowing the Android device to provide power for the smartphone accessory. When triggered via a button press in the app interface (see Figure 2), a signal is sent to the smartphone accessory requesting a read-out of the current absorbance. The app then receives this read-out, displays it to the user, and saves it in temporary memory. As results are collected, they can also be automatically tagged with user information, time stamps, and locations to provide relevance to the results. Figure 2c illustrates the process flow of the software.
Fig. 2.

Screenshots show (a) the Android application including where measurement output is recorded, how measurements are triggered, and (b) additional functionality for emailing and saving data.(c) A flow chart illustrates the high level operation of the software running on both the Android phone and the Arduino microcontroller when a measurement is taken.
In addition to the app's core functionality, utilities were added to email results to other experimenters or medical professionals, to store results as text files on a connected Google Drive account, or even to create keyhole mark-up language files (KML files) that can be opened in Google Maps, Google Earth, or many other geographic applications (Figure 2b). Using these functions together, a simple database of test read-outs from numerous devices can be created, similar to that detailed in other work28. Eventually, records from similar accessories could be uploaded directly to patient's electronic medical records.
Optical Readout Circuitry
The accessory contains an LED light source at the peak wavelength of the nanoparticles resonance (520 nm) and a photocell, placed across a 1 cm gap where a sample is placed (Figure 2a). The photocell is connected via a pull-down resistor and measurements of the voltage drop across the photocell are made to determine luminosity. This results in an inversely proportional relationship between the output of the voltage measurement and the amount of light illuminating the photocell described by:
| (1) |
Where V is the voltage drop across the photocell, Vin is the power supplied to the resistor-photocell system, and RPhotocell and RPull-down are the resistance of the photocell and pull-down resistor respectively. If we also consider that the logarithm of the resistance of a photocell is proportional to the logarithm of the intensity of incident light given by:
| (2) |
Where RI is the resistance for a given intensity, I, and m and k are constants relating to the specific photocell, and that absorbance through a medium varies according to the Beer-Lambert law given by:
| (3) |
Where T is transmitted light, I is transmitted Intensity, I0 is initial intensity, ε is molar absorptivity, l is the optical path length, and c is concentration then we can see that our voltage output is proposal to a sigmoid function of concentration:
| (4) |
By choosing the pull-down resistors resistance to make sure that typical concentrations fall in the middle of this range, a linear fit can then be used to describe the relation between voltage and optical density.
Cuvette Based Reader Proof of Concept and Circuitry
An accessory capable of reading out absorbance measurements across a cuvette was created to first demonstrate a smartphone's ability to measure nanoparticle absorbance and to test our optical component. This early prototype was based on an IOIO microcontroller board (Sparkfun, Boulder, CO) which enabled simple communication with the smartphone, but required external power and use of the USB Host interface. The microcontroller was connected to the LED and pull-down resistor and communicated measurement results with the smartphone.
All of the controlling electronics and measurement circuitry are house in a casing was printed using an Objet Connex500 3D printer (Stratasys, Eden Prairie, MN). This early prototype was battery powered, and connected via a USB cable to the Android phone.
Microfluidic Smartphone Accessory Design
The final microfluidic smartphone accessory draws power from and communicates with most modern Android smartphones and tablets via μUSB. The device consists of an 8 MHz Pro Micro Arduino (Sparkfun, Boulder, CO), which controls the same type of LED and photodetector as used in the earlier prototype. The microcontroller connects to a male μUSB connector in order to draw power from and communicate with the smartphone. The entire system is enclosed in a black plastic case, printed similarly to the previous cuvette device, to block out ambient light.
The case holds the LED directly across from the photodiode, both behind approximately .5 mm apertures. A small magnet is connected to the end of the accessory and is used to hold the microfluidic chip in alignment. When a microfluidic chip is inserted, the path between the two components is filled with a 1 cm path length fluidic channel full of a nanoparticle solution. The device can be seen in Figure 1b.
Microfluidic Chip Fabrication
Microfluidic devices were made of PDMS and glass and plasma-bonded together, as done extensively in the literature34-35. Briefly, a mold was made from laser cut polyacrylic using a VersaLASER laser cutter (Hobart Lasers, Kent, UK). This technique was chosen over other microfabrication techniques because larger channels were desired for alignment, but smaller microstructures using photolithographic techniques could be easily integrated. The mold was then cast in PDMS, put under vacuum to removed trapped air bubbles and baked overnight.
The resulting PDMS cast was cut from the mold, paying careful attention to leave 1 mm of PDMS at the end of the sensing channel, enabling a thin interface for optical measurements along the width of the chip. Holes were punched at the inlet and outlet of the PDMS channels and then both the PDMS and a microscope slide were plasma treated in a Harrick Plasma Cleaner (Harrick Plasma, Ithaca, NY) for 30 s. The treated surfaces were pressed together and allowed an hour to bond. Small magnetic strips are attached to the front of the microfluidic chips helping align them when placed in the accessory. A sample chip is shown in Figure 1c.
Gold Nanoparticle Assay
Short DNA sequences used as probes for KHSV DNA were designed previously using BLAST Primer Design36. Briefly, oligonucleotides specific to KSHV DNA that codes for vCyclin were chosen. Gold nanoparticles were conjugated with oligonucleotides with 5’ alkyl thiol groups, as in previous work20. The nanoparticles had an average diameter of 15 nm, a compromise between the higher sensitivity of larger particles, and the easier to work with nature and stability of smaller particles. 100 μL of 100 μM KSHV probes were added per 1 mL of 3 nM nanoparticle solution, and allowed to react overnight. Concentrated solutions of sodium phosphate and sodium dodecyl sulphate (SDS) were then added in order to bring the solution to 10 mM and .01% concentrations, respectively, before another overnight period to reaction. Next, three additions of sodium chloride were added, resulting in concentration of 100 mM, 200 mM, and 300 mM, each with 24 hrs in between. This process worked to maximize the number of bound DNAs per particle, making more stable gold nanoparticle conjugates. After this, the resulting solution was spun down and resuspended in .01% SDS three times to remove unbound oligonucleotides. Sodium phosphate and Sodium chloride were then re-added to the final solution, resulting in final concentrations of 10 mM Sodium phosphate and 300 mM Sodium chloride. Particles were then stable and usable for over a month.
Nanoparticle Sensitivity Characterization
Gold nanoparticle solutions of different concentrations were created in order to calibrate the device. 1 OD 15 nm nanoparticles were diluted to concentrations of .8 OD, .6 OD, .4 OD, .2 OD, and 0 OD. The absorbance of these solutions was measured using a SpectraMAX photometer (Molecular Devices, Sunnyvale, CA). These solutions were then placed in the cuvette based accessory, and read-out using an Android smartphone. Results were collected and plotted as a function of optical density. A best fit line was also calculated and plotted.
Similarly, these solutions were inserted into the microfluidic chip via syringe, and measured in order to determine the devices read-out at these absorbance levels. By mapping these results to the spectrometer's output, we created a calibration curve for the smartphone accessory. These curves were then used in further experiments to determine the optical density of solutions after the addition of KSHV DNA. Calibration curves were individually calculated for separate microfluidic chips. Measurements across chips were also collected and plotted as a function of optical density to show a measure of inter-chip repeatability.
Quantitative KSHV DNA Experiments
Gold nanoparticle conjugates were mixed with different concentrations of the target KSHV DNA sequence, ranging from 100 pM, to 1 μM. After 24 hrs, the solutions were inserted into the smartphone accessory. The solutions were then measured by the smartphone, and the results were saved to the connected Google Drive for analysis. While solutions were given 24 hrs to react in this work, we have carried out similar experiments at smaller volumes in as little as two hours in previous work20, and there is literature precedent for faster times18. The main constraint here was diffusion in larger sample sizes prepared for multiple experiments. Resulting solutions were then measured using both our laboratory spectrometer and our microfluidic chip based system. Sensitivity results were calculated, and comparisons were made between the laboratory read-outs and our point of care readings.
Results and Discussion
Nanoparticle Sensitivity Results
Our cuvette reader and the results of our initial experiments using this system can be seen in Figure 3, along with the spectrum of the standard solutions used for calibration experiments. The change in voltage as a function of different optical density solutions can be seen. Error bars are shown, but difficult to see, as this initial system produced very tightly reproducible measurements, with standard deviations on the order of 2 mV. The large volume of gold nanoparticle solution used insured that from the perspective of the sensor, the optical path was always completely filled. The sensitivity of our reader, how much our voltage output changes with changing optical density, was roughly .5 V/OD (R2 = .99). Considering this sensitivity, our error, Vin = 3.3 V, and that our reading from the sensor is 10 bit (1024 values), our sensor can read out optical densities to an accuracy of roughly .01 of an OD. This takes into account that the accessory has roughly 150 values in a 1 OD range with our given sensitivity, and that our sensitivity is roughly on this scale (+/− 1 value). While this represents a best case value, even significantly less sensitive readings could be useful in point-of-care settings.
Fig. 3.
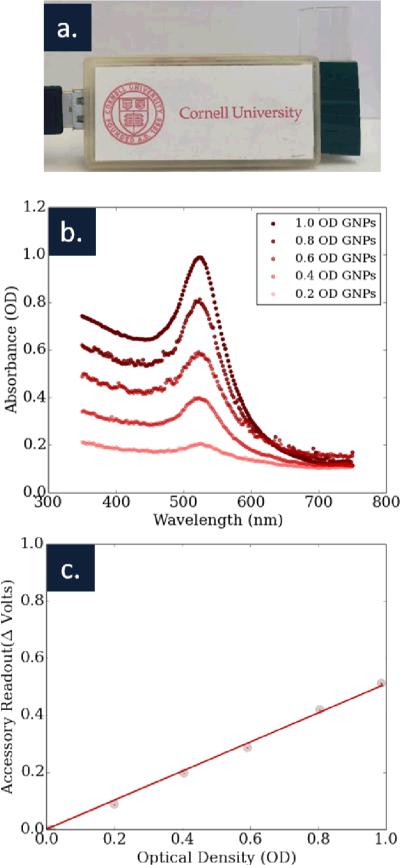
(a) The cuvette based accessory is shown, along with (b) the spectrum of five gold nanoparticle solutions used to calibrate the accessory. (c) A graph of optical density versus our device's readout shows a strong agreement between the two measurements. The sensitivity of the device was .5 V/OD (R2 = .99).
Figure 4 shows the resulting calibration data when comparing absorbance in our smartphone accessory to a commercial spectrometer. Both single and multiple chip measurements are shown, illustrating the intra- and inter- chip variations. As we can see from the results, our current prototype allows for highly repeatable measurements in a single chip and good measurements across chips. We believe that the additional variation between chips was the effect of channel alignment with the optical path, as well as uneven interfaces where the light enters and exits the chip. Together, these variations could account for unequal optical path lengths in the solution, as well as unequal scattering at the interfaces of the chip. We believe that both of these problems can be solved as we develop better techniques for repeatedly creating microfluidic chips that are measured along their width.
Fig. 4.
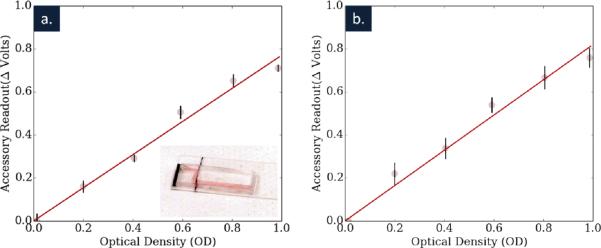
(a) Intra- and (b) inter- chip calibration and accuracy are shown for the microfluidic system.The data in (a) was then used as calibration data for the detection experiments. Within the single chip shown in (a) the sensitivity of the system was .77V/OD (R2 = .98) and across three chips the sensitivity was .82 V/OD (R2 = .98), showing a high level of reproducibility.
When considering the sensitivity of a single microfluidic chip, we actually calculate a higher sensitivity of .77 V/OD (R2 = .98), a result of a smaller aperture and a different pull-down resistor. Considering again the accuracy of our device, we now have over 230 distinct voltage readings in our 1 OD range. However, because of alignment issues inserting a single chip repeatedly, the standard deviations of these measurements were approximately 9 mV, larger than the voltage difference between values. Considering this, our microfluidic reader is accurate to roughly .05 OD increments, though this could be improved with better alignment, a more sensitive detector, or more accurate read-outs of the photocell we use here.
While the sensitivity calculated across three chips was roughly the same (.82 V/OD, R2 = .98) as to the single chip case above, the standard deviation increased to roughly 15 mV, a result of alignment differences between chips.
KSHV Detection and Quantification
The results of our quantitative KSHV DNA detection experiments are summarized in Figure 5. Figure 5a shows the sensitivity of our assay, read out by both a spectrometer and our microfluidic smartphone accessory. Figure 5b compares the readouts of these two devices, showing a strong agreement between their results (best fit slope = .92, R2 = .96). Figure 5c shows the solutions tested at each point and how much KSHV DNA was added to each. Solutions with higher DNA concentrations were able to more completely react, and to do so more quickly, resulting in higher changes in absorbance at 520 nm. Here our measurements use the calibration data for each of three microfluidic chips to calculate an optical density for these samples.
Fig. 5.

(a) A graph shows the optical density of the gold nanoparticle solution after the addition of 7 different concentrations of KSHV DNA. For concentration starting at 500 pM and up to 1 μM both the smartphone accessory and the spectrometer were able to detect changes in the color of the nanoparticle solution. (b) A plot of the optical density as determined by both the spectrometer and the smartphone accessory is shown, in comparison to a line representing parity. A best fit calculates an agreement of .92 between the two sets of measurements (R2 = .96). (c) Images of the seven different solutions are shown.
Our results indicate that with the current non-optimized system we can detect KSHV DNA down to 1 nanomolar concentrations. However, other advances in nanoparticle based detection have been used to create much more sensitive systems than here (where a smaller amount of analyte results in a greater change in OD), and if integrated with our smartphone accessory would likely yield more sensitive results.
Conclusions
Kaposi's sarcoma and other infectious diseases represent very real risks to human health both in the developing and developed world. The first step in treating these diseases is the identification of individuals affected, and to a lesser extent, how the disease is spreading. In this work we show how a smartphone based system can be cheaply and easily created to help solve both of these challenges. We demonstrate how the smartphone accessory we create can read out different concentrations of gold nanoparticles, as well as gold nanoparticle aggregation reactions that can be used to test for a number of different diseases. In the future, we hope to integrate this technology with our solar PCR amplification and other advanced microfluidics, including new approaches to pumping37-39, to provide a complete sample in, answer out system. Additionally, we hope to demonstrate further testing, using the biopsy samples that would ultimately be useful to medical professionals.
Supplementary Material
Acknowledgements
This work was partially supported by NIH-NIBIB under grant EB016803, Cornell Clinical and Translational Science Center Seed Award (UL1 RR024996) and Weill Cornell Clinical and Translational Science Center Seed Funds (UL1 RR024996). M. Mancuso would like to acknowledge a National Science Foundation Graduate Research Fellowship under Grant No. DGE-0707428. This work was performed in part at the Cornell NanoScale Facility, a member of the National Nanotechnology Infrastructure Network, which is supported by the National Science Foundation (Grant ECS-0335765) and at the Nanobiotechnology Center (NBTC), an STC Program of the National Science Foundation under Agreement no. ECS-9876771.
References
- 1.Pitchenik AE, Fischl MA, Dickinson GM, Becker DM, Fournier AM, O'Connell MT, Colton RM, Spira TJ. Ann Intern Med. 1983;98:277–284. doi: 10.7326/0003-4819-98-3-277. [DOI] [PubMed] [Google Scholar]
- 2.CDC MM. WR Morb Mortal Wkly Rep. 1982;31:294, 300–291. [Google Scholar]
- 3.Hymes KB, Cheung T, Greene JB, Prose NS, Marcus A, Ballard H, William DC, Laubenstein LJ. Lancet. 1981;2:598–600. doi: 10.1016/s0140-6736(81)92740-9. [DOI] [PubMed] [Google Scholar]
- 4.Friedman-Kien AE. J Am Acad Dermatol. 1981;5:468–471. doi: 10.1016/s0190-9622(81)80010-2. [DOI] [PubMed] [Google Scholar]
- 5.Eltom MA, Jemal A, Mbulaiteye SM, Devesa SS, Biggar RJ. J Natl Cancer Inst. 2002;94:1204–1210. doi: 10.1093/jnci/94.16.1204. [DOI] [PubMed] [Google Scholar]
- 6.Nguyen HQ, Magaret AS, Kitahata MM, Van Rompaey SE, Wald A, Casper C. AIDS. 2008;22:937–945. doi: 10.1097/QAD.0b013e3282ff6275. [DOI] [PMC free article] [PubMed] [Google Scholar]
- 7.Jemal A, Bray F, Center MM, Ferlay J, Ward E, Forman D. CA: A Cancer Journal for Clinicians. 2011;61:69–90. doi: 10.3322/caac.20107. [DOI] [PubMed] [Google Scholar]
- 8.Ferlay J, Shin HR, Bray F, Forman D, Mathers C, DM P. [11/15/2011, 2011];Cancer Incidence and Mortality Worldwide: IARC CancerBase No. 10 [Internet] [Google Scholar]
- 9.Cesarman E, Chang Y, Moore PS, Said JW, Knowles DM. N Eng J Med. 1995;332:1186–1191. doi: 10.1056/NEJM199505043321802. [DOI] [PubMed] [Google Scholar]
- 10.Chang Y, Cesarman E, Pessin MS, Lee F, Culpepper J, Knowles DM, Moore PS. Science. 1994;266:1865–1869. doi: 10.1126/science.7997879. [DOI] [PubMed] [Google Scholar]
- 11.Ablashi DV, Chatlynne LG, Whitman JE, Jr., Cesarman E. Clin Microbiol Rev. 2002;15:439–464. doi: 10.1128/CMR.15.3.439-464.2002. [DOI] [PMC free article] [PubMed] [Google Scholar]
- 12.He J, Bhat G, Kankasa C, Chintu C, Mitchell C, Duan W, Wood C. J Infect Dis. 1998;178:1787–1790. doi: 10.1086/314512. [DOI] [PubMed] [Google Scholar]
- 13.Tappero JW, Conant MA, Wolfe SF, Berger TG. Journal of the American Academy of Dermatology. 1993;28:371–395. doi: 10.1016/0190-9622(93)70057-z. [DOI] [PubMed] [Google Scholar]
- 14.Mesri EA, Cesarman E, Boshoff C. Nat Rev Cancer. 2010;10:707–719. doi: 10.1038/nrc2888. [DOI] [PMC free article] [PubMed] [Google Scholar]
- 15.Tappero JW, Koehler JE. New England Journal of Medicine. 1997;337:1888–1888. doi: 10.1056/NEJM199712253372605. [DOI] [PubMed] [Google Scholar]
- 16.Thompson DG, Enright A, Faulds K, Smith WE, Graham D. Analytical Chemistry. 2008;80:2805–2810. doi: 10.1021/ac702403w. [DOI] [PubMed] [Google Scholar]
- 17.Rosi NL, Mirkin CA. Chemical Reviews. 2005;105:1547–1562. doi: 10.1021/cr030067f. [DOI] [PubMed] [Google Scholar]
- 18.Storhoff JJ, Elghanian R, Mucic RC, Mirkin CA, Letsinger RL. Journal of the American Chemical Society. 1998;120:1959–1964. [Google Scholar]
- 19.Storhoff JJ, Lucas AD, Garimella V, Bao YP, Muller UR. Nat Biotech. 2004;22:883–887. doi: 10.1038/nbt977. [DOI] [PMC free article] [PubMed] [Google Scholar]
- 20.Mancuso M, Jiang L, Cesarman E, Erickson D. Nanoscale. 2013 doi: 10.1039/c3nr33492a. [DOI] [PMC free article] [PubMed] [Google Scholar]
- 21.Greenbaum A, Feizi A, Akbari N, Ozcan A. Opt. Express. 2013;21:12469–12483. doi: 10.1364/OE.21.012469. [DOI] [PMC free article] [PubMed] [Google Scholar]
- 22.Greenbaum A, Sikora U, Ozcan A. Lab on a Chip. 2012:12. doi: 10.1039/c2lc21072j. [DOI] [PubMed] [Google Scholar]
- 23.Isikman SO, Bishara W, Sikora U, Yaglidere O, Yeah J, Ozcan A. Lab on a Chip. 2011;11:2222–2230. doi: 10.1039/c1lc20127a. [DOI] [PMC free article] [PubMed] [Google Scholar]
- 24.Lee M, Yaglidere O, Ozcan A. Biomed. Opt. Express. 2011;2:2721–2730. doi: 10.1364/BOE.2.002721. [DOI] [PMC free article] [PubMed] [Google Scholar]
- 25.Veigas B, Jacob JM, Costa MN, Santos DS, Viveiros M, Inacio J, Martins R, Barquinha P, Fortunato E, Baptista PV. Lab Chip. 2012;12:4802–4808. doi: 10.1039/c2lc40739f. [DOI] [PubMed] [Google Scholar]
- 26.Oncescu V, O'Dell D, Erickson D. Lab on a Chip. 2013 doi: 10.1039/c3lc50431j. [DOI] [PubMed] [Google Scholar]
- 27.Shen L, Hagen JA, Papautsky I. Lab on a Chip. 2012;12:4240–4243. doi: 10.1039/c2lc40741h. [DOI] [PubMed] [Google Scholar]
- 28.Mudanyali O, Dimitrov S, Sikora U, Padmanabhan S, Navruz I, Ozcan A. Lab on a Chip. 2012;12:2678–2686. doi: 10.1039/c2lc40235a. [DOI] [PMC free article] [PubMed] [Google Scholar]
- 29.Coskun AF, Wong J, Khodadadi D, Nagi R, Tey A, Ozcan A. Lab on a Chip. 2013;13:636–640. doi: 10.1039/c2lc41152k. [DOI] [PMC free article] [PubMed] [Google Scholar]
- 30.Gallegos D, Long KD, Yu H, Clark PP, Lin Y, George S, Nath P, Cunningham BT. Lab on a Chip. 2013;13:2124–2132. doi: 10.1039/c3lc40991k. [DOI] [PubMed] [Google Scholar]
- 31.Wei Q, Nagi R, Sadeghi K, Feng S, Yan E, Ki SJ, Caire R, Tseng D, Ozcan A. ACS Nano. 2014;8:1121–1129. doi: 10.1021/nn406571t. [DOI] [PMC free article] [PubMed] [Google Scholar]
- 32.Wei Q, Qi H, Luo W, Tseng D, Ki SJ, Wan Z, Göröcs Z, Bentolila LA, Wu T-T, Sun R, Ozcan A. ACS Nano. 2013;7:9147–9155. doi: 10.1021/nn4037706. [DOI] [PMC free article] [PubMed] [Google Scholar]
- 33.Jiang L, Mancuso M, Lu Z, Akar G, Cesarman E, Erickson D. Sci. Rep. 2014:4. doi: 10.1038/srep04137. [DOI] [PMC free article] [PubMed] [Google Scholar]
- 34.Whitesides GM. Nature. 2006;442:368–373. doi: 10.1038/nature05058. [DOI] [PubMed] [Google Scholar]
- 35.McDonald JC, Whitesides GM. Accounts of Chemical Research. 2002;35:491–499. doi: 10.1021/ar010110q. [DOI] [PubMed] [Google Scholar]
- 36.Altschul SF, Madden TL, Schaffer AA, Zhang J, Zhang Z, Miller W, Lipman DJ. Nucleic Acids Res. 1997;25:3389–3402. doi: 10.1093/nar/25.17.3389. [DOI] [PMC free article] [PubMed] [Google Scholar]
- 37.Lillehoj PB, Wei F, Ho C-M. Lab on a Chip. 2010;10:2265–2270. doi: 10.1039/c004885b. [DOI] [PubMed] [Google Scholar]
- 38.Mao X, Huang TJ. Lab on a Chip. 2012;12:1412–1416. doi: 10.1039/c2lc90022j. [DOI] [PMC free article] [PubMed] [Google Scholar]
- 39.Jiang L, Erickson D. Small. 2013;9:107–114. doi: 10.1002/smll.201201778. [DOI] [PubMed] [Google Scholar]
Associated Data
This section collects any data citations, data availability statements, or supplementary materials included in this article.