

Abstract
Birth weight is reduced and the risk of preeclampsia is increased in human high altitude pregnancies. There has been little work to determine whether hypoxia acts directly to reduce fetal growth (e.g. reduced blood flow and oxygen delivery), or via changes in functional capacities such as nutrient transport. We therefore investigated the expression of a primary nutrient transporter, the GLUT1 glucose transporter and two in vitro markers of hypoxia (erythropoietin receptor, EPO-R, and transferrin receptor, TfR) in the syncytial microvillous (MVM) and basal membrane fractions (BMF) of 13 high (3100 m) and 12 low (1600 m) altitude placentas from normal term pregnancies. Birth weight was lower at 3100 m than at 1600 m despite similar gestational age, but none of the infants were clinically designated as fetal growth restriction. EPO-R, TfR and GLUT1 were examined by immunoblotting and maternal circulating erythropoietin and transferrin by ELISA. EPO-R was greater on the MVM (C75%) and BMF (C25%) at 3100 m. TfR was 32% lower on the MVM at 3100 m. GLUT1 was 40% lower in the BMF at 3100 m. Circulating EPO was greater at high altitude, while transferrin was similar, and neither correlated with their membrane receptors. BMF GLUT1 was positively correlated with birth weight at high, but not low altitude. In this in vivo model of chronic placental hypoxia, syncytial EPO-R increased as expected, while nutrient transporters decreased, opposite to what has been observed in vitro. Therefore, hypoxia acts to reduce fetal growth not simply by reducing oxygen delivery, but also by decreasing the density of nutrient transporters.
Keywords: GLUT1, Trophoblast, Erythropoietin receptor, Transferrin receptor, High altitude, Fetal growth
INTRODUCTION
Placental hypoxia is often invoked as an underlying cause or contributor to fetal growth restriction (FGR) and pathologies such as preeclampsia and diabetes. Epidemiological data support this hypothesis. Women pregnant at high altitude (>2700 m) have a 2–5-fold increase in the incidence of growth-restricted infants [1,2]. The incidence of preeclampsia is increased 2–4-fold at high altitude [3], and is likewise elevated in women with heart/lung or other disease that impedes oxygen delivery to the fetoplacental unit [4]. At sea level, hypoxia is generally associated with pathologies such as these, precluding investigation of the independent effects of hypoxia on fetoplacental growth and function. However, high altitude pregnancy provides a unique model in which to examine the effects of chronic hypoxia in vivo, free from its association with pathology.
The effect of altitude on birth weight is independent of all other factors tested, including socioeconomic status [5]. There is no excess of maternal risk factors for preeclampsia among high altitude populations, thus hypoxia remains the most widely accepted cause of the reduction in birth weight and increased incidence of complications at high altitude. However, the mechanisms are unclear. While previous research has demonstrated several adaptations that should favor normal placental transport of oxygen to the high altitude fetus [6], there is still a deficit in birth weight, suggesting that such changes are not (fully) compensatory. Previous research on the effects of hypoxia on the placenta consists primarily of experiments employing a variety of in vitro models. None of these systems are capable of determining the systemic effects of hypoxia on placental function and thus, while valuable for their insights into cellular and tissue responses to hypoxia, cannot provide information on the long-term developmental effects of chronically reduced maternal/placental pO2. Nonetheless, based on prior studies in vitro showing increase in GLUT1 [7], and decrease in the system A amino acid transporters in hypoxia [8], we hypothesized that chronic hypoxia might alter nutrient delivery to the fetus via changes in the expression of placental nutrient transporters. In this report we describe the effect of a reduction in maternal PaO2 in vivo on the expression of the GLUT1 glucose transporters on syncytial microvillous and basal membranes of placentas from high (3100 m) versus low altitude (1600 m). In view of the lack of appropriate markers for placental hypoxia, we sought also to identify discrete markers of hypoxia that could be used, regardless of altitude, to determine whether the placenta had been subjected to long-term, chronic hypoxia. Two markers, the erythropoietin receptor (EPO-R) and the transferrin receptor (TfR) were chosen for investigation because previous studies in placenta or trophoblast [9,10] as well as other cell [11–13], and tissue [14] models show that they are upregulated by hypoxia.
METHODS
Subjects
Participants were 25 pregnant women residing at 1600 m (n = 12, 625 mmHg barometric pressure) and 3100 m (n = 13, 530 mmHg barometric pressure). All gave informed consent to procedures that had been approved by the Colorado Multiple Institutional Review Board. Inclusion criteria were primiparity, good health, and the absence of chronic conditions predisposing to preeclampsia such as renal disease, diabetes or obesity. Women were excluded if they had an abnormal oral glucose tolerance test or developed other complications of pregnancy. Subjects resided at their respective altitudes of residence from conception to birth. There are no sea level communities in the state of Colorado and hence a site at 1600 m was used as the ‘control’ site for the 3100 m data collection. There is no evidence that birth weight is decreased or that pregnancy complications are increased at an altitude of 1600 m. As a result, the samples obtained at 1600 m are labeled throughout this report as “low altitude”. The rationale for this designation is detailed further in the discussion.
Sample collection
Maternal blood samples were obtained from 0 to 10 days prior to delivery. Blood was withdrawn from the antecubital vein and allowed to clot for 1 h, serum was separated by centrifugation for 5 min at 10,000 rpm and placed in liquid nitrogen or −70 °C freezer for later analysis. Placentas were collected immediately following delivery and placed in cold phosphate buffered saline (PBS). Placentas were washed in cold PBS until the majority of blood was cleared, the cord and membranes removed and the placenta then weighed. After removing 2 cm around the cord insertion and 2 cm of perimeter, the placenta was cut longitudinally into five strips. Approximately 0.5 cm of the decidual and fetal surfaces were cut away and the remaining villous tissue was chopped into 0.25 cm pieces. Sections from all five strips were mixed, placed into cryotubes and flash frozen in liquid nitrogen.
Plasma membrane preparation
Syncytial microvillous and basal membrane fractions were prepared from flash-frozen tissue by homogenization, magnesium precipitation and differential centrifugation. Frozen villous tissue was partially thawed in 4 volumes of cold homogenization buffer (250 mM sucrose, 10 mM Hepes/ Tris, pH 7.4 containing a protease inhibitor mixture (Cat#P2714, Sigma Chemical, St Louis, MO). The partially thawed tissue (3–5 g) was homogenized for 2 min at full speed using a laboratory blender equipped with a mini-sample container (Fisher Scientific, Fair Lawn, NJ). Homogenates were centrifuged at 4000 × g for 15 min (Avanti I-30, Beckman, Palo Alto, CA), the supernatant retained and the pellet discarded. The supernatants were brought to 20 mM MgCl2 and incubated on ice for 20 min. The mixtures were then centrifuged for 15 min at 2500 × g, generating pellets which contained the syncytial basal membrane (basal membrane fraction, BMF), and which were resuspended in homogenization buffer and frozen at −80 °C. The supernatants were centrifuged at 75,000 × g (30 min) and the resulting pellets, containing purified microvillous membranes (MVM), were resuspended in homogenization buffer and stored at −80 °C.
Immunoblotting
Expression of the erythropoietin receptor (EPO-R), transferrin receptor (TfR), and GLUT1 glucose transporter (GLUT1) in MVM and BMF samples was measured by slot-blotting. Analysis of MVM and BMF samples for these proteins had shown previously that there was only a single immunoreactive band present by Western blotting (data not shown), permitting use of slot-blotting techniques. MVM and BMF samples were diluted to equivalent protein concentration and extracted with 1% SDS. The extracted samples were diluted 50-fold in Tris-buffered saline (TBS; 150 mM NaCl, 100 mM Tris–HCl, pH 7.5) to reduce the SDS concentration to 0.02%, then centrifuged at 16,000 × g for 10 min to remove any remaining insoluble particulate matter. Extracts (1 μg membrane protein in 200 μl TBS) were slot-blotted on a nitrocellulose membrane, according to the manufacturer’s protocol (Bio-Dot SF, BioRad, Hercules, CA). Two sets of seven calibration samples were loaded on to each membrane in addition to the experimental samples. These calibration samples were used to ensure that protein and immunoblotting measurements were performed in the linear range of their respective measurements. Calibration samples comprised a mixture of equal quantities of all the experimental samples being blotted. The volumes for each calibration set ranged from 50 to 500 μl, and thus the approximate protein concentrations in these calibration samples ranged from 0.25 to 2.5 μg membrane protein. For each experiment, 14 calibration and 25 experimental samples from either MVM or BMF were blotted. The remaining nine wells were loaded with samples from the opposing plasma membrane. These latter samples were used to normalize MVM and BMF samples so as to be able to compare expression between the two epithelial membranes.
The relative quantity of protein loaded in each slot was determined by a fluorescent technique using Sypro Ruby, according to the manufacturer’s protocol (Molecular Probes, Eugene, OR) prior to immunoblotting. Membranes were incubated for 15 min in 7% acetic acid, 10% methanol, washed with distilled water and incubated with Sypro Ruby fluorescent stain for 15 min. After washing with distilled water, fluorescence was quantified using a fluorescent imager (Typhoon, Molecular Dynamics, Sunnyvale, CA).
EPO-R, TfR, and GLUT1 expression were evaluated using specific antibodies. Specificity was validated by absence of a signal following omission of the primary antibodies. Following the protein measurement outlined above, membranes were washed in TBS for 30 min, blocked with 3% BSA (in TBS) for 60 min and incubated with the primary antibody diluted in TBS containing 0.5% BSA. The primary antibody dilution and incubation conditions varied for the different antibodies (EPO-R, 1:1000, overnight, 4 °C; TfR, 1:2000, overnight, 4 °C; GLUT1, 1:20,000, 60 min, room temperature). After washing with TBS containing 0.05% Tween 20 (TBST; 1 × 20 min, 2 × 10 min), a secondary antibody was applied (HRP-coupled anti-IgG; 1:10,000, 60 min). For EPO-R, the secondary antibody was donkey anti-sheep IgG, and for GLUT1 was goat anti-rabbit IgG. For TfR, the secondary antibody used was goat anti-mouse IgG. After washing again with TBST, immunoreactive bands were visualized by chemiluminescence. Slot density was quantitated by densitometry (NIH Image, v. 1.61).
β-Actin is widely used for normalization of results. However, β-actin is increased by hypoxia in some tissues [15]. We therefore normalized to protein concentration. The mean values for protein concentration (Sypro Ruby) or expression of specific proteins (immunoblotting) in the calibration sets were plotted against the corresponding volumes of the calibration samples to determine the linear range. If values for the experimental samples fell outside the linear calibration range, either for protein concentration or protein expression, the initial protein concentration was adjusted accordingly and the blot was repeated to ensure that all samples fell within the linear range. Following the validation of linearity, intensity of the signal obtained on immunoblot was normalized using the protein loading values as determined from the Sypro Ruby measurements. Protein expression results are shown in the figures as mean ± SEM for the arbitrary slot density measurement, normalized per microgram membrane protein.
Erythropoietin and transferrin assays
Maternal circulating erythropoietin (EPO) and transferrin (Tf) were measured by ELISA in serum samples using kits from R&D systems (Minneapolis, MN) and Alpha Diagnostic International (San Antonio, TX). All samples were measured in a single batch.
Other assays
Protein concentration in the initially prepared MVM and BMF samples was measured using the Bradford protein assay [16]. Measurements of alkaline phosphatase activity were performed by the method of Bowers and McComb [17] using p-nitrophenylphosphate as a substrate.
Statistical analysis
Results are shown as mean ± SEM for 12 low altitude and 13 high altitude samples. Statistical comparisons were made between low and high altitude samples by Student’s t test and correlation analysis was performed by linear or non-linear regression. Differences in birth weight were examined using a one-tailed test, as reduced birth weight was predicted in the high altitude sample. All other tests were two-tailed. Data are reported as significant where p < 0.05.
MATERIALS
p-Nitrophenylphosphate and bovine serum albumin were obtained from Sigma Chemical Co. (St. Louis, MO). Sypro Ruby fluorescent protein assay reagent was obtained from Molecular Probes (Eugene, OR). Polyclonal anti-GLUT1 was obtained from Chemicon (Temecula, CA), monoclonal anti-TfR from Zymed (Palo Alto, CA), and polyclonal anti-EPO-R from Fitzgerald (Concord, MA). Nitrocellulose blotting membranes were obtained from BioRad (Hercules, CA), the SuperSignal chemiluminescent detection system from Pierce (Rockford, IL) and Hyperfilm ECL from Amersham (Arlington Heights, IL). All other chemicals, including HRP-coupled secondary antibodies, were obtained from Sigma Chemical Co. (St. Louis, MO).
RESULTS
Subject characteristics
Comparison of a variety of demographic characteristics for the low and high altitude women (Table 1) shows that they were similar in almost all respects. Birth weight was lower at high altitude, despite similarity in placental weight, birth length and gestational age. Consequently, the birth weight/placenta weight ratio was reduced in the high altitude group, indicating decreased fetal growth at high compared to low altitude.
Table 1.
Maternal and paternal characteristics (means ± SD)
| 1600 m, n = 12 |
3100 m, n = 13 |
|
|---|---|---|
| Age (years) | 29 ± 3 | 28 ± 7 |
| Height (cm) | 169 ± 5 | 166 ± 8 |
| Pre-pregnant weight (kg) | 62 ± 6 | 61 ± 9 |
| BMI (kg/m2) | 22 ± 2 | 22 ± 3 |
| Weight gain with pregnancy (kg) | 14 ± 5 | 16 ± 5 |
| Maternal education (years) | 18 ± 2 | 13 ± 3** |
| Paternal education (years) | 16 ± 3 | 14 ± 3 |
| Birth weight (g) | 3365 ± 382 | 3076 ± 290* |
| Gestational age (weeks) | 39.4 ± 1.2 | 39.3 ± 1.3 |
| Baby length (cm) | 50.0 ± 3.0 | 51.3 ± 2.6 |
| Placental weight (g) | 551 ± 166 | 629 ± 80 |
| Placental ratio | 6.6 ± 1.3 | 4.9 ± 0.5** |
| Ratio M/F | 9M/3F | 8M/5F |
| Median household income (7$/year) | 62,500 | 45,000 |
| Income range ($/year) | 15K–165K | 24K–225K |
p < 0.05.
p < 0.01.
Validation of sample preparation
Experiments were performed to ensure that the procedure utilized to prepare MVM and BMF had separated the two plasma membrane fractions. These experiments also tested whether the chronic hypoxia to which the high altitude samples were exposed had caused any differences in the membrane preparation. Alkaline phosphatase activity was used as a marker of microvillous-basal separation. Alkaline phosphatase activities of the MVM and BMF did not differ between low altitude and high altitude (Table 2). Moreover, for both low and high altitudes, the alkaline phosphatase activity of the MVM was more than 10-fold higher than the activity in the BMF. These results are consistent with both a high degree of microvillous-basal membrane separation and a similar degree of separation between low altitude and high altitude samples.
Table 2.
Alkaline phosphatase activity in MVM and BMF
| Alkaline phosphatase activity (μmol pNPP/min/mg)a
|
||
|---|---|---|
| Group | MVM | BMF |
| Moderate altitude | 6.72 ± 0.41 | 0.50 ± 0.06 |
| High altitude | 6.85 ± 0.65 | 0.67 ± 0.15 |
pNPP, p-nitrophenylphosphate.
Erythropoietin receptor (EPO-R)
EPO-R protein expression was detected in both the MVM and BMF (Figure 1), with an MVM/BMF ratio of 0.54 at low altitude. EPO-R expression on the MVM increased by 75% at high altitude and by 25% on the BMF (p < 0.05, Figure 1), thus the MVM/BMF ratio for EPO-R increased to 0.80 at high altitude.
Figure 1.

Erythropoietin receptor (EPO-R) protein expression in MVM and BMF at low (black bars) and high altitudes (white bars). Measurements were performed by slot blot and are shown in arbitrary density units, normalized per microgram of membrane protein. *High altitude > low altitude, p < 0.05.
Transferrin receptor (TfR)
Figure 2 shows that TfR was detected in both MVM and BMF, with an MVM/BMF ratio of 1.74. TfR expression in the MVM decreased by ~30% at high altitude (p < 0.05), however, there was no difference in TfR expression on the BMF. The consequence was a decrease in the MVM/BMF ratio to 1.02 at high altitude.
Figure 2.
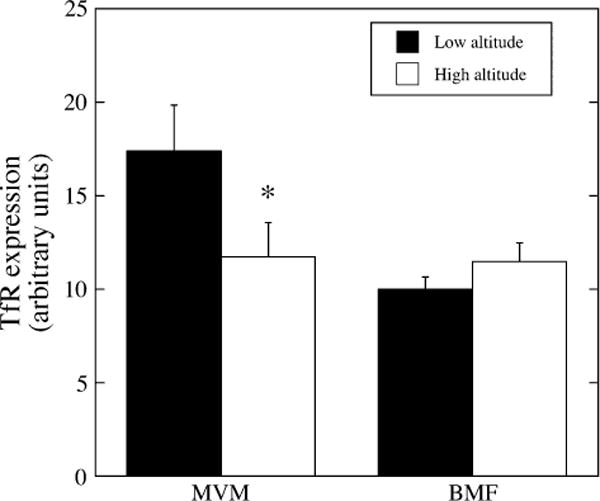
Transferrin receptor (TfR) protein expression in MVM and BMF at low (black bars) and high altitudes (white bars). Measurements were performed by slot blot and are shown in arbitrary density units, normalized per microgram of membrane protein. *High altitude < low altitude, p < 0.05.
GLUT1 glucose transporter
GLUT1 showed no difference in expression on the MVM at high versus low altitude. However, there was a 40% decrease in GLUT1 expression on the BMF in the high altitude compared to low altitude samples (Figure 3). As a result, the MVM/BMF ratio for GLUT1 increased from 7.8 at low to 16.9 at high altitude. There was no correlation between birth weight and GLUT1 expression on the BMF at low altitude (Figure 4), however, when birth weight was plotted as a function of GLUT1 expression in the BMF at high altitude, a significant positive correlation was observed (r2 = 0.63; p < 0.05). There was no relationship between birth weight or placental weight and expression of the other markers on either the MVM or the BMF.
Figure 3.
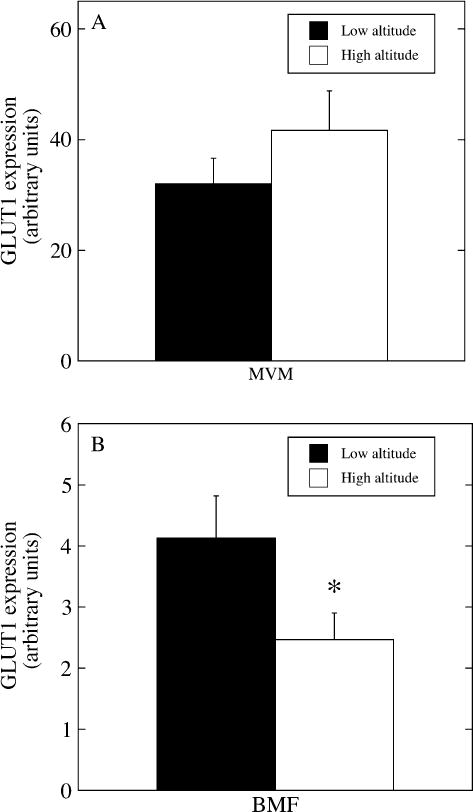
(A) GLUT1 glucose transporter protein expression in MVM at low (black bar) and high altitudes (white bar). (B) GLUT1 glucose transporter expression in BMF at low (black bar) and high (white bar) altitudes. Measurements were performed by slot blot and are shown in arbitrary density units, normalized per microgram of membrane protein. *High altitude < low altitude, p < 0.05.
Figure 4.
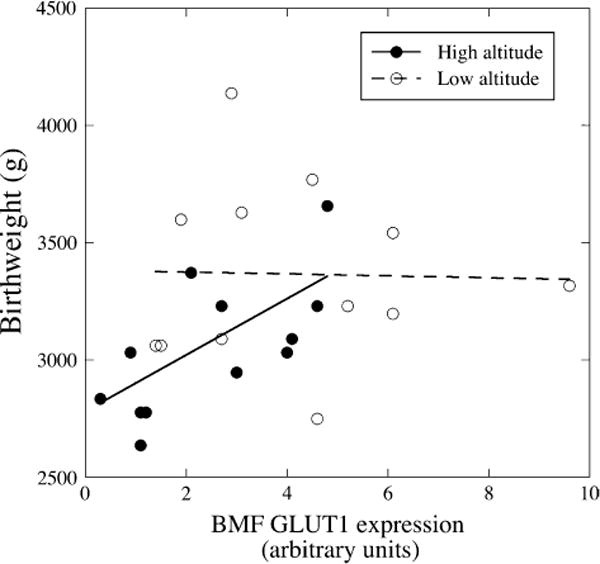
Birth weight as a function of GLUT1 expression. GLUT1 expression was measured by slot blot, normalized per microgram of membrane protein. Birth weight as a function of GLUT1 expression in the BMF at low (open circles) and high altitudes (filled circles). The dotted and continuous lines are the linear regression fits for GLUT1 expression at low (ns) and high (r2 = 0.63, p < 0.05) altitudes.
EPO and transferrin
Circulating EPO was greater in pregnant women at high versus low altitude (26.2 ± 1.4 mIU/ml at 3100 m versus 21.9 ± 1.0 mIU/ml low altitude, p < 0.05). Maternal Tf concentrations did not differ (4.6 ± 0.6 mg/ml low altitude versus 4.2 ± 0.6 mg/ml high altitude). There was no relationship between the circulating concentrations of EPO and Tf and their respective receptors in either the microvillous or the basal membrane of the placentas, nor with placental or birth weight.
DISCUSSION
The high altitude model is a unique means by which to examine the effects of chronic hypoxia on syncytial nutrient transporters in vivo. In this report, EPO-R, a recognized marker of hypoxia, increased in the high altitude syncytial membranes, as predicted from cellular studies. However, both nutrient transporters (TfR and GLUT1), in contrast to what is observed in vitro [7,9,10,12] showed decreased protein expression. The reduction in basal membrane GLUT1 is especially noteworthy, as the basal membrane is the rate-limiting step in transplacental glucose transfer [18]. The correlation with birth weight at high altitude suggests a relationship between glucose transfer capacity and fetal growth under conditions of chronically reduced oxygen availability.
The technique used for membrane purification differed in this versus our prior report [19] and may account for our finding an 8-fold MVM–BM difference in the GLUT1 expression at 1600 m versus the 3–5-fold greater expression we reported in MVM at sea level [19]. Due to limited tissue volume, the sucrose density gradient step used in the latter study was omitted in the present, which results in a basal membrane fraction that is not purified to the same degree. The BMF will thus contain non-plasma membranes, resulting in a lower expression of GLUT1 per unit protein. While this may account for relatively greater asymmetry in MVM to BM expression of GLUT1, two lines of evidence argue against preparative difference as the cause of the reduction in basal membrane GLUT1 expression at high altitude. First, there was no difference in the alkaline phosphatase activity between the membranes at low versus high altitude, indicating that a similar degree of purity was obtained for the MVM and BMF at both altitudes. Second, two unrelated proteins, TfR and EPO-R, were similar and increased, respectively, in the BMF at high versus low altitude. If the reduction in GLUT1 in the BMF had been caused by dilution of the syncytial basal membrane with other, non-plasma membranes, we would expect to see similar reduction in all the other proteins of interest, not an increase as with EPO-R. If dilution with other, non-trophoblast plasma membranes were the cause of reduced GLUT1, we would expect an even greater reduction in TfR since TfR within the placenta is found only in trophoblast plasma membranes [20]. The decrease in GLUT1 on the BMF thus appears to be specific.
A site at 1600 m was used as the ‘control’ or low altitude site. There is no evidence that birth weight is decreased or that pregnancy complications are increased at an altitude of 1600 m [2,5] relative to sea level. The oxygen dissociation curve dictates that reduction in arterial oxygen saturation is not pronounced until greater than ~2500 m elevation. Consistent with prior reports, we found that birth weight was reduced and the placental/fetal weight ratio was increased at 3100 m [6] but birth weight and the placental/fetal weight ratio at 1600 m were similar to published reports from sea level.
It is a limitation of the present study that no direct measurements of hypoxia, e.g. arterial blood gases or arterial oxygen saturation, were obtained. In our prior study of pregnant women at 3100 m versus 1600 m, arterial oxygen saturations ranged from 86 to 94%; the mean of 90% at 3100 m was significantly lower than the mean of 95% (range 92–100%) observed in women at 1600 m [21]. The elevated circulating EPO reported here and our prior finding of elevated HIF-1α in the placentas of the high altitude women supports a greater degree of hypoxemia at 3100 m than in the 1600 m controls [22].
All three of the proteins measured in this report are upregulated by hypoxia in other systems [12–14,23,24]. Increased expression of TfR and GLUT1 with hypoxia is directly attributable to stimulation via the HIF-1 pathway [12,23,25]. The HIF pathway has not been directly tested with respect to EPO-R, but the erythropoietin promoter has a hypoxia response element and is increased by HIF stimulation. EPO and EPO-R levels are both increased by hypoxia in parallel fashion in brain and neuronal cells [14], suggesting that EPO-R is also subject to regulation by HIFs. The elevation in membrane EPO-R and circulating EPO at high altitude is thus most likely due to upregulation of placental HIF-1α [22]. EPO-R is found in all trophoblast populations, the villous core and the endothelium of fetoplacental blood vessels [26]. We report here, for the first time, that EPO-R is localized to both the microvillous and basal membrane fraction of the syncytiotrophoblast, with a near 2-fold greater level of expression in the basal membrane fraction, suggesting that the effects of erythropoietin on the placenta (growth, angiogenic, anti-apoptotic) may be promoted through both the maternal and fetal circulations [14].
In contrast to EPO-R, TfR has been observed only in syncytiotrophoblast and in the proximal ends of cytotrophoblast columns in human placenta [20,27]. While TfR is labeled as a receptor, it mediates syncytiotrophoblast uptake of iron and hence should be classified as a nutrient transporter [27,28]. TfR has been localized previously to the microvillous and basal membrane [29]. Transferrin uptake is greater on the microvillous than basal membrane [28], consistent with a greater density of receptors on the microvillous membrane, which is similar to our low altitude results. The effect of high altitude was to reduce TfR expression in the microvillous membrane, but not the basal membrane fraction, resulting in equivalent expression on both sides of the syncytium. It is not clear what the functional effect this change in microvillous membrane TfR might have on iron transfer. TfR increases when iron is low and decreases when iron is high [30,31], independent of oxygen status. However, differences in maternal iron status are unlikely to explain our results, as maternal circulating transferrin concentrations were normal and equivalent at 1600 m versus 3100 m.
While members of the glucose transporter family are ubiquitous in placenta tissue, only GLUT1 is expressed in the syncytiotrophoblast at term [19]. Its distribution between the two opposing epithelial membranes is markedly more asymmetric than either EPO-R or TfR. Because basal membrane GLUT1 is the rate-limiting step in maternal to fetal transfer of glucose [18] alterations in basal membrane expression have significant consequences for the maternalefetal transfer of glucose. Basal membrane GLUT1 expression is elevated in diabetic pregnancy, commensurate with a functional increase in glucose transfer [32]. In contrast, in sea level FGR, no differences in microvillous or basal membrane GLUT1 expression or activity have been observed [33]. GLUT1 expression in both cultured human trophoblast and BeWo cells is increased by hypoxia [7,9]. This differs from our high altitude data, in which decreased fetal weight (not clinically defined as FGR) under conditions of lowered maternal arterial PO2 is associated with reduced BMF GLUT1. Thus in vivo, hypoxia is not the only factor regulating syncytial GLUT1 expression. GLUT1 expression has been shown to be regulated by extracellular glucose concentrations, insulin, insulin-like growth factors and other effectors [34]. Some of these factors are altered at high altitude, e.g. maternal venous glucose and insulin concentrations are lower [35]. It is probable therefore that the syncytial expression of GLUT1 is the net result of multiple factors, many of which, such as insulin and the insulin-like growth factors, are intimately connected to the regulation of fetal growth, and that these signals can override hypoxia-induced upregulation of the GLUT1 glucose transporter.
In summary, several novel observations are reported here. EPO-R was localized in the syncytium to both microvillous and basal membranes at approximately equal densities. The increase in EPO-R in response to chronic hypoxia suggests this protein could be a useful marker of placental hypoxia in studies of pregnancy complications. In contrast, the nutrient transporters, TfR and GLUT1, are decreased in the MVM and BM, respectively, despite the fact that they are increased by hypoxia in vitro [7,9,10,12]. The results support that reduction in fetal growth at high altitude is not necessarily a direct effect of reduced PO2 (e.g. a net reduction in the oxygen available for growth and metabolism); reduction in nutrient transport via pathways related to overall regulation of growth is clearly involved. The lack of similar findings in sea level FGR suggests that the reduction in fetal weight at high altitude may be different in origin from that observed in clinical FGR at sea level and that further investigation of this natural experimental model may reveal distinct etiological differences in growth abnormalities.
Acknowledgments
The authors thank Marietta Mascarina for her contribution to this project. Funding was provided by the National Science Foundation BCS 0309142, NIH HD 42737, American Heart Association Colorado Affiliate CWGB 27 (the Honorable and Mrs. Harry and Florence Ruston Award) & American Heart Association Grant-in-Aid 96-014220 to Dr. Zamudio. Additional funding was provided by NIH HD 46982 to Dr. Illsley. The authors acknowledge the assistance of Polly Lee and Martha Tissot van Patot in subject recruitment and sample collection. Dr. Lisa Zwerdlinger of the Leadville Medical Center is gratefully acknowledged for patient referrals and support of the research effort. We thank the nursing staff in the Labor and Delivery sections of the following hospitals: St. Vincent’s Hospital, Leadville, Colorado, University Hospital, St. Joseph’s Hospital, St. Luke’s Presbyterian Hospital, Rose Medical Center, Swedish Hospital and St. Anthony’s Hospital, Denver, Colorado for their help and support in placental collections.
References
- 1.Lichty JL, Ting R, Bruns PD, Dyar E. Studies of babies born at high altitude. I. Relationship of altitude to birth weight. Am J Dis Child. 1957;93:666–9. doi: 10.1001/archpedi.1957.02060040668009. [DOI] [PubMed] [Google Scholar]
- 2.Yip R. Altitude and birth weight. J Pediatr. 1987;111:869–76. doi: 10.1016/s0022-3476(87)80209-3. [DOI] [PubMed] [Google Scholar]
- 3.Palmer SK, Moore LG, Young D, Cregger B, Berman JC, Zamudio S. Altered blood pressure course during normal pregnancy and increased preeclampsia at high altitude (3100 meters) in Colorado. Am J Obstet Gynecol. 1999;180:1161–8. doi: 10.1016/s0002-9378(99)70611-3. [DOI] [PubMed] [Google Scholar]
- 4.Shime J, Mocarski EJ, Hastings D, Webb GD, McLaughlin PR. Congenital heart disease in pregnancy: short- and long-term implications. Am J Obstet Gynecol. 1987;156:313–22. doi: 10.1016/0002-9378(87)90275-4. [DOI] [PubMed] [Google Scholar]
- 5.Jensen GM, Moore LG. The effect of high altitude and other risk factors on birthweight: independent or interactive effects? Am J Public Health. 1997;87:1003–7. doi: 10.2105/ajph.87.6.1003. [DOI] [PMC free article] [PubMed] [Google Scholar]
- 6.Zamudio S. The placenta at high altitude. High Alt Med Biol. 2003;4:171–91. doi: 10.1089/152702903322022785. [DOI] [PubMed] [Google Scholar]
- 7.Esterman A, Greco MA, Mitani Y, Finlay TH, Ismail-Beigi F, Dancis J. The effect of hypoxia on human trophoblast in culture: morphology, glucose transport and metabolism. Placenta. 1997;18:129–36. doi: 10.1016/s0143-4004(97)90084-9. [DOI] [PubMed] [Google Scholar]
- 8.Nelson DM, Smith S, Furesz T, Sadovsky Y, Ganapathy V, Parvin C, et al. Hypoxia reduces expression and function of system A amino acid transporters in cultured term human trophoblasts. Am J Physiol. 2002;284:C310–5. doi: 10.1152/ajpcell.00253.2002. [DOI] [PubMed] [Google Scholar]
- 9.Baumann M, Illsley NP. Transferrin receptor and GLUT1 glucose transporter expression are altered in microvillous membrane by cobalt exposure. Placenta. 2001;22:A45. [Google Scholar]
- 10.Petry CD, Wobken JD, McKay H, Eaton MA, Seybold VS, Johnson DE, et al. Placental transferrin receptor in diabetic pregnancies with increased fetal iron demand. Am J Physiol. 1994;267:E507–14. doi: 10.1152/ajpendo.1994.267.4.E507. [DOI] [PubMed] [Google Scholar]
- 11.Lok CN, Ponka P. Identification of a hypoxia response element in the transferrin receptor gene. J Biol Chem. 1999;274:24147–52. doi: 10.1074/jbc.274.34.24147. [DOI] [PubMed] [Google Scholar]
- 12.Bianchi L, Tacchini L, Cairo G. HIF-1-mediated activation of transferrin receptor gene transcription by iron chelation. Nucleic Acids Res. 1999;27:4223–7. doi: 10.1093/nar/27.21.4223. [DOI] [PMC free article] [PubMed] [Google Scholar]
- 13.Yu X, Shacka JJ, Eells JB, Suarez-Quian C, Przygodzki RM, Beleslin-Cokic B, et al. Erythropoietin receptor signalling is required for normal brain development. Development. 2002;129:505–16. doi: 10.1242/dev.129.2.505. [DOI] [PubMed] [Google Scholar]
- 14.Siren AL, Knerlich F, Poser W, Gleiter CH, Bruck W, Ehrenreich H. Erythropoietin and erythropoietin receptor in human ischemic/hypoxic brain. Acta Neuropathol (Berl) 2001;101:271–6. doi: 10.1007/s004010000297. [DOI] [PubMed] [Google Scholar]
- 15.Zhong H, Simons JW. Direct comparison of GAPDH, b-actin, cyclophilin and 28S rRNA as internal standards for quantifying RNA levels under hypoxia. Biochem Biophys Res Commun. 1999;259:523–6. doi: 10.1006/bbrc.1999.0815. [DOI] [PubMed] [Google Scholar]
- 16.Bradford MM. A rapid and sensitive method for the quantitation of microgram quantities of protein utilizing the principle of protein-dye binding. Anal Biochem. 1976;72:248–54. doi: 10.1016/0003-2697(76)90527-3. [DOI] [PubMed] [Google Scholar]
- 17.Bowers GN, McComb RB. A continuous spectrophotometric method for measuring the serum activity of alkaline phosphatase. Clin Chem. 1966;12:70–89. [PubMed] [Google Scholar]
- 18.Vardhana PA, Illsley NP. Transepithelial glucose transport and metabolism in BeWo choriocarcinoma cells. Placenta. 2002;23:653–60. doi: 10.1053/plac.2002.0857. [DOI] [PubMed] [Google Scholar]
- 19.Illsley NP. Glucose transporters in the human placenta. Placenta. 2000;21:14–22. doi: 10.1053/plac.1999.0448. [DOI] [PubMed] [Google Scholar]
- 20.Bulmer JN, Thrower S, Wells M. Expression of epidermal growth factor receptor and transferrin receptor by human trophoblast populations. Am J Reprod Immunol. 1989;21:87–93. doi: 10.1111/j.1600-0897.1989.tb01009.x. [DOI] [PubMed] [Google Scholar]
- 21.Zamudio S, Palmer SK, Dahms TE, Berman JC, McCullough RG, McCullough RE, et al. Blood volume expansion, preeclampsia, and infant birth weight at high altitude. J Appl Physiol. 1993;74:1566–73. doi: 10.1152/jappl.1993.75.4.1566. [DOI] [PubMed] [Google Scholar]
- 22.Caniggia I, Wu YY, Zamudio S. Overexpression of HIF-1 alpha in placentas from high altitude pregnancies. Placenta. 2002;23:A49. [Google Scholar]
- 23.Tacchini L, Bianchi L, Bernelli-Zazzera A, Cairo G. Transferrin receptor induction by hypoxia. HIF-1-mediated transcriptional activation and cell-specific post-transcriptional regulation. J Biol Chem. 1999;274:24142–6. doi: 10.1074/jbc.274.34.24142. [DOI] [PubMed] [Google Scholar]
- 24.Ebert B, Firth J, Ratcliffe P. Hypoxia and mitochondrial inhibitors regulate expression of glucose transporter-1 via distinct cis-acting sequences. J Biol Chem. 1995;270:29083–9. doi: 10.1074/jbc.270.49.29083. [DOI] [PubMed] [Google Scholar]
- 25.Zelzer E, Levy Y, Kahana C, Shilo B, Rubinstein M, Cohen B. Insulin induces transcription of target genes through the hypoxia-inducible factor HIF-1alpha/ARNT. EMBO J. 1998;17:5085–94. doi: 10.1093/emboj/17.17.5085. [DOI] [PMC free article] [PubMed] [Google Scholar]
- 26.Fairchild Benyo D, Conrad KP. Expression of the erythropoietin receptor by trophoblast cells in the human placenta. Biol Reprod. 1999;60:861–70. doi: 10.1095/biolreprod60.4.861. [DOI] [PubMed] [Google Scholar]
- 27.Georgieff MK, Wobken JK, Welle J, Burdo JR, Connor JR. Identification and localization of divalent metal transporter-1 (DMT-1) in term human placenta. Placenta. 2000;21:799–804. doi: 10.1053/plac.2000.0566. [DOI] [PubMed] [Google Scholar]
- 28.Verrijt CE, Kroos MJ, Huijskes-Heins MI, Cleton-Soeteman MI, van Run PR, van Eijk HG, et al. Accumulation and release of iron in polarly and non-polarly cultured trophoblast cells isolated from human term placentas. Eur J Obstet Gynecol Reprod Biol. 1999;86:73–81. doi: 10.1016/s0301-2115(99)00040-8. [DOI] [PubMed] [Google Scholar]
- 29.Verrijt CE, Kroos MJ, van Noort WL, van Eijk HG, van Dijk JP. Binding of human isotransferrin variants to microvillous and basal membrane vesicles from human term placenta. Placenta. 1997;18:71–7. doi: 10.1016/s0143-4004(97)90073-4. [DOI] [PubMed] [Google Scholar]
- 30.Gambling L, Danzeisen R, Gair S, Lea RG, Charania Z, Solanky N, et al. Effect of iron deficiency on placental transfer of iron and expression of iron transport proteins in vivo and in vitro. Biochem J. 2001;356:883–9. doi: 10.1042/0264-6021:3560883. [DOI] [PMC free article] [PubMed] [Google Scholar]
- 31.Kroos MJ, Starreveld JS, Verrijt CE, van Eijk HG, van Dijk JP. Regulation of transferrin receptor synthesis by human cytotrophoblast cells in culture. Eur J Obstet Gynecol Reprod Biol. 1996;65:231–4. doi: 10.1016/0301-2115(95)02368-2. [DOI] [PubMed] [Google Scholar]
- 32.Gaither K, Quraishi AN, Illsley NP. Diabetes alters the expression and activity of the human placental GLUT1 glucose transporter. J Clin Endocrinol Metab. 1999;84:695–701. doi: 10.1210/jcem.84.2.5438. [DOI] [PubMed] [Google Scholar]
- 33.Jansson T, Ylven K, Wennergren M, Powell TL. Glucose transport and system A activity in syncytiotrophoblast microvillous and basal plasma membranes in intrauterine growth restriction. Placenta. 2002;23:392–9. doi: 10.1053/plac.2002.0826. [DOI] [PubMed] [Google Scholar]
- 34.Baumann MU, Deborde S, Illsley NP. Placental glucose transfer and fetal growth. Endocrine. 2002;19:13–22. doi: 10.1385/ENDO:19:1:13. [DOI] [PubMed] [Google Scholar]
- 35.Krampl E, Kametas NA, Nowotny P, Roden M, Nicolaides KH. Glucose metabolism in pregnancy at high altitude. Diabetes Care. 2001;24:817–22. doi: 10.2337/diacare.24.5.817. [DOI] [PubMed] [Google Scholar]