

Abstract
Purpose
We report data from the Multidisciplinary Approach to the Study of Chronic Pelvic Pain (MAPP) network to: (1) identify participants having either (a) urologic chronic pelvic pain syndromes (UCPPS) only or (b) chronic functional non-urological associated somatic syndromes (NUAS) in addition to UCPPS, (2) characterize these two subgroups, and (3) explore these two subgroups using three criteria: (a) the MAPP eligibility criteria, (b) self-reported medical history, or (c) RAND interstitial cystitis epidemiologic (RICE) criteria.
Materials and Methods
Self-reported cross-sectional data were collected from men and women with UCPPS including: predominant symptoms, symptom duration and severity, NUAS symptoms, and psychosocial factors.
Results
Of 424 UCPPS participants, 162 (38%) had NUAS: 93 (22%) irritable bowel syndrome, 15 (4%) fibromyalgia, 13 (3%) chronic fatigue syndrome, and 41 (10%) with multiple syndromes. Among 233 females, 103 (44%) had NUAS compared to 59 (31%) of 191 males (p = 0.006). Participants with NUAS had more severe urological symptoms, and more frequent depression and anxiety. Of 424 participants, 228 (54%) met RICE criteria. Among 228 RICE-positive participants, 108 (47%) had NUAS compared to 54 (28%) of 203 RICE-negative patients with NUAS (p < 0.001).
Conclusions
NUAS represent important clinical characteristics of UCPPS. Participants with NUAS have more severe symptoms, longer duration and higher rates of depression and anxiety. RICE-positive patients are more likely to have NUAS and more severe symptoms. Because NUAS are more common in women, future studies need to account for this potential confounding factor in UCPPS.
Introduction
Historically, men with chronic pelvic pain symptoms unrelated to active infection were diagnosed with “chronic non-bacterial prostatitis;” women with urinary symptoms and pelvic pain unrelated to active infection were diagnosed with “chronic interstitial cystitis.” Although women constituted the majority of patients with “cystitis” unrelated to infection, a few men with prominent bladder pain were also diagnosed with “interstitial cystitis.” Because bladder pain is so prominent, many authorities prefer, “interstitial cystitis/painful bladder syndrome” (IC/PBS). [1, 2] Current understanding is that prostate and/or bladder pathology may not be central in every patient with urologic chronic pelvic pain syndromes (UCPPS). [3] Typically men with UCPPS are diagnosed with “chronic prostatitis/chronic pelvic pain syndrome” (CP/CPPS)[4] or IC/PBS while women are diagnosed with IC/PBS. [5]
Recent observations suggest that UCPPS patients have higher rates of chronic non-urological associated syndromes (NUAS), including fibromyalgia, chronic widespread pain, irritable bowel syndrome, temporal-mandibular disorder and vulvodynia, than the general population,[6–10]. Previous studies considered either men [11, 12] or women [13] and did not include diagnostic measures to confirm NUAS. These observations support the National Institute of Diabetes and Digestive and Kidney Diseases’ Multidisciplinary Approach to the Study of Chronic Pelvic Pain (MAPP) hypothesis that there are two UCPPS subsets: patients with IC/PBS or CP/CPPS symptoms only, and patients who also display NUAS. Patients with NUAS are postulated to have a more systemic condition, characterized by central nervous system perturbations and decreased quality of life compared to patients with UCPPS only. To evaluate this further, we compared predominant symptoms and psychosocial factors in male and female UCPPS patients with versus without NUAS. We also evaluated the MAPP population using the best-validated epidemiological criteria for IC/PBS, the RAND Interstitial Cystitis Epidemiology (RICE) case definition, and asked if RICE-positive cases differ from RICE-negative patients.
Materials and Methods
Overview of the MAPP
The MAPP includes six discovery sites and two cores that coordinate data collection and provide technical support. Details of the MAPP and detailed definitions are provided elsewhere. [3, 14] This report utilizes baseline cross-sectional data collected in the trans-MAPP epidemiology and phenotyping study.[3]
Inclusion and exclusion criteria
Inclusion criteria for males or females at least 18 years of age included: written, informed consent and a nonzero response of pain, pressure or discomfort (0–10 scale) associated with the bladder/prostate and/or pelvic region. Females met IC/PBS criteria; males met IC/PBS or CP/CPPS criteria, or both. To meet IC/PBS criteria participants reported an unpleasant sensation of pain, pressure or discomfort, related to the bladder and/or pelvic region associated with lower urinary tract symptoms. IC/PBS symptoms must have been present for most of the previous 3 months. Males met CP/CPPS criteria if they reported pain or discomfort in any of 8 Male Genitourinary Pain Index (MGUPI) domains, with symptoms present for the majority of 3 of the previous 6 months.
Exclusion criteria included: urethral stricture, neurological disease, bowel fistula, cystitis caused by tuberculosis, radiation, or cytoxan/cyclophosphamide, augmentation cystoplasty, cystectomy, inflammatory bowel disease, systemic lupus erythematosis, rheumatoid arthritis, HIV infection, major psychiatric disorder, or severe cardiac, pulmonary, renal, or hepatic disease. Males only were excluded for isolated orchalgia, prostate microwave, needle ablation, balloon dilation, cryosurgery or laser procedure.
Trans-MAPP epidemiological phenotyping study
Targeted recruitment was 380 participants, with each site expected to recruit equal numbers of males and females and patients with short (<2 years) and long (≥2 years) duration. Recruitment remained open until each subgroup was recruited, resulting in 424 patients.[3]
To assess NUAS, positive symptoms on the Complex Multi-Symptom Inventory [15] triggered diagnostic criteria for irritable bowel syndrome [16], fibromyalgia [17], and chronic fatigue syndrome. [18] Non-urological domains were assessed with validated instruments including: (a) generalized pain throughout the body (BPI overall severity, pain interference and pain distribution), (b) psychiatric symptoms (HADS–anxiety and depression), (c) affective style (PANAS –positive and negative characteristic), (d) stress (PSS), (e) catastrophizing (CSQ), and (f) personality (IPIP–neuroticism, extroversion, openness, agreeableness, conscientiousness) using approaches detailed elsewhere. [14]
RICE IC/PBS definition
Subjects completed the RICE high-sensitivity case definition items. This definition is validated for IC/PBS in women (48% sensitivity, 83% specificity) but has been used in both men and women to suggest that 2.7% of US women and 1.9% of US men have symptoms consistent with IC/PBS.[1, 19, 20]
Statistical analyses
Effect sizes were calculated with 80% power assuming a two-sided type I error of α=0.05 and 360 subjects. We report results for 40% prevalence since 37% of subjects had NUAS (power table in JR Landis, DA Williams, MS Lucia, DJ Clauw, BD Naliboff, NA Robinson, A van Bokhoven, S Sutcliffe, AJ Schaeffer, LV Rodriguez, et al. [3]). For continuous outcomes, there was 80% power to detect a difference of 0.32 SD. Considering binary outcomes, there was 80% power to detect an OR of 2.0 with a rate of 25% among those with NUAS and 40% among those without. Final enrollment of 424 provided power to detect smaller effects.
Before analyses, measures were fully described, including aspects of data quality. Summary statistics were examined for demographics and symptom data. In unadjusted analyses symptom assessments were treated as continuous, except that SYM-Q was treated as ordinal. Comparisons employed two-sample t- and Wilcoxon tests. Demographic data between patients with and without NUAS were compared by chi-square tests. Age, sex, symptom duration, and employment were selected as confounders based on marginally significant associations with NUAS. Employment was reduced to three levels (employed, disabled, or other) for adjustment. Multivariable logistic and linear regression adjusting for confounders were used to test differences in medical history and symptoms by NUAS for binary and continuous outcomes, respectively. Categorical variables with multiple levels were adjusted using baseline-category logit models. Hypothesis testing employed a two-sided α=0.01 to reduce the likelihood false positive results under multiple testing. Standard corrections for multiple comparisons were considered overly conservative considering the likely correlation among symptom measures. Analyses were performed using SAS 9.3.
Results
Demographics and symptom duration (Table 1)
Table 1.
Baseline Demographics and Symptom Duration of MAPP Participants with Chronic Pelvic Pain by Non-urological Associated Syndrome (NUAS) Criteria
| All | UCPPS Only | UCPPS with Syndromes | p* UCPPS vs. UCPPS with syndromes |
||
|---|---|---|---|---|---|
| Number of Participants | 424 | 262 | 162 | ||
| Clinical Site | Northwestern U | 58 (13.7%) | 35 (13.4%) | 23 (14.2%) | 0.951 |
| UCLA | 66 (15.6%) | 43 (16.4%) | 23 (14.2%) | ||
| U of Iowa | 61 (14.4%) | 34 (13.0%) | 27 (16.7%) | ||
| U of Michigan | 70 (16.5%) | 45 (17.2%) | 25 (15.4%) | ||
| U of Washington | 71 (16.7%) | 44 (16.8%) | 27 (16.7%) | ||
| WashU St. Louis | 75 (17.7%) | 46 (17.6%) | 29 (17.9%) | ||
| Stanford U | 23 (5.4%) | 15 (5.7%) | 8 (4.9%) | ||
| Duration of Symptoms | 8.5 (10.6) | 7.8 +/− 9.8 | 9.7 +/− 11.8 | 0.088 | |
| Age | 43.4 (15.1) | 44.4 +/− 15.2 | 41.7 +/− 14.8 | 0.076 | |
| Age Group | <35 years | 160 (37.7%) | 89 (34.0%) | 71 (43.8%) | 0.126 |
| 35–50 Years | 122 (28.8%) | 80 (30.5%) | 42 (25.9%) | ||
| 50+ Years | 142 (33.5%) | 93 (35.5%) | 49 (30.2%) | ||
| Race | White | 374 (88.2%) | 234 (89.3%) | 140 (86.4%) | 0.668 |
| Black | 16 (3.8%) | 9 (3.4%) | 7 (4.3%) | ||
| Other | 34 (8.0%) | 19 (7.3%) | 15 (9.3%) | ||
| Gender | Male | 191 (45.0%) | 132 (50.4%) | 59 (36.4%) | 0.005 |
| Female | 233 (55.0%) | 130 (49.6%) | 103 (63.6%) | ||
| Ethnicity | Hispanic | 28 (6.6%) | 15 (5.7%) | 13 (8.0%) | 0.345 |
| Non-Hispanic | 395 (93.2%) | 247 (94.3%) | 148 (91.4%) | ||
| Unknown | 1 (0.2%) | 0 (0%) | 1 (0.6%) | ||
| Employment | Employed | 278 (65.6%) | 182 (69.5%) | 96 (59.3%) | <.001 |
| Unemployed | 58 (13.7%) | 37 (14.1%) | 21 (13.0%) | ||
| Retired | 43 (10.1%) | 28 (10.7%) | 15 (9.3%) | ||
| Full-time homemaker | 12 (2.8%) | 6 (2.3%) | 6 (3.7%) | ||
| Disabled | 32 (7.5%) | 8 (3.1%) | 24 (14.8%) | ||
| Missing | 1 (0.2%) | 1 (0.4%) | 0 (0%) | ||
| Income | $10,000 or less | 40 (9.4%) | 17 (6.5%) | 23 (14.2%) | 0.046 |
| $10,001 to $25,000 | 34 (8.0%) | 22 (8.4%) | 12 (7.4%) | ||
| $25,001 to $50,000 | 69 (16.3%) | 43 (16.4%) | 26 (16.0%) | ||
| $50,001 to $100,000 | 122 (28.8%) | 72 (27.5%) | 50 (30.9%) | ||
| More than $100,000 | 120 (28.3%) | 86 (32.8%) | 34 (21.0%) | ||
| Prefer not to Answer | 37 (8.7%) | 21 (8.0%) | 16 (9.9%) | ||
| Missing | 2 (0.5%) | 1 (0.4%) | 1 (0.6%) |
Values in table are the number and relative frequency of subjects falling into each category or the mean (sd) for continuous variables. P value s represent unadjusted comparisons of demographic factors between UCPPS patients with and without NUAS.
Of 424 participants, 262 (62%) had UCPPS only; 162 (38%) had NUAS plus UCPPS. Among 233 females, 103 (44%) had NUAS compared to 59 (31%) of 191 males (OR = 1.77, 99% CI (1.03, 3.08); p = 0.005). Participants with NUAS averaged 4.6 years younger at diagnosis (p = 0.003) and 2.7 years younger at study entry (p=0.076). Participants with NUAS were less likely to report full-time employment, although this difference was not significant after adjustment for sex and duration, and more likely ‘disabled’ (employment adjusted OR=0.64 99% CI (0.36, 1.14), p = 0. 048; disabled adjusted OR=4.56, 99% CI (1.50, 13.85), p=0.004).
Medical history (Table 2)
Table 2.
Baseline Medical History and Non-urological Associated Syndrome (NUAS) in MAPP Participants with Urological Chronic Pelvic Pain by NUAS Criteria
| All N (%) | UCPPS Only N (%) | UCPPS with Syndromes N (%) | p values
|
||||
|---|---|---|---|---|---|---|---|
| Unadjusted | Adjusted† | Adjusted OR (99% CI) | |||||
| Number of Participants | 424 | 262 | 162 | ||||
| Presence of Types of NUAS | None | 262 (61.8%) | 262 (100.0%) | 0 (0%) | |||
| FM only | 15 (3.5%) | - | 15 (9.3%) | ||||
| IBS only | 93 (21.9%) | - | 93 (57.4%) | ||||
| CFS only | 13 (3.1%) | - | 13 (8.0%) | ||||
| >1 Dx | 41 (9.7%) | - | 41 (25.3%) | ||||
| IC/PBS Diagnosis from RICE | Yes | 228 (53.8%) | 120 (45.8%) | 108 (66.7%) | <.001 | <.001 | 2.31 (1.30, 4.08) |
| No | 196 (46.2%) | 142 (54.2%) | 54 (33.3%) | ||||
| Met MAPP IC/PBS Criteria | Yes | 376 (88.7%) | 224 (85.5%) | 152 (93.8%) | 0.009 | 0.107 | 1.94 (0.67, 5.58) |
| No | 48 (11.3%) | 38 (14.5%) | 10 (6.2%) | ||||
| Taking Medication for Urologic or Pelvic Pain Symptoms | Yes | 307 (72.4%) | 183 (69.8%) | 124 (76.5%) | 0.134 | 0.494 | 1.18 (0.63, 2.20) |
| No | 117 (27.6%) | 79 (30.2%) | 38 (23.5%) | ||||
Values in the table denote the number and relative frequency of patients satisfying each criterion by NUAS status. Adjusted p-values and odds ratios (OR) are adjusted for age, sex, duration of symptoms, and 3-level employment (employed, disabled, or other).
Of 162 participants with NUAS, 93 (57%) had irritable bowel syndrome only, 15 (9%) had fibromyalgia only, 13 (8%) had chronic fatigue syndrome only, whereas 41 (25%) had multiple syndromes.
Adjusting for demographics, medical histories were similar for participants with and without NUAS. Of 424 participants, 228 (54%) satisfied IC/PBS RICE criteria, including 108 (67%) of 162 with NUAS and 120 (46%) of 262 without NUAS (OR=2.31, 99% CI (1.30, 4.08), p < 0.001). Among 162 participants with NUAS, 152 (94%) met MAPP IC/PBS criteria compared to 224 (86%) of 268 participants with UCPPS only (OR=1.94, 99% CI (0.67, 5.58), p = 0.107). All males with NUAS and all but one male without NUAS met CP/CPPS criteria. Of 191 males, 28 of 132 (21%) without NUAS and 16 of 59 (27%) with NUAS self- reported an IC/PBS diagnosis (OR=1.55, 99% CI (0.59, 4.07), p=0.245).
Of 262 participants without NUAS, 183 (70%) were taking medications for pelvic pain. Similarly, of 162 patients with NUAS, 124 (77%) were taking medications for UCPPS (OR=1.18, 99% CI (0.63, 2.20), p = 0.494). Considering medications taken for any reason, there was no significant difference in the types of medications used by patients with and without NUAS (data not shown).
Urological symptoms (Table 3/Figure 1)
Table 3.
Mean (SD) of Urological Symptoms of MAPP Participants with Urological Chronic Pelvic Pain by Non-urological Associated Syndrome Criteria
| UCPPS Only (n=262)
|
UCPPS with Syndromes (n=162)
|
Significance
|
|||||
|---|---|---|---|---|---|---|---|
| N | Mean +/− s.d. | N | Mean +/− s.d. | Unadjusted p | Adjusted† p | Adjusted Mean Difference β (99% CI) | |
| SYM-Q1: Baseline Pain (0–10) | 262 | 4.7 +/− 2.1 | 162 | 5.6 +/− 2.2 | <.001 | 0.005 | 0.63 (0.06, 1.20) |
| SYM-Q2: Baseline Urgency (0–10) | 262 | 4.8 +/− 2.5 | 162 | 5.4 +/− 2.6 | 0.016 | 0.107 | 0.42 (−0.25, 1.10) |
| SYM-Q3: Baseline Frequency (0–10) | 262 | 4.6 +/− 2.6 | 162 | 5.5 +/− 2.6 | <.001 | 0.003 | 0.79 (0.10, 1.47) |
| SYM-Q4: Baseline Void (1–4) | 260 | 2.4 +/− 0.9 | 161 | 2.6 +/− 1.0 | 0.002 | 0.013 | 1.62 (0.98, 2.67) |
| SYM-Q5: Baseline Uro-Symptoms (0–10) | 262 | 4.8 +/− 2.3 | 161 | 5.8 +/− 2.3 | <.001 | <.001 | 0.78 (0.18, 1.39) |
| SYM-Q6: Baseline NonUro-Symptoms (0–10) | 262 | 2.5 +/− 2.5 | 162 | 4.4 +/− 2.7 | <.001 | <.001 | 1.56 (0.88, 2.23) |
| Baseline GUPI Pain Score (0–23) | 261 | 11.7 +/− 4.1 | 161 | 13.9 +/− 4.6 | <.001 | <.001 | 1.74 (0.60, 2.88) |
| Baseline GUPI Urinary Subscale (0–10) | 262 | 4.9 +/− 2.8 | 162 | 6.0 +/− 3.1 | <.001 | 0.004 | 0.85 (0.08, 1.62) |
| Baseline GUPI QOL Impact Subscore (0–12) | 262 | 7.4 +/− 2.9 | 162 | 8.3 +/− 2.8 | <.001 | 0.020 | 0.68 (−0.07, 1.42) |
| Baseline GUPI Total Score (0–45) | 261 | 24.0 +/− 8.1 | 161 | 28.2 +/− 8.8 | <.001 | <.001 | 3.29 (1.09, 5.49) |
| Baseline ICINDEX-Symptom (0–20) | 261 | 9.0 +/− 4.6 | 160 | 11.0 +/− 4.6 | <.001 | 0.004 | 1.33 (0.13, 2.53) |
| Baseline ICINDEX-Problem (0–16) | 260 | 7.9 +/− 4.4 | 159 | 9.6 +/− 4.2 | <.001 | 0.005 | 1.24 (0.12, 2.35) |
| AUA Symptom Score Index over the Past Month (0–35) | 262 | 14.0 +/− 7.8 | 162 | 17.8 +/− 9.1 | <.001 | <.001 | 2.81 (0.63, 5.00) |
| BPI Pain Severity Sore (0–10) | 256 | 3.7 +/− 1.9 | 158 | 4.6 +/− 2.0 | <.001 | <.001 | 0.65 (0.14, 1.15) |
| BPI Pain Interference Score (0–10) | 260 | 3.2 +/− 2.5 | 160 | 4.7 +/− 2.9 | <.001 | <.001 | 0.96 (0.29, 1.63) |
| BPI: Reported # of Sites Checked (0–45) | 262 | 3.8 +/− 3.5 | 162 | 9.0 +/− 8.6 | <.001 | <.001 | 3.95 (2.45, 5.46) |
| BPI: % of Sites Checked (out of 45) | 262 | 8.5 +/− 7.8 | 162 | 20.1 +/− 19.1 | <.001 | <.001 | 8.79 (5.44, 12.13) |
| BPI: Reported # of Sites Checked, incl. Gender-Specific (0–49) | 262 | 5.4 +/− 3.8 | 162 | 10.7 +/− 9.0 | <.001 | <.001 | 3.99 (2.40, 5.59) |
| BPI: % of Sites Checked (out of 49), incl. Gender-Specific | 262 | 11.1 +/− 7.7 | 162 | 21.9 +/− 18.3 | <.001 | <.001 | 8.15 (4.90, 11.41) |
| FSFI(Female) (0–36) | 128 | 17.8 +/− 9.9 | 103 | 16.4 +/− 9.9 | 0.283 | 0.863 | −0.23 (−3.58, 3.13) |
| IIEF-6(Male) (0–30) | 132 | 21.4 +/− 9.2 | 59 | 20.5 +/− 9.9 | 0.807 | 0.381 | −1.25 (−4.93, 2.43) |
Values in the table denote the mean(sd) of each symptom by NUAS status. Adjusted p-values and mean differences (β) are adjusted for age, sex, duration of symptoms, and 3-level employment (employed, disabled, or other).
Figure 1. Pain and Urological Symptoms in MAPP Participants with Chronic Urological Pain Syndromes With and Without Non-urological Associated Syndromes.

Whiskers denote the 99% Confidence Interval of the adjusted mean difference of symptom level in standard deviation units
*Denote statistical significance at the 0.01 level. **Denotes significance at the 0.001 level.
SYM-Q: Symptom and Health Care Utilization Questionnaire; GUPI: Genitourinary Pain Index; AUA Symptom Index: American Urological Association Symptom Score Index; IC: Interstitial Cystitis; BPI: Brief Pain Inventory; IIEF – International Index of Erectile Function; FSFI: Female Sexual Function Index.
Individuals with NUAS reported more severe pain, (SYM-Q1 Adj. Mean Diff. =0.63, 99% CI (0.06, 1.20), p=0.005), more interference (Adj. Mean Diff. =0.96 99% CI (0.29, 1.63), p<0.001), and wider pain distribution beyond the pelvis (BPI No. Sites Checked (0–45) Adj. Mean Diff. = 3.95, 99% CI (2.45, 5.46), p<0.001). Patients with NUAS reported greater urinary frequency (Adj. Mean Diff. =0.79, 99% CI (0.10, 1.47), p<0.001, AUA symptom index (Adj. Mean Diff. =2.81, 99% CI (0.63, 5.00), p<0.001) and IC symptom (Adj. Mean Diff. =1.33, 99% CI (0.13, 2.53), p=0.004) and problem assessments (Adj. Mean Diff. =1.24, 99% CI (0.12, 2.35), p=0.005). Quality of life did not significantly differ by NUAS (GUPI QOL Adj. Mean Diff. =0.68, 99% CI (−0.07, 1.42, p=0.020). Urgency and measures of sexual function (FSFI in women and IIEF in men) were similar between patients with or without NUAS (Adj. Mean Diff. =0.42, 99% CI (−0.25, 1.10), p=0.107 urgency; (Adj. Mean Diff.=0.23, 99% CI (−3.58, 3.13), p=0.863 FSFI; Adj. Mean Diff.=−1.25, 99% CI (−4.93, 2.43), p=0.381 IIEF).
Psychological characteristics (Table 4/Figure 2)
Table 4.
Psychological Symptoms of MAPP Participants with Urological Chronic Pelvic Pain by Non-urological Associated Syndrome Criteria
| UCPPS Only (n=262)
|
UCPPS with Syndromes (n=162)
|
Significance
|
|||||
|---|---|---|---|---|---|---|---|
| N | Mean +/− s.d. | N | Mean +/− s.d. | Unadjusted p | Adjusted† p | Adjusted Difference β (99% CI) | |
| SYM-Q7: Baseline Mood (0–10) | 262 | 3.8 +/− 2.1 | 162 | 4.9 +/− 2.3 | <.001 | <.001 | 0.89 (0.33, 1.46) |
| HADS-Anxiety (0–21) | 261 | 6.9 +/− 4.3 | 161 | 8.9 +/− 4.7 | <.001 | <.001 | 1.80 (0.66, 2.94) |
| HADS-Depression (0–21) | 260 | 4.6 +/− 3.7 | 162 | 6.6 +/− 4.6 | <.001 | <.001 | 1.55 (0.50, 2.60) |
| PANAS Positive Affect (5–50) | 261 | 30.9 +/− 7.4 | 161 | 28.1 +/− 7.7 | <.001 | 0.011 | −1.92 (−3.86, 0.02) |
| PANAS Negative Affect (5–50) | 262 | 19.6 +/− 7.2 | 162 | 23.6 +/− 8.8 | <.001 | <.001 | 3.05 (1.08, 5.02) |
| Perceived Stress Scale (PSS)(0–40) | 260 | 14.9 +/− 7.2 | 161 | 19.0 +/− 8.4 | <.001 | <.001 | 3.00 (1.05, 4.94) |
| IPIP:Neuroticism (24–120) | 256 | 60.1 +/− 15.6 | 160 | 67.1 +/− 17.8 | <.001 | <.001 | 5.75 (1.46, 10.03) |
| IPIP:Extraversion (24–120) | 259 | 81.4 +/− 13.9 | 160 | 78.7 +/− 13.6 | 0.050 | 0.218 | −1.76 (−5.43, 1.92) |
| IPIP:Openness (24–120) | 256 | 83.1 +/− 12.7 | 157 | 83.1 +/− 11.9 | 0.984 | 0.619 | −0.65 (−4.00, 2.71) |
| IPIP:Agreeableness (24–120) | 260 | 96.1 +/− 10.1 | 160 | 95.3 +/− 10.4 | 0.416 | 0.091 | −1.68 (−4.24, 0.88) |
| IPIP: Conscientiousness (24–120) | 259 | 97.4 +/− 13.3 | 160 | 94.4 +/− 13.2 | 0.023 | 0.093 | −2.23 (−5.65, 1.18) |
| CSQ: CAT (0–36) | 261 | 11.4 +/− 8.4 | 161 | 14.4 +/− 9.2 | <.001 | 0.068 | 1.56 (−0.64, 3.77) |
| CSQ: Baseline Average Of Questions 1 to 6 (0–6) | 261 | 1.9 +/− 1.4 | 161 | 2.4 +/− 1.5 | <.001 | 0.068 | 0.26 (−0.11, 0.63) |
| CSQ: Ability To Control Pain With Coping (0–6) | 249 | 3.1 +/− 1.5 | 157 | 3.0 +/− 1.4 | 0.984 | 0.977 | 0.00 (−0.37, 0.38) |
| CSQ: Ability To Decrease Pain With Coping (0–6) | 261 | 2.7 +/− 1.5 | 157 | 2.9 +/− 1.3 | 0.357 | 0.158 | 0.20 (−0.17, 0.58) |
Values in the table denote the mean(sd) of each symptom by NUAS status. Adjusted p-values and mean differences (β) are adjusted for age, sex, duration of symptoms, and 3-level employment (employed, disabled, or other).
Figure 2. Psychosocial Factors in MAPP Participants with Chronic Urological Pain Syndromes With and Without Non-urological Associated Syndromes.
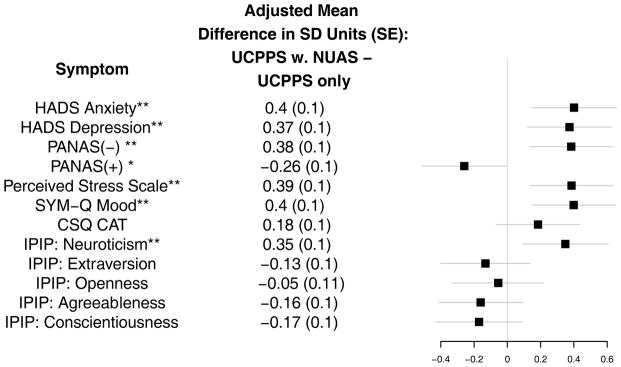
Whiskers denote the 99% Confidence Interval of the adjusted mean difference of symptom level in standard deviation units
*Denote statistical significance at the 0.01 level. **Denotes significance at the 0.001 level.
HADS: Hospital Anxiety and Depression Scale; CSQ: Thoughts About Symptoms Questionnaire; PANAS: Positive and Negative Affect Schedule; IPIP: International Personality Item Pool.
Participants with NUAS reported more anxiety and depression (HADS Anxiety Adj. Mean Diff. =1.80, 99% CI (0.66, 2.94), p <0.001; HADS Depression Adj. Mean Diff. =1.55, 99% CI (0.50, 2.60), p<0.001), more negative affect (Adj. Mean Diff. PANAS Negative =3.05, 99% CI (1.08, 5.02), p<0.001), less positive affect (Adj. Mean Diff. PANAS Positive=−1.92, 99% CI (−3.86, 0.02), p=0.011), greater stress (Adj. Mean Diff. Perceived Stress = 3.00, 99% CI (1.05, 4.94), p=<.001). Personality factors were similar for the two groups, except for greater neuroticism among participants with NUAS (Adj. Mean Diff. IPIP Neuroticism=5.75, 99% CI (1.46, 10.03), p<0.001). Catastrophizing did not differ by NUAS (CSQ:CAT Adj. Mean Diff.=1.56, 99% CI (0.64, 3.77), p=0.068)
RICE criteria (Figure 3)
Figure 3. Pain and Urological Symptoms in RICE-positive vs. RICE-negative MAPP Participants.
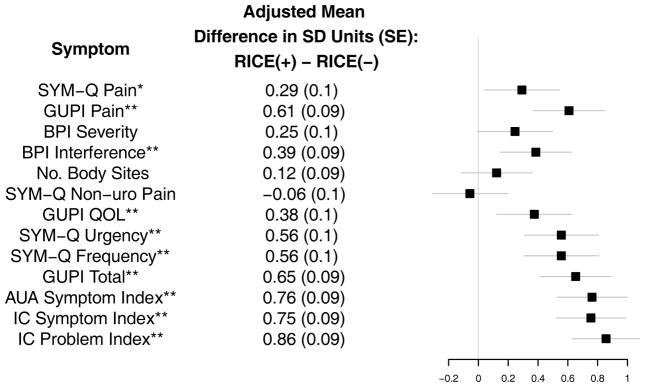
Whiskers denote the 99% Confidence Interval of the adjusted mean difference of symptom level in standard deviation units
*Denote statistical significance at the 0.01 level. **Denotes significance at the 0.001 level.
SYM-Q: Symptom and Health Care Utilization Questionnaire; GUPI: Genitourinary Pain Index; AUA Symptom Index: American Urological Association Symptom Score Index; IC: Interstitial Cystitis; BPI: Brief Pain Inventory.
Of 424 participants, 228 (54%) met RICE criteria. Among 221 RICE-positive participants, 108 (47%) had NUAS compared to 53 (28%) of 203 RICE-negative patients (adjusted OR = 2.31, 99% CI = (1.30, 4.80), p < 0.001). RICE-positive participants had more severe symptoms than RICE-negatives by most measures (Figure 3). Of 233 females, 147 (63%) met RICE criteria compared to 81 (42%) of 191 males (OR = 2.32, 95% CI =(1.36, 3.97), p < 0.001).
Discussion
Baseline data from men and women with UCPPS suggest that NUAS represent an important phenotypic characteristic of urological pain. Our data also support the concept that patients with NUAS may have a more systemic condition, characterized by a decreased quality of life than patients with primarily pelvic symptoms. Of 424 participants, 162 (38%) had NUAS, including 41 (10%) with multiple syndromes. Patients with NUAS were similar in age to patients with UCPPS only at baseline but 4.6 years younger on average at symptom onset. For comparison, rates of NUAS in the general population are approximately 2% for fibromyalgia,[17] up to 3% for chronic fatigue syndrome,[21] and approximately 10.5% for irritable bowel syndrome,[22] with higher rates in women than in men and varying rates depending on study design and the populations evaluated. NUAS were associated with more severe urological symptoms, depression, and anxiety. These findings support the need to compare findings in the MAPP UCPPS population to both “healthy controls” with neither NUAS nor UCPPS, and “positive controls” with NUAS, but without UCPPS.
We evaluated medications because drug therapy represented the most common and reproducible treatment strategy. Of 262 patients with UCPPS only, 183 (70%) were taking prescription medications for their UCPPS. Of 162 patients with NUAS, 124 (77%) were taking medications (not significant after adjustment). There was no difference in the classes of medications used by patients with and without NUAS. These findings suggest that generally similar strategies are used to treat UCPPS. Other strategies such as behavioral changes, physical therapy, etc., will be considered in another manuscript. One important research goal is to improve clinical outcomes by targeting treatments to individual patient phenotypes that are most likely to respond.
Previous researchers noted that IC and CP/CPPS patients commonly reported non-urological symptoms.[11]. Clauw et al found that IC and fibromyalgia have significant overlap in symptoms, demographics, and peripheral nociceptive thresholds.[6] Recent studies showed that IC/PBS or CP/CPPS may be associated with NUAS and mental health comorbidities{Erickson, 2001 #453}{Alagiri, 1997 #454}.[25–29] The pathophysiology underlying the association between UCPPS and NUAS is unclear. [30] Our data documenting the importance of NUAS are generally consistent with other studies. Nickel et al found that female IC/PBS patients who fulfilled Rome III criteria for irritable bowel syndrome reported more severe pain, worse physical quality of life, more depression, stress, and sexual dysfunction, and longer symptom duration than patients who do not have irritable bowel syndrome. [28] Female IC/PBS patients with more than one NUAS had a more severe illness than those with IC/PBS and irritable bowel syndrome only. Our study extends previous studies in the first large epidemiological study that included both men and women with UCPPS. We incorporated more rigorous NUAS assessment than previous reports by identifying suggestive symptoms on the Complex Multi-Symptom Inventory [15] triggering application of the NUAS diagnostic criteria.[16–18]
Among 233 females, 103 (44%) had NUAS compared to 59 (38%) of 191 males (OR = 1.76, 99% CI (1.03, 3.08) p=0.005). Although females with NUAS reported slightly worse sexual function than females without NUAS, this difference was not significant. Males with and without NUAS reported similar sexual function. These observations suggest that future studies of UCPPS should stratify outcomes by gender to limit potential confounding of important differences. It will also be important to compare UCPPS patients with NUAS to subjects who have NUAS but who do not have UCPPS, and this will the subject of future MAPP investigations.
Because the RICE definition represents the best-validated epidemiological criterion for IC/PBS, we evaluated these criteria in the MAPP population. RICE criteria had relatively low sensitivity (54%); however, RICE-positive participants were more likely to have NUAS (Adjusted OR 2.31, 99% CI (1.30, 4.08), p < 0.001) and more severe urological symptoms than RICE-negative participants. RICE criteria were developed and validated for IC/PBS, a condition more prevalent in women. Thus, it is not surprising that RICE criteria were more prevalent (62%) in female than in male participants (40%, OR 2.32 99% CI (1.39, 3.89), p < 0.0001).
Our observations support the suggestion that UCPPS patients represent a heterogeneous population, with some patients having a more “localized syndrome,” with urologic symptoms only, and others having a more “systemic syndrome,” with symptoms in other body areas. Studies are needed to determine the precise mechanisms of pain in these different patient types. Because MAPP patients were recruited from referral centers it will be important to determine how closely our findings correspond to UCPPS in less selected populations. Determining the presence (and perhaps number) of NUAS may represent a useful clinical approach to distinguish these two populations.
In summary, our data suggest that NUAS represent an important phenotypic characteristic of UCPPS and that urological patients with NUAS may have a more systemic condition. Because gender represents another important phenotypic characteristic, future studies of UCPPS should characterize outcomes separately for males and females to describe clinical differences that may prove important in only one gender.
Footnotes
Registration Number and Registry Name: ClinicalTrials.gov identifier: NCT01098279 “Chronic Pelvic Pain Study of Individuals with Diagnoses or Symptoms of Interstitial Cystitis and/or Chronic Prostatitis (MAPP-EP)”
References
- 1.Berry SH, Bogart LM, Pham C, et al. Development, validation and testing of an epidemiological case definition of interstitial cystitis/painful bladder syndrome. The Journal of urology. 2010;183:1848. doi: 10.1016/j.juro.2009.12.103. [DOI] [PMC free article] [PubMed] [Google Scholar]
- 2.Kusek JW, Nyberg LM. The epidemiology of interstitial cystitis: is it time to expand our definition? Urology. 2001;57(6 Suppl 1):95. doi: 10.1016/s0090-4295(01)01141-4. [DOI] [PubMed] [Google Scholar]
- 3.Landis JR, Williams DA, Lucia MS, et al. The MAPP research network: design, patient characterization and operations. BMC urology. 2014;14:58. doi: 10.1186/1471-2490-14-58. [DOI] [PMC free article] [PubMed] [Google Scholar]
- 4.Krieger JN, Nyberg L, Jr, Nickel JC. NIH consensus definition and classification of prostatitis. JAMA: the journal of the American Medical Association. 1999;282:236. doi: 10.1001/jama.282.3.236. [DOI] [PubMed] [Google Scholar]
- 5.Hanno PM, Burks DA, Clemens JQ, et al. AUA guideline for the diagnosis and treatment of interstitial cystitis/bladder pain syndrome. The Journal of urology. 2011;185:2162. doi: 10.1016/j.juro.2011.03.064. [DOI] [PMC free article] [PubMed] [Google Scholar]
- 6.Clauw DJ, Schmidt M, Radulovic D, et al. The relationship between fibromyalgia and interstitial cystitis. Journal of psychiatric research. 1997;31:125. doi: 10.1016/s0022-3956(96)00051-9. [DOI] [PubMed] [Google Scholar]
- 7.Aaron LA, Herrell R, Ashton S, et al. Comorbid clinical conditions in chronic fatigue: a co-twin control study. Journal of general internal medicine. 2001;16:24. doi: 10.1111/j.1525-1497.2001.03419.x. [DOI] [PMC free article] [PubMed] [Google Scholar]
- 8.Whitehead WE, Palsson O, Jones KR. Systematic review of the comorbidity of irritable bowel syndrome with other disorders: what are the causes and implications? Gastroenterology. 2002;122:1140. doi: 10.1053/gast.2002.32392. [DOI] [PubMed] [Google Scholar]
- 9.Wu EQ, Birnbaum H, Mareva M, et al. Interstitial Cystitis: Cost, treatment and co-morbidities in an employed population. Pharmaco Economics. 2006;24:55. doi: 10.2165/00019053-200624010-00005. [DOI] [PubMed] [Google Scholar]
- 10.Rodriguez MA, Afari N, Buchwald DS. Evidence for overlap between urological and nonurological unexplained clinical conditions. The Journal of urology. 2009;182:2123. doi: 10.1016/j.juro.2009.07.036. [DOI] [PMC free article] [PubMed] [Google Scholar]
- 11.Samplaski MK, Li J, Shoskes DA. Clustering of UPOINT domains and subdomains in men with chronic prostatitis/chronic pelvic pain syndrome and contribution to symptom severity. The Journal of urology. 2012;188:1788. doi: 10.1016/j.juro.2012.07.036. [DOI] [PubMed] [Google Scholar]
- 12.Forrest JB, Schmidt S. Interstitial cystitis, chronic nonbacterial prostatitis and chronic pelvic pain syndrome in men: a common and frequently identical clinical entity. The Journal of urology. 2004;172(6 Pt 2):2561. doi: 10.1097/01.ju.0000145102.40773.43. [DOI] [PubMed] [Google Scholar]
- 13.Clemens JQ, Elliott MN, Suttorp M, et al. Temporal ordering of interstitial cystitis/bladder pain syndrome and non-bladder conditions. Urology. 2012;80:1227. doi: 10.1016/j.urology.2012.06.059. [DOI] [PMC free article] [PubMed] [Google Scholar]
- 14.Clemens JQ, Mullins C, Kusek JW, et al. The MAPP research network: a novel study of urologic chronic pelvic pain syndromes. BMC urology. 2014;14:57. doi: 10.1186/1471-2490-14-57. [DOI] [PMC free article] [PubMed] [Google Scholar]
- 15.Williams DA, Schilling S. Advances in the assessment of fibromyalgia. Rheum Dis Clin North Am. 2009;35:339. doi: 10.1016/j.rdc.2009.05.007. [DOI] [PMC free article] [PubMed] [Google Scholar]
- 16.Longstreth GF, Thompson WG, Chey WD, et al. Functional bowel disorders. Gastroenterology. 2006;130:1480. doi: 10.1053/j.gastro.2005.11.061. [DOI] [PubMed] [Google Scholar]
- 17.Wolfe F, Clauw DJ, Fitzcharles MA, et al. The American College of Rheumatology preliminary diagnostic criteria for fibromyalgia and measurement of symptom severity. Arthritis care & research. 2010;62:600. doi: 10.1002/acr.20140. [DOI] [PubMed] [Google Scholar]
- 18.Fukuda K, Straus SE, Hickie I, et al. The chronic fatigue syndrome: a comprehensive approach to its definition and study. International Chronic Fatigue Syndrome Study Group Annals of internal medicine. 1994;121:953. doi: 10.7326/0003-4819-121-12-199412150-00009. [DOI] [PubMed] [Google Scholar]
- 19.Berry SH, Elliott MN, Suttorp M, et al. Prevalence of symptoms of bladder pain syndrome/interstitial cystitis among adult females in the United States. The Journal of urology. 2011;186:540. doi: 10.1016/j.juro.2011.03.132. [DOI] [PMC free article] [PubMed] [Google Scholar]
- 20.Konkle KS, Berry SH, Elliott MN, et al. Comparison of an interstitial cystitis/bladder pain syndrome clinical cohort with symptomatic community women from the RAND Interstitial Cystitis Epidemiology study. The Journal of urology. 2012;187:508. doi: 10.1016/j.juro.2011.10.040. [DOI] [PMC free article] [PubMed] [Google Scholar]
- 21.Steele L, Dobbins JG, Fukuda K, et al. The epidemiology of chronic fatigue in San Francisco. The American journal of medicine. 1998;105:83S. doi: 10.1016/s0002-9343(98)00158-2. [DOI] [PubMed] [Google Scholar]
- 22.Wilson S, Roberts L, Roalfe A, et al. Prevalence of irritable bowel syndrome: a community survey. The British journal of general practice: the journal of the Royal College of General Practitioners. 2004;54:495. [PMC free article] [PubMed] [Google Scholar]
- 23.Erickson DR, Morgan KC, Ordille S, et al. Nonbladder related symptoms in patients with interstitial cystitis. The Journal of urology. 2001;166:557. [PubMed] [Google Scholar]
- 24.Alagiri M, Chottiner S, Ratner V, et al. Interstitial cystitis: unexplained associations with other chronic disease and pain syndromes. Urology. 1997;49(5A Suppl):52. doi: 10.1016/s0090-4295(99)80332-x. [DOI] [PubMed] [Google Scholar]
- 25.Clemens JQ, Brown SO, Calhoun EA. Mental health diagnoses in patients with interstitial cystitis/painful bladder syndrome and chronic prostatitis/chronic pelvic pain syndrome: a case/control study. The Journal of urology. 2008;180:1378. doi: 10.1016/j.juro.2008.06.032. [DOI] [PMC free article] [PubMed] [Google Scholar]
- 26.Clemens JQ, Meenan RT, O’Keeffe Rosetti MC, et al. Case-control study of medical comorbidities in women with interstitial cystitis. The Journal of urology. 2008;179:2222. doi: 10.1016/j.juro.2008.01.172. [DOI] [PubMed] [Google Scholar]
- 27.Warren JW, Howard FM, Cross RK, et al. Antecedent nonbladder syndromes in case-control study of interstitial cystitis/painful bladder syndrome. Urology. 2009;73:52. doi: 10.1016/j.urology.2008.06.031. [DOI] [PubMed] [Google Scholar]
- 28.Nickel JC, Tripp DA, Pontari M, et al. Interstitial cystitis/painful bladder syndrome and associated medical conditions with an emphasis on irritable bowel syndrome, fibromyalgia and chronic fatigue syndrome. The Journal of urology. 2010;184:1358. doi: 10.1016/j.juro.2010.06.005. [DOI] [PubMed] [Google Scholar]
- 29.Nickel JC, Tripp DA, Pontari M, et al. Psychosocial phenotyping in women with interstitial cystitis/painful bladder syndrome: a case control study. The Journal of urology. 2010;183:167. doi: 10.1016/j.juro.2009.08.133. [DOI] [PubMed] [Google Scholar]
- 30.Warren JW, van de Merwe JP, Nickel JC. Interstitial cystitis/bladder pain syndrome and nonbladder syndromes: facts and hypotheses. Urology. 2011;78:727. doi: 10.1016/j.urology.2011.06.014. [DOI] [PubMed] [Google Scholar]