Abstract
This paper is focused on investigating force regulation strategies employed by human central nervous system (CNS). The mechanism responsible for force control is extremely important in people’s lives, but not yet well understood. We formulate the general model of force regulation and identify several possible control strategies. An experimental approach is used to determine which of the force control strategies could actually be used by the CNS. Obtained results suggest that the force regulation process involves not only the pure force controller, but also a coupled motion controller, relying on the internal model of the environment.
I. Introduction
One’s ability to manipulate fragile objects, to assemble and disassemble parts and to otherwise exert controlled forces and motions at the same time is very important in everyday life. The lives of people with motor impairments are adversely affected by the loss or reduction of this ability. However, the underlying control mechanism of such ability is poorly understood.
Latest investigations have suggested the presence in the motor control system of separate modules for the control of motions and forces, consistent with electrophysiological findings on neural activities in primates’ motor and parietal cortex [1]–[5]. The majority of studies of the human motor control system are focused on how the movements our limbs and bodies are produced. Many manipulations we encounter everyday, however, deal not only with the execution of movements, but also the production of well controlled contact forces. A typical example of such manipulation is writing on a chalkboard. To successfully complete such task one needs to apply an appropriate amount of contact force against the board. Applying too much force would result in breaking the piece of chalk, whereas too little force would not produce a trace on the board. The dual nature of force and position control has been recognized in the field of robot control and exploited in hybrid position/force control schemes [6]–[9]. It has been observed that the concept of optimal impedance plays an important role in control and stabilization of unstable dynamics by the central nervous system [10]. Recent research also indicates the existence of separate neural control mechanisms of hand movements and contact forces [11].
In this work these investigations are expanded toward a deeper understanding of the human ability to concurrently control arm motions and contact forces.
II. Force Regulation Strategies
The goal of force control system is to produce a certain amount of contact force in a certain direction with particular time constraints. In other words, an ideal force controller is the one which produces the force
| (1) |
where F(t) is the force produced by the controller at time instance t and Fref(t) is the reference force signal.
If we limit ourselves to the problem of force regulation where Fref = const, as opposed to general force control1, then in order to satisfy the condition in Eq. (1) perfectly, an obvious solution from a purely engineering point of view would be to ensure that the mechanical impedance satisifies the condition
| (2) |
where q is a vector of generalized coordinates, e.g. joint angles. It is known from experiments, however, that the muscle stiffness increases with muscle activation [12], [13]. A zero mechanical impedance of a muscle can never be achieved in practice. This is particularly for higher levels of applied force. To understand how this apparent contradiction with the condition in Eq. (2) could be resolved by the central nervous system, let us formulate a general model of force regulation task.
Consider the interaction between the human arm and some predictable dynamic environment:
| (3) |
| (4) |
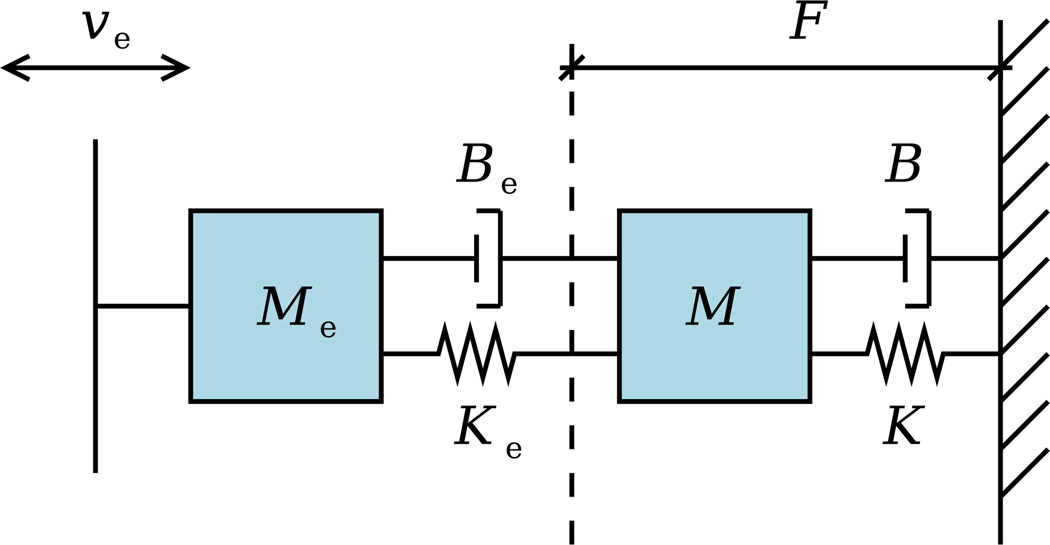
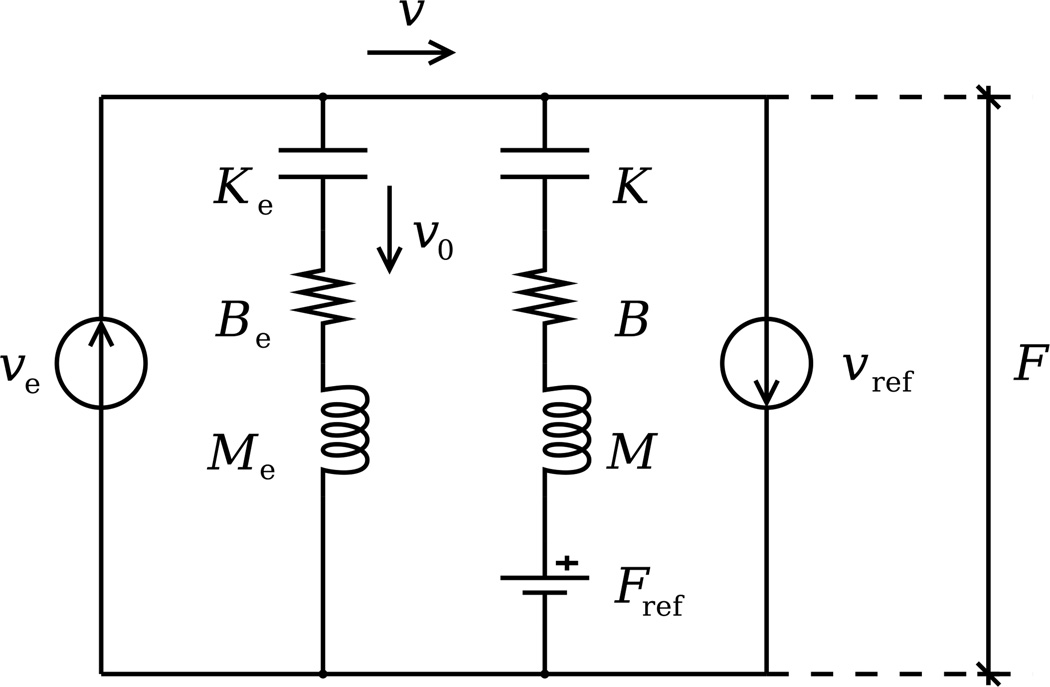
where M and Me are the inertia matrices, B and Be – damping matrices, K and Ke – stiffness matrices, J(q) and Je(q) – Jacobians of the arm and dynamic environment, respectively, u(t) is the output of the neuromuscular control system, and F(t) is the contact force. Mechanical system corresponding to Eqs. (3) and (4) for a simple one-dimensional case is presented in the form of a diagram in Fig. 1. Since the environment is predictable, its kinematic characteristics such as its velocity υe are assumed to be known. To analyze the system we can transform the mechanical diagram into an electrical diagram describing essentially the same system (Fig. 2). This transformation is possible due to equivalence between the mechanical and electrical parameters made possible by a high degree of similarity between mathematical equations describing mechanical and electrical processes. In particular, inertia is equivalent to inductance, viscosity is equivalent to resistance, and elasticity is equivalent to capacitance. Velocity of motion can be represented by electric current, whereas applied force is equivalent to voltage. Such transformation is motivated by two reasons: it provides an additional and, possibly, better way to visualize the mechanical system and, most importantly, it facilitates our analysis of the original system by allowing us to use a wide range of tools developed for electrical system analysis.
Fig. 1.
Mechanical diagram of the interaction between the human arm and a predictable dynamic environment: {M, B, K} and {Me, Be, Ke} are the inertia, damping and stiffness of the arm and the environment, respectively; υe is the velocity of the environment; F is the interaction force.
Fig. 2.
Equivalent electrical diagram for the mechanical system presented in Fig. 1: υref and Fref are the reference values of velocity and force imposed by the central nervous system, υ is the actual velocity at the interaction point, υ0 is the small “leakage” velocity.
In our system the velocity υe of the environment is represented by a current source. Similarly, a current source is used to represent the reference velocity υref imposed by the controller in the central nervous system. This quantity may also be referred to as the motion plan. The reference force Fref, also imposed by the central nervous system, is represented by a voltage source. The actual force F and the actual velocity υ at the point of interaction between the arm and the environment is measured as voltage. The velocity υ0, typically small, is the “leakage” velocity introduced due to compliance of the environment. For example, in the case of a human arm interacting with a robotic manipulator, the velocity υ of the point of contact between the arm and the environment is never precisely equal in practice to the velocity υe imposed by the robot due to mechanical compliance attributed to the structural characteristics of the robot.
Complex impedances Z of the arm and Ze of the environment can be obtained as
| (5) |
| (6) |
where ω is the radial frequency of the motion and j is the imaginary unit.
Applying Thévenin’s theorem for electrical circuits [14] and using the expressions for complex impedances from Eqs. (5) and (6), we get
| (7) |
Here the quantities Ze and υe are the properties of the environment, whereas the quantities Z, υref and Fref are parameters that can vary. Analysis of Eq. (7) allows us to see different force regulation strategies to achieve the goal of F = Fref.
Force control. One option is to decrease arm impedance Z to a very low value. Consider the case of Z → 0. Then Eq. (7) yields F → Fref.
Position control. Another option is to increase the arm impedance Z to a very high value and to set the motion plan to υref = υe. In this case the arm is controlled to compensate the motion of the environment completely. Here Z → ∞, which leads to υ → υref − υ0, which in turn leads to F → Fref.
Impedance control [15]. In this case the impedance Z is set to a particular value as a function of environmental velocity υe and reference force Fref: .
Hybrid approaches. An example of such approach would be a position control approach, where the arm is controlled to partially compensate the motion of the environment.
To determine which of these control strategies are used by the human central nervous system, an experimental approach is used. Below is the description of the conducted human studies and their results.
III. Methods
A. Participants
The pool of participants consisted of 10 volunteers, 7 male and 3 female between the ages of 21 and 36. The median age of participants was 27.5. Every participant reported a normal or corrected to normal vision, a normal sense of touch and no known history of neurological disorders. All participants were right-handed. Everyone who took part in the experiment was informed about its purpose, procedure, benefits, possible risks and their rights as subjects. Written consent was obtained from all participants. The experiment was approved by the Institutional Review Board of the Northwestern University.
B. Apparatus
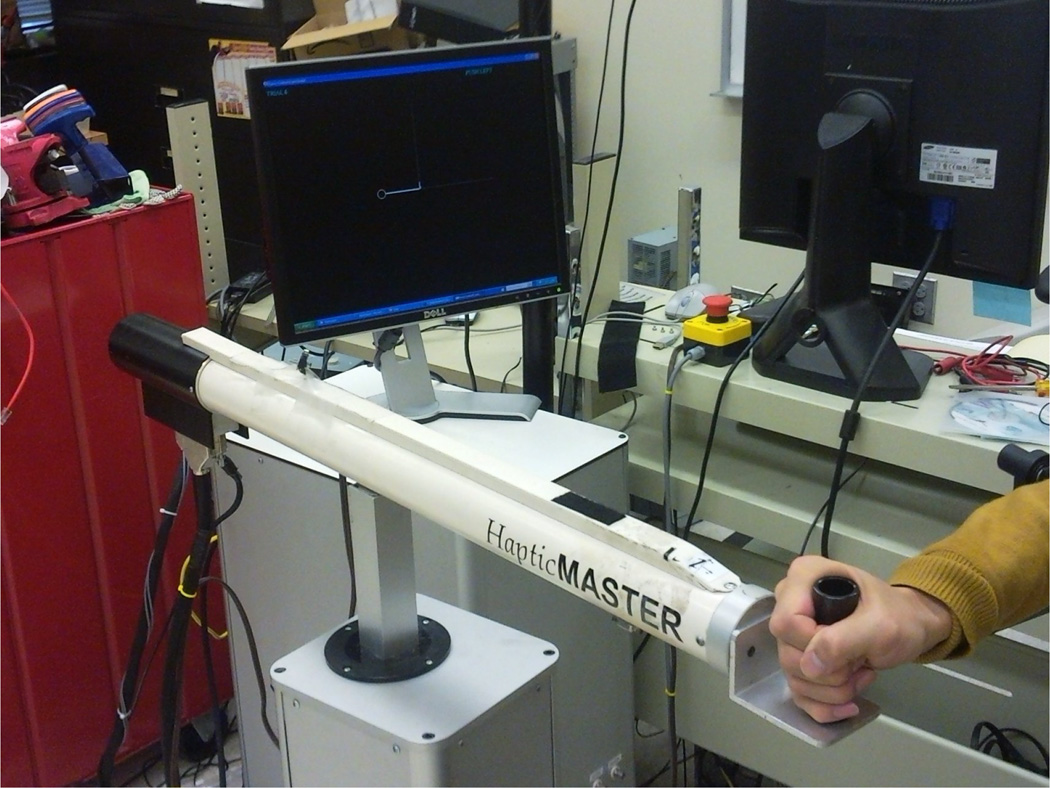
Visual information was displayed on a Dell 1907FPc 19” LCD monitor (Dell Inc., Round Rock, TX) placed approximately 110 cm from the user. Haptic guidance was presented via a HapticMaster robotic manipulator (FCS Control Systems, Netherlands) [16] placed in front of the subjects. Participants were asked to hold the handle of the manipulator with their dominant arm and to place their elbow on an armrest. The height of the armrest was adjusted for each subject individually, so that the shoulder, elbow and wrist joints were situated in a horizontal plane. Fig. 3 depicts the experimental setup.
Fig. 3.
Experimental setup.
The software used for this experiment was developed in C++ using proprietary HapticMaster API (FCS Control Systems). Visual feedback presented to the user was developed in OpenGL API (Khronos Group, Beaverton, OR) and incorporated into the experimental software.
C. Experimental Task
The following axis convention was used in this study: the x-axis runs toward the participant, the y-axis runs from participant’s left to his/her right, the z-axis runs from the bottom to the top. The experimental task in this study was essentially planar, so z = 0 is assumed throughout this paper.
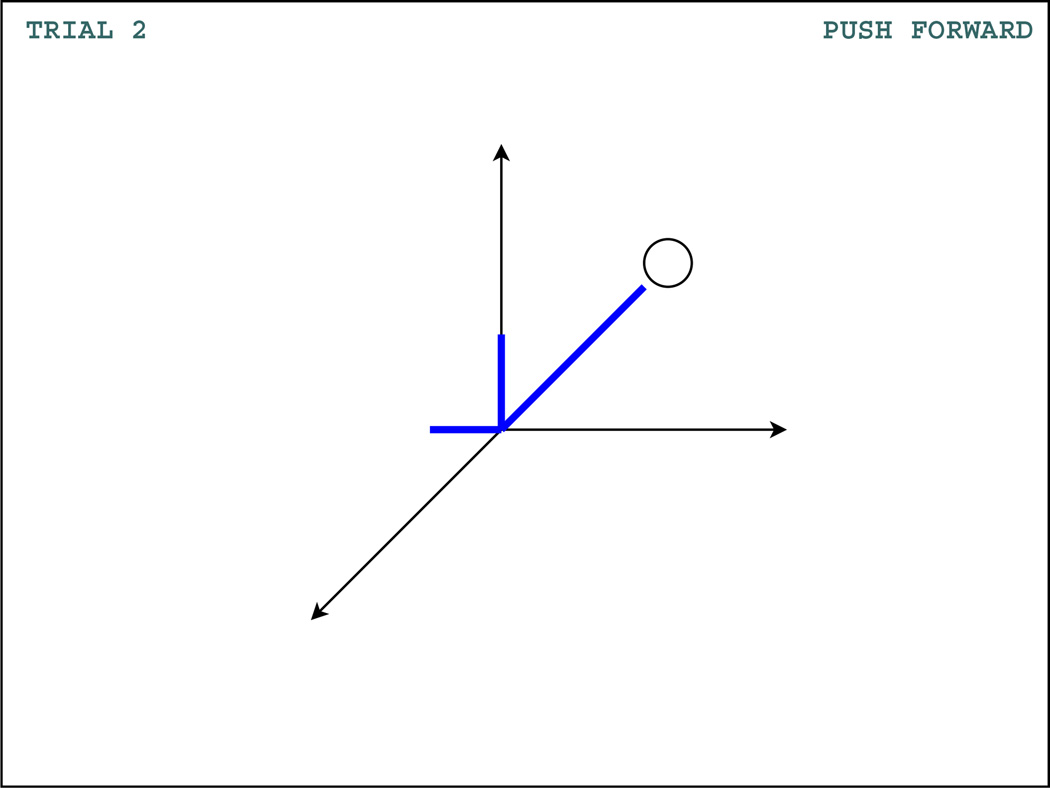
The task chosen for this experiment was to produce an isometric force of Fref = 10 N at the handle of the robotic manipulator in the four principal Cartesian directions in the horizontal plane. Three-dimensional graphic feedback of the applied force was always provided to the subject. The position of the handle was not displayed to the subject. Fig. 4 depicts the user’s view of the computer monitor.
Fig. 4.
Visual feedback presented to the user.
Each participant was first introduced to the device and verbally instructed on the experimental task.
In the first part of a trial the handle was stationary and the user simply had to match the produced force with the reference force Fref represented by a circular target on the screen within a threshold δ, i.e. to produce the force F ∈ (Fref − δ, Fref + δ). The force components along the other two axes had to stay in the interval (−δ, δ). The threshold parameter was chosen as δ = 0.1Fref. When the forces in all three directions were within their respective thresholds, the force cursor changed its color to green. When the subject was able to successfully maintain the target force while satisfying these conditions for 5 seconds, the second part of the trial commenced. In this part the handle of the manipulator was being moved sinusoidally about the center position along either x- or y-axis with the amplitude of 10 cm and frequency of 0.125 Hz for 25 cycles. The subject was asked to maintain the same reference force while the movement was under way. Position perturbations of amplitude of 8 mm and duration of 300 ms were applied twice per movement cycle at the points of zero acceleration. A short transition phase of 100 ms was implemented at the start and the end of every perturbation. It was realized by using as servo command a sixth-order polynomial constrained by zero velocity and zero acceleration at both boundaries and zero end jerk [17]. The direction of each perturbation was randomly chosen from the set . In total there were 50 perturbations encountered by each participant during every trial. Most participants were not aware of the existence of these perturbations due to their low amplitude and extremely short duration. Others who were aware of it tended to attribute their effect to “imperfections” of the equipment. Each subject completed NT = 8 trials consisting of all possible combinations of four planar principal directions of force production and two axes of periodic motion.
IV. Data Analysis
Force and motion data were collected at a rate of 250 Hz. Each task performance trial was analyzed individually offline and the average absolute force error ek during kth movement cycle was computed as
| (8) |
where N is the number of data points collected during the kth cycle, not including the set of data points P collected when random perturbations were applied. Note that this error always satisfies ek ≥ 0 with equality if and only if the actual and desired force trajectories coincide, i.e. F(n) = Fref(n) ∀n ∈ N.
To obtain a more stable stiffness measure movement cycles are divided into windows of size Nw = 10. There are 25 − (Nw −1) such windows in total. Force error measure Ei on ith window is computed as
| (9) |
Effectiveness of training is assessed by computing the skill gain G for each trial as a difference between the force error measures of the last and first window:
| (10) |
Positive skill gain indicates improvement in the subject’s performance during the trial whereas negative skill gain indicates decline in performance. The greater the difference between the force error measures of the last and first windows, the higher the skill gain and the greater the effectiveness of training for that particular subject.
Two kinds of force error are considered: the force error in the direction of motion (DoM) and the force error in the direction of applied force (DoF). For some trials these two directions would coincide. If the two directions are not the same, then to calculate the skill gain for the direction of motion according to Eqs. (8)–(10) we assume that Fref = 0. We denote the two kinds of skill gain values by GM and GF.
Linear regression is used to estimate the endpoint stiffness matrix [18] using the expression
| (11) |
for Kyx (and analogous expressions to determine the components Kxx, Kxy and Kyy), where ΔFy and Δx are differences in force along y-axis and position along x-axis respectively. These differences are computed at the plateau phase of the perturbation as
| (12) |
| (13) |
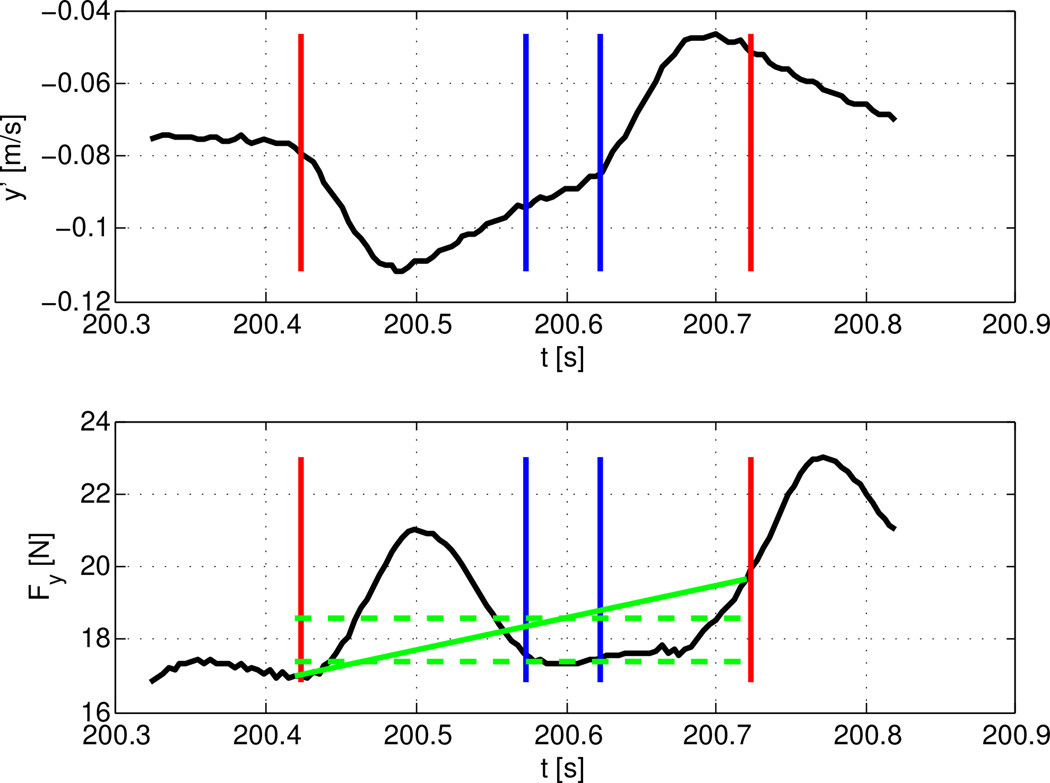
where a bar is used to denote the average value of the parameter at the plateau phase of the perturbation over the time interval of [150, 200] ms after the perturbation onset, and the subscript “0” is used to denote the predicted values of the parameter in the absence of the perturbation. The latter predicted values are computed using the linear interpolation of the dataset between the onset and offset of the perturbation (Fig. 5).
Fig. 5.
Perturbation response analysis: velocity (top) and applied force (bottom) along the y-axis. Red lines indicate the onset and offset of the perturbation, blue lines indicate the onset and offset of the plateau period used in stiffness estimation, solid green line indicates the predicted value of the force in the absence of the perturbation, dashed green lines indicate the force values Fy0 (top line) and F̅y (bottom line) in Eq. (12).
Out of four components of the stiffness matrix two are of particular interest for our analysis: the first one is the component relating the displacement in the DoM to the force in the DoM. We call this component stiffness in the DoM (KM). The second is the component relating the displacement in the DoM to the force in the DoF. We call this component stiffness in the DoF (KF). If in some trial the two directions coincide, then KM = KF in such case.
Stiffness modulation is assessed by calculating for each trial the difference between the stiffness estimates of the last and first window:
| (14) |
This computation is performed for stiffness estimates in both the DoM and the DoF yielding the values of ΔKM and ΔKF.
To determine the relationship between each skill gain value and the corresponding change in stiffness a simple correlation metric was used which took into account only the sign of each variable:
| (15) |
where Gi and ΔKi denote the skill gain and stiffness modulation during the ith trial. Observe that −1 ≤ R ≤ 1 in all cases. The choice of this particular correlation metric in favor of a linear correlation or other popular correlation metrics is motivated by an unknown and clearly nonlinear nature of the relationship between the two variables.
V. Results
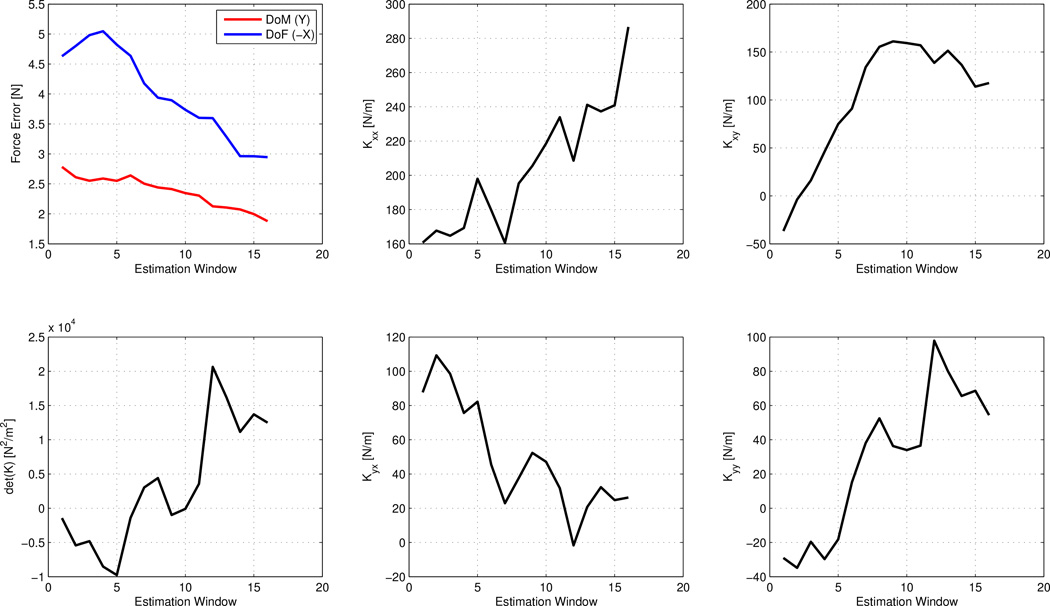
Evolution of force error in the DoM and the DoF throughout a trial for one of the subjects is shown in Fig. 6 (top left). In this case both errors decreased as the training progressed. Evolution of the overall stiffness magnitude expressed by det K [19] and the individual stiffness components is also presented in Fig. 6.
Fig. 6.
Evolution of observed and estimated parameters throughout a sample trial. Top left: average force error, bottom left: stiffness magnitude, remaining plots: individual components of the stiffness matrix.
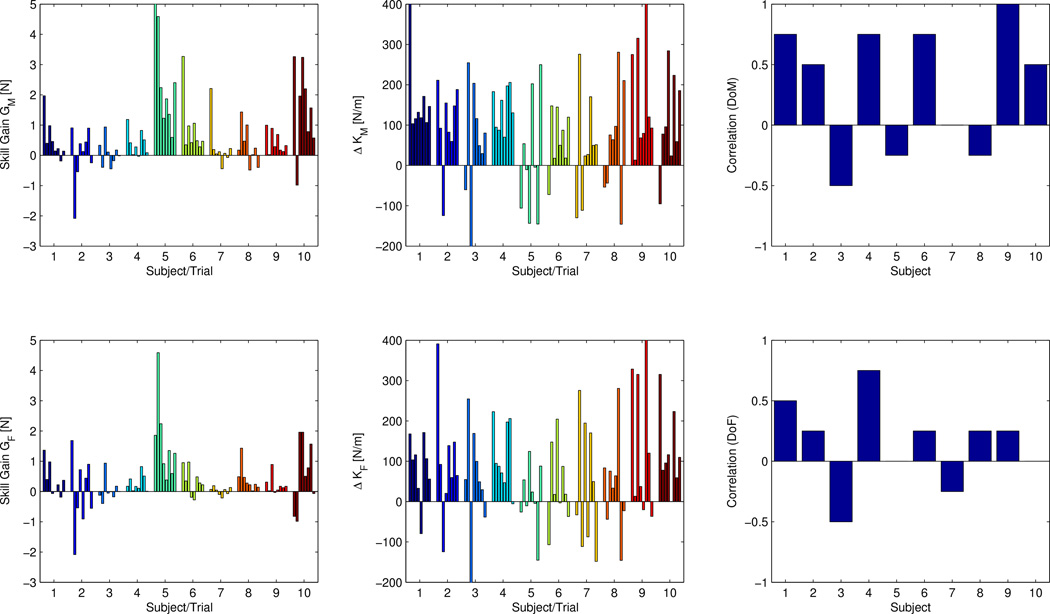
Values of skill gain and stiffness changes for all subjects and all trials are shown in Fig. 7 (left and center columns). The effectiveness of training was assessed using a two-factor repeated-measures analysis of variance (ANOVA) [20] technique with the two factors being the start/end of a training trial and the trial number. ANOVA test revealed a significant difference between the force error at the start and the end of a training trial in both the DoM (F(1, 63) = 5.75, p = 0.040) and the DoF (F(1, 63) = 6.49, p = 0.031) indicating that the learning during a typical training trial was effective. The trial number was also a significant factor in the evolution of the force error (p ≪ 0.001 in both directions) as the improvement was the more substantial in earlier trials when the subject was less familiar with the task.
Fig. 7.
Skill gain (left column), change in endpoint stiffness (center column) and the correlation between them (right column) for each subject. Both the direction of motion (top row) and the direction of applied force (bottom row) are analyzed.
Analysis of stiffness changes suggests that stiffness significantly increased between the start and the end of a training trial in both the DoM (F(1, 63) = 25.0, p < 0.001) and the DoF (F(1, 63) = 23.9, p < 0.001). As in the previous case, trial number was also a significant factor in stiffness modulation (p ≪ 0.001 in both directions).
Correlation coefficients for every subject computed according to Eq. (15) are presented in Fig. 7 (right column). The majority of subjects exhibited positive correlation between their skill gains and changes in stiffness during training trials. Mean values of correlation coefficients over the entire subject population were found to be positive (0.325 and 0.150 for the DoM and the DoF respectively).
VI. Conclusion
Obtained results indicate that during force regulation in predictable environments mechanical impedance increases while force production becomes more stable and the error in applied force decreases. This finding contradicts the intuitive solution described by Eq. (2) which suggests that the impedance of a mechanical system decreases as its force production improves. On the other hand, this finding is compatible with the idea that the force regulation process employed by the central nervous system involves not only the pure force controller described by Eq. (2), but also a coupled motion controller. As adaptation to the environment progresses, internal model [21] of the environment develops. This model provides the estimates of the kinematic parameters of the environment which drive the coupled motion controller to provide increasingly more accurate feedforward compensation.
Acknowledgments
This work was supported by NINDS grant 2R01NS035673.
Footnotes
The goal of regulation problem is to drive the controlled variable to a constant reference value, whereas control is a more general problem of following an arbitrary reference signal.
Contributor Information
Maxim Kolesnikov, Email: max@motivps.com, Sensory Motor Performance Program, Rehabilitation Institute of Chicago, 345 E. Superior St., Chicago, IL 60611, USA.
Davide Piovesan, Email: d-piovesan@northwestern.edu, Sensory Motor Performance, Program, Rehabilitation Institute of Chicago, 345 E. Superior St., Chicago, IL 60611, USA.
Kevin M. Lynch, Email: kmlynch@northwestern.edu, Department of Mechanical Engineering, Northwestern University, 2145 Sheridan Rd., Evanston, IL 60208, USA.
Ferdinando A. Mussa-Ivaldi, Email: sandro@northwestern.edu, Sensory Motor Performance Program, Rehabilitation Institute of Chicago, 345 E. Superior St., Chicago, IL 60611, USA.
References
- 1.Buneo CA, Andersen RA. The posterior parietal cortex: Sensorimotor interface for the planning and online control of visually guided movements. Neuropsychologia. 2006;44:2594–2606. doi: 10.1016/j.neuropsychologia.2005.10.011. [DOI] [PubMed] [Google Scholar]
- 2.Georgopoulos AP, Ashe J, Smyrnis N, Taira M. The motor cortex and the coding of force. Science. 1992;256:1692–1695. doi: 10.1126/science.256.5064.1692. [DOI] [PubMed] [Google Scholar]
- 3.Sergio LF, Kalaska JF. Changes in the temporal pattern of primary motor cortex activity in a directional isometric force versus limb movement task. Journal of Neurophysiology. 1998;80:1577–1583. doi: 10.1152/jn.1998.80.3.1577. [DOI] [PubMed] [Google Scholar]
- 4.Hamel-Paquet K, Sergio LF, Kalaska JF. Parietal area 5 activity does not reflect the differential time-course of motor output kinetics during arm-reaching and isometric-force tasks. Journal of Neurophysiology. 2006;95:3353–3370. doi: 10.1152/jn.00789.2005. [DOI] [PubMed] [Google Scholar]
- 5.Torres E, Andersen RA. Space-time separation during obstacle-avoidance learning in monkeys. Journal of Neurophysiology. 2006;96:2613–2632. doi: 10.1152/jn.00188.2006. [DOI] [PubMed] [Google Scholar]
- 6.Raibert MH, Craig JJ. Hybrid position/force control of manipulators. ASME Journal of Dynamic Systems, Measurement and Control. 1981;103:126–133. [Google Scholar]
- 7.Hogan N. Impedance control: An approach to manipulation. Parts I, II, III. ASME Journal of Dynamic Systems, Measurement and Control. 1985;107:1–24. [Google Scholar]
- 8.Mason M. Mechanics and planning of manipulator pushing operations. International Journal of Robotics Research. 1986;5:53–71. [Google Scholar]
- 9.Yoshikawa T. Dynamic hybrid position/force control of robot manipulators – description of hand constraints and calculation of joint driving force. IEEE Journal of Robotics and Automation. 1987;3:386–392. [Google Scholar]
- 10.Burdet E, Osu R, Franklin DW, Milner TE, Kawato M. The central nervous system stabilizes unstable dynamics by learning optimal impedance. Nature. 2001;414:446–449. doi: 10.1038/35106566. [DOI] [PubMed] [Google Scholar]
- 11.Chib VS, Krutky MA, Lynch KM, Mussa-Ivaldi FA. The separate neural control of hand movements and contact forces. Journal of Neuroscience. 2009;29:3939–3947. doi: 10.1523/JNEUROSCI.5856-08.2009. [DOI] [PMC free article] [PubMed] [Google Scholar]
- 12.Sandercock TG, Lin DC, Rymer WZ. Muscle models. In: Arbib MA, editor. The Handbook of Brain Theory and Neural Networks. 2nd ed. Massachusetts Institute of Technology; 2003. pp. 711–715. [Google Scholar]
- 13.Monroy JA, Lappin AK, Nishikawa KC. Elastic properties of active muscle - on the rebound? Exercise & Sport Sciences Reviews. 2007;35(4):174–179. doi: 10.1097/jes.0b013e318156e0e6. [DOI] [PubMed] [Google Scholar]
- 14.Johnson DH. Equivalent circuit concept: The voltage-source equivalent. Proceedings of the IEEE. 2003;91(4):636–640. [Google Scholar]
- 15.Hogan N. Impedance control of industrial robots. Robotics and Computer-Integrated Manufacturing. 1984;1(1):97–113. [Google Scholar]
- 16.Van der Linde RQ, Lammertse P. HapticMaster – a generic force controlled robot for human interaction. The Industrial Robot. 2003;30(6):515–524. [Google Scholar]
- 17.Burdet E, Osu R, Franklin DW, Milner TE, Kawato M. ASME Annual Symposium on Haptic Interfaces and Virtual Environments for Teleoperator Systems. Nashville, TN: 1999. Measuring stiffness during arm movements in various dynamic environments; pp. 421–428. [Google Scholar]
- 18.Burdet E, Osu R, Franklin DW, Yoshioka T, Milner TE, Kawato M. A method for measuring endpoint stiffness during multijoint arm movements. Journal of Biomechanics. 2000;33:1705–1709. doi: 10.1016/s0021-9290(00)00142-1. [DOI] [PubMed] [Google Scholar]
- 19.Mussa-Ivaldi FA, Hogan N, Bizzi E. Neural, mechanical, and geometric factors subserving arm posture in humans. Journal of Neuroscience. 1985;5(10):2732–2743. doi: 10.1523/JNEUROSCI.05-10-02732.1985. [DOI] [PMC free article] [PubMed] [Google Scholar]
- 20.Montgomery DC. Design and Analysis of Experiments. New York, NY: Wiley; 1991. [Google Scholar]
- 21.Shadmehr R, Mussa-Ivaldi FA. Adaptive representation of dynamics during learning of a motor task. Journal of Neuroscience. 1994;14:3208–3224. doi: 10.1523/JNEUROSCI.14-05-03208.1994. [DOI] [PMC free article] [PubMed] [Google Scholar]


