

Abstract
We report an UHPLC-MS/MS to quantify all-trans-retinal in biological samples of limited size (15-35 mg), which is especially advantageous for use with adipose. To facilitate recovery, retinal and the internal standard 3,4-didehydroretinal were derivatized in situ into their O-ethyloximes. UHPLC resolution combined with high sensitivity and specificity of MS/MS allowed quantification of retinal-O-ethyloximes with a 5 fmol lower limit of detection and a linear range from 5 fmol to 1 pmol. This assay revealed that extra-ocular concentrations of retinal range from ~2 to 40 pmol/g in multiple tissues: the same range as all-trans-retinoic acid. All-trans-retinoic acid has high affinity (kd ≤ 0.4 nM) for its nuclear receptors (RARα, β, γ), whereas retinal has low, if any affinity for these receptors, making it unlikely that these retinal concentrations would activate RAR. We also show that the copious amount of vitamin A used in chow diets increases retinal in adipose depots 2 to 5-fold relative to levels in adipose of mice fed a vitamin A-sufficient diet, as recommended for laboratory rodents. This assay also is proficient for quantifying conversion of retinol into retinal in vitro, and therefore provides an efficient method to study metabolism of retinol in vivo and in vitro.
Keywords: mass spectrometry, liquid chromatography, retinal, retinaldehyde, retinoic acid, retinol
INTRODUCTION
The dioxygenase BCO1 catalyzes central cleavage of β-carotene and ~sixty other carotenoids to generate the vitamin A (all-trans-retinol) precursor all-trans-retinaldehyde (retinal)[1,2]. Cellular retinol binding protein type 2 (Crbp2) sequesters retinal generated in the intestine and directs it to reduction into retinol, which is esterified and transported for storage, mostly in liver[3]. Generating the visual pigment chromophore 11-cis-retinal accounts for the quantitatively major use of vitamin A. The isomerohydrolase Rpe65 produces 11-cis-retinal from all-trans-retinyl esters in a concerted reaction[4]. 11-cis-Retinal forms a Schiff’s base with rhodopsin to generate the protein opsin. Photoactivation of opsin isomerizes 11-cis-retinal into all-trans-retinal, which prompts a neuronal signal and release of all-trans-retinal. The released all-trans-retinal undergoes reduction into all-trans-retinol, which undergoes re-esterification for re-use in the visual cycle. Thus, the eye consumes most of an organisms’ vitamin A through production of retinal isomers to support the visual cycle.
The aldehyde functional group of retinal isomers reacts readily in biological matrices to form Schiff’s bases, which degrades extraction efficiency. To circumvent this impediment, retinal isomers have been converted routinely into oxime derivatives before extraction from tissues[5–7]. This generates syn and anti forms, not always in a consistent ratio. The anti-all-trans-retinal oxime co-elutes with retinol and/or as a broad asymmetric peak. This issue has been resolved by converting retinal isomers in situ into their O-ethyloxime derivatives[8,9]. Resolution of retinal isomers has been achieved with both normal and reverse phase HPLC systems, which have been applied mostly to evaluating retinal isomers in the visual cycle[10–14].
Retinal also serves as the intermediate for biosynthesis of the autocoid all-trans-retinoic acid (atRA) from retinol[15,16]. Although this pathway seems quantitatively minor relative vitamin A use in the visual cycle, all vertebrates require atRA for reproduction and embryonic development, growth, and throughout post-natal life to maintain neurological function, energy balance and immune system function[17,18]. Although atRA has been established as the activated retinol metabolite that regulates the systemic functions of vitamin A[19], several other metabolites have been proposed to contribute to the systemic physiological actions of vitamin A. Relatively recently, a hypothesis has been proposed that all-trans-retinal has signaling actions distinct from atRA that attenuate weight gain in females through effects in adipose and liver[20]. All-trans-retinal concentrations in extra-ocular tissues occur in nM levels[9]. Extraction and efficiency of oxime formation are relatively low in samples of adipose tissue large enough to quantify by LC/UV. Therefore, we developed an assay based on UHPLC/MS/MS to quantify all-trans-retinal in small biological samples to facilitate study of its extra-ocular functions. This assay has the highest sensitivity reported to date for quantifying all-trans-retinal in multiple biologic media.
MATERIALS AND METHODS
Materials
LC-MS grade acetonitrile, formic acid (≥ 95%), all-trans-retinal (≥ 98%) and O-ethylhydroxylamine (≥ 97%) were purchased from Sigma-Aldrich. 3,4-Didehydro retinal was purchased from Toronto Research Chemicals Inc. LC/MS grade water and other solvents were purchased from Fisher Scientific. Retinoid standards were prepared on the day of use. Concentrations were determined spectrophotometrically using published ε values[21,22].
Animals and tissues
One group of male C57BL/6 mice (originally purchased from Jackson Laboratory) was fed an AIN93G diet with 4 IU/g vitamin A (retinyl palmitate) over ten generations. Another group of male C57BL/6 mice (Jackson Laboratory) was fed a stock diet (Teklad Gobal 18% protein rodent diet, 15 IU vitamin A acetate/g). Tissues were dissected under yellow light and frozen in liquid nitrogen immediately after harvest. Samples were kept frozen at −80 °C until assay.
Retinal derivatization and extraction
Tissue samples were homogenized on ice using a Duall size 21 glass homogenizer (Kontes), either manually or with a Heidolph motorized homogenizer (280 rpm), in cold 0.9% saline to generate 10% homogenates. Serum was recovered by centrifuging clotted blood 10 min at 10,000 × g at 4 °C. After addition of the internal standard (10 μL of a 50 nM solution of all-trans-3,4-didehydroretinal), one ml methanol and 2 ml 0.1 M O-ethylhydroxylamine in 100 mM Hepes (pH 6.5) were added to the homogenates (typically 300 μl) or sera (100-200 μl) samples to convert retinals into their O-ethyl oxime derivatives. The resulting suspension was mixed thoroughly (vortex) and incubated 20 min at room temperature. Retinal O-ethyloximes were extracted with 10 ml hexane. After centrifuging, the hexane (upper) layer was transferred to a glass tube and evaporated under nitrogen with gentle heating at 25 to 30 °C in a water bath (model N-EVAP 112, Organomation Associates, Berlin, MA, USA). The residue was suspended in 40 μl acetonitrile: 5 μl was used for UHPLC-MS/MS analysis. Typically,15 to 35 mg tissue or 100 to 200 μl serum from adult mice generated reliable data.
Liver microsomes
Wild-type C57BL/6 mice fed a purified AIN93G diet ad-libitum were sacrificed at 11 AM. Liver was homogenized in a buffer of 10% sucrose, 10 mM Tris-HCl, 1 mM EDTA and 1.5 mM DTT, pH 7.4, using a Heidolph motorized homogenizer at 1240 rpm for 6 strokes, 8-10 sec each, while on ice. The homogenate was centrifuged 10 min at 2,000 × g (4 °C). The resulting supernatant was centrifuged 1 hr at 100,000 × g (4 °C). The microsomal pellet was resuspended in homogenizing buffer and frozen. Retinal biosynthesis assay. Assay buffer (20 mM Hepes, 150 mM KCl, 2 mM EDTA, pH 7.4, with 2 mM freshly added DTT), protein, and retinol substrate (delivered at 1:1000 ratio in DMSO) (total volume, 0.5 ml) were preincubated 5 min at 37 °C in a water bath shaker at 65 rpm. NAD+ and NADP+ co-factors were added in assay buffer to a final concentration of 1 mM each. At the end of the assay, internal standard was added and O-ethyloximes were formed by adding 1 mL methanol and 1.5 mL of 0.1 M O-ethylhydroxylamine in 100 mM Hepes, pH 6.5.
External calibration
A stock standard solution was prepared by dissolving all-trans-retinal in absolute ethanol. Absorption was measured spectrophotometrically at 383 nm. Samples were diluted with ethanol to an absorbance value of ~0.5. Concentrations of stock solutions were calculated according to Bier’s law using an ε value of 42,880[21,22]. Retinal was converted into its O-ethyl oxime derivative by reaction with 0.1 M O-ethylhydroxylamine in 100 mM Hepes, pH 6.5, as described above. After hexane extraction, the organic phase was evaporated under nitrogen and the residue was dissolved in acetonitrile. The solution was diluted into a series of working solutions with acetonitrile and applied directly to UHPLC-MS/MS to generate a calibration curve.
Variation
To determine coefficients of variation, 1.2 g of liver were homogenized in 12 ml saline. Six hundred μL of 50 nM 3,4-didehydroretinal were added and the mixture was divided into 12 aliquots, 6 of which were assayed immediately. The other 6 aliquots were stored at −80 °C and then assayed individually over 6 consecutive days to determine interassay variation.
Recovery
Ten uL of 500 nM 3,4-didehydroretinal was added to 1 mL of 10% liver homogenate or 1 mL of saline (6 repeats for each group). The samples were derivatized and analyzed as described above. Recovery was determined by comparing 3,3-didehydroretinal oxime measured in tissues to the amounts quantified in saline blanks.
Resolution
All-trans-retinal-O-ethyloxime or all-trans-3,4-didehydroretinal-O-ethyloxime were resolved via reverse-phase chromatography with an Agilent 1290 system (Santa Clara, CA), equipped with an on-line degasser, binary pump, column compartment and auto sampler. The column compartment was maintained at 25 °C, whereas samples were kept in the autosampler at 10 °C. UHPLC separation was achieved with an analytical Eclipse plus C18 RRHD column (Agilent, 2.1 × 150 mm, 1.8 μm) at a flow rate of 0.4 ml/min. Mobile phases were: (A) 0.1% formic acid in water; (B) 0.1% formic acid in acetonitrile. The following gradient was applied over a total run time of 25 min: 0-2 min, 80% B; 2-2.5 min, 80% B to 85% B; 2.5-17.5 min, 85% B to 95% B; 17.5-18 min, 95% B to 100% B; 18-20 min, holding at 100% B; 20-20.5 min, back to 80% B and re-equilibrating for 3.5 min.
MS/MS analysis
Analytes were detected using an AB Sciex API-4000 triple-quadrupole mass spectrometer in positive APCI mode. The instrument was controlled by Analyst v1.6 software and operated in multiple reaction mode (MRM). Retinal oxime was monitored using an m/z 328.5 to 236.4 transition, whereas 3,4-didehydroretinal oximes were monitored using an m/z 326.6 to 234.4 transition. The optimized MS variables were: curtain gas, 10; collision gas, 7; gas 1, 70; nebulizer current, 1; source temperature, 350 °C; declustering potential, 55; entrance potential, 10; collision energy, 17; collision exit potential, 5.
Test for potential matrix effects
Mouse liver (200 mg) was homogenized in 2 ml cold 0.9% saline and was divided into 2 equal portions. Methanol (1 ml) was added to each of the two. One portion was treated with 0.1 M O-ethyl hydroxylamine in 100 mM Hepes, pH 6.5 (2 ml); the other was treated with 100 mM Hepes, pH 6.5, 2 ml without O-ethylhydroxylamine. After 20 min incubation at room temperature, both portions were extracted and analyzed in the absence of added IS.
RESULTS AND DISCUSSION
Sample Preparation
Retinoids are very susceptible to isomerization and oxidation, and are handled optimally under yellow or red light and allowing contact only with glass and stainless steel containers and transfer syringes[22–24]. Extracts suspended in acetonitrile can be stored at −20 °C for 1 week without significant degradation and remain stable in a −10 °C autosampler shielded from light for at least two days.
Retinal Oxime
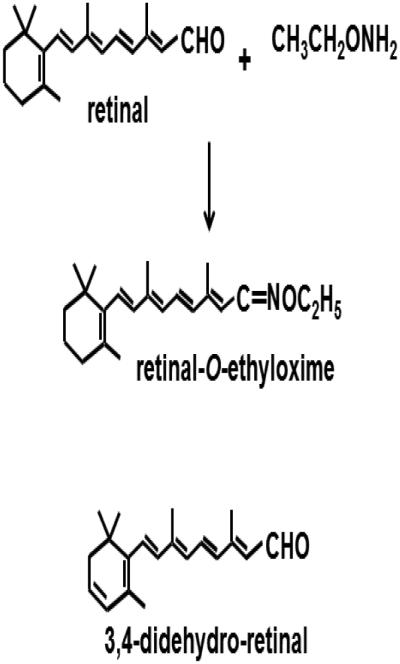
O-Ethylhydroxylamine was used to convert retinal into stable O-ethyl oxime derivatives (anti and syn) to enhance recovery (Figure 1). Retinal has a reactive aldehyde group susceptible to promiscuous reactions in biological matrices, preventing efficient extraction. Generating retinal O-alkylhydroxylamine instead of the nonalkylated hydroxylamine avoids problems associated with the non-alkylated anti-retinal oxime, which can elute as a broad asymmetrical peak during chromatography. We also observed that forming retinal oximes in solution such as methanol/water, rather than a tissue homogenate, generated a significantly higher syn/anti ratio. The difference probably relates to the immediate microenvironment of the aldehyde group during nucleophilic attack of hydroxylamine[6].
Figure 1. Structures of all-trans-retinal and internal standard (all-trans-3,4-didehydroretinal) showing formation of the O-ethyloxime derivative of retinal.
MS conditions
We have reported an HPLC/UV assay for retinal quantification in serum and tissues with low pmol detection limits[9]. Here we report a more sensitive LC/MS/MS assay using selected reaction monitoring to quantify retinal with a detection limit of 5 fmol. We used positive ion APCI because of its favorable ionization efficiency for retinoids, which provides higher sensitivity and lower background noise than ESI or negative APCI[25,26]. The fragmentation and MS/MS ion transitions for retinal and the IS (internal standard) oximes were optimized for maximum sensitivity, leading to 100-1000 fold reduction in background[27]. The fragmentation patterns of protonated ([M+H]+) retinal and IS oximes are shown in Figure 2. The most intensive transition with the lowest accompanying background was m/z 328.5 → 236.4 for retinal oximes and m/z 326.6 → 234.4 for IS.
Figure 2. Mass spectra of the oxime derivatives of: A) all-trans-retinal; B) all-trans-3,4-didehydroretinal.

Chromatography
To achieve higher sensitivity, miniaturization in liquid chromatography is becoming increasingly popular. Both small stationary-phase particles and reducing column diameter improve resolution. In this study, several C18 and C8 columns with and without UHPLC capacity were evaluated with mobile phases including methanol, water, acetonitrile, acetic acid and formic acid. Baseline resolution of anti- and syn-O-ethyloximes of retinal and IS was achieved adequately only with an Eclipse plus C18 (1.8 μm particle size) column (Figure 3). A mobile phase of acetonitrile/water/0.1% formic acid provided optimum sensitivity and resolution, and allowed for rapid switching between our RA assay[28] and the retinal oxime analyses without hardware or solvent reservoir changes. The current method optimized resolution between anti- and syn-oxime conformers of each O-ethyl oxime and signal intensity. Within the course of a given analysis, retention times remain stable within ± 0.2 min. Syn- and anti-retinal O-ethyloxime isomers were summed and quantified from a calibration curve generated with standard amounts of retinal O-ethyl oxime. Baseline peak identity and instrument performance were verified by injecting retinal and IS oximes both individually and as a mixture before each sample analysis.
Figure 3. Chromatograms of the O-ethyloximes of all-trans-retinal and all-trans-3,4-didehydroretinal.

Reverse-phase UHPLC relied on an Eclipse plus C18 RRHD column (Agilent, 2.1 × 150 mm, 1.8 μm) at a flow rate of 0.4 ml/min. Mobile phase A was 0.1% formic acid in water; B was 0.1% formic acid in acetonitrile. Total run time was 25 min with 80% B from 0-2 min, 80% B to 85% B from 2-2.5 min, 85% B to 95% B from 2.5-17.5 min, 95% B to 100% B from 17.5-18 min, 100% B from 18-20 min, 100% to 80% B from 20-20.5 min, re-equilibrating for 3.5 min.
Performance
This assay was unaffected by matrix interference as shown by observing an all-trans-retinal signal only after O-ethyloxime derivatization (Figure 4). Thus, the authenticity of the analyte signal is verified by its reacting with O-ethyloxime, co-migrating with authentic standards in UHPLC, having the appropriate molecular ion, and having the expected product fragment (m/z 328.5 to 236.4). The lowest limit of detection (LOD), defined as a signal-to-noise ratio of 3, was 5 fmol. The lowest limit of quantification (LOQ), defined as a signal-to-noise ratio of 10, was 20 fmol (Figure 5).
Figure 4. Lack of matrix interference.

A) Analysis of a mouse liver extract for the m/z 328.5 to 236.4 transition of all-trans-retinal O-ethyloxime in the absence of sample derivatization. B) Analysis of an extract of the same homogenate after sample derivatization. C and D) Analyses for the m/z 326.6 to 234.4 transition of IS with the same samples analyzed in A and B. C and D show results in absence and presence of derivatization, respectively. IS was not added to any samples.
Figure 5. Lowest limit of detection (LOD) and lowest limit of quantification (LOQ) for O-ethyloximes of all-trans-retinal.

A representative calibration curve for retinal oxime using UHPLC-MS/MS illustrates the linear dynamic range (Figure 6). The best-fit line coincided with the data even at the low end of the linear working range.
Figure 6. Representative calibration curve for all-trans-retinal O-ethyloxime.

The Y-axis shows the sum of the areas of the anti and syn peaks generated by the m/z 328.5 to 236.4 transition of all-trans-retinal O-ethyloximes monitored by MS/MS as a function of the total molar amount of oximes analyzed. The fit did not deviate from linearity (r2 = 0.994) over the range tested of 5 to 1040 fmol. A) total range; B) lower range. The lines were fit by linear regression analysis using GraphPad Prism.
The internal standard (IS) improved accuracy by adjusting for sample loss during derivatization, extraction, and handling. We chose all-trans-3,4-didehydroretinal as the IS because of its structural similarity to retinal and its well-resolved retention time in our chromatographic conditions. Average recovery (± SEM) for tissue retinal for a test sample (liver) was 92% ± 5% (SE, n = 6), which is similar to our previously reported recovery from tissues of 95%[9]. In the hands of a different user, average recovery (± SEM) for multiple simultaneous assays ofmultiple tissues was 72% ± 15% (n = 80). Thus, the individual performing the assay and the total number of samples handled affect recovery. Coefficients of variation were (n = 6): inter assay, 7.9 %; intra assay, 5.8%. As little as 15-35 mg (wet weight) of tissue generate rigorous data.
Application
This method was applied to quantify retinal in mouse tissues and serum and retinal generated from retinol by mouse liver microsomes. Representative MRM chromatograms of retinal oxime derivatized from endogenous retinal in mouse brown adipose tissue and serum demonstrate the in vivo utility of the assay with small biological samples (Figure 7). The assay was applied to compare retinal reference values from tissues of adults male C57BL/6 mice fed a stock diet containing 15 IU vitamin A/g vs a purified AIN93G diet containing 4 IU vitamin A/g (Figure 8). Our data show that copious levels of vitamin A, as occur in chow diets, increased retinal in adipose 2 to 5-fold relative to levels in the vitamin A-sufficient diet recommended for laboratory rodents, but did not affect the other tissues assayed, except spleen.
Figure 7. Representative MRM chromatograms of retinal oximes extracted from brown adipose tissue (BAT) and serum.

A) Analysis of ~20 mg of brown adipose tissue of an adult male C57Bl/6 mouse fed an AIN93G diet containing 4 IU vitamin A/g. B) Analysis of 150 μL of serum from the same mouse. Arrows designate the elution positions of IS oximes.
Figure 8. Quantification of all-trans-retinal in mouse tissues.
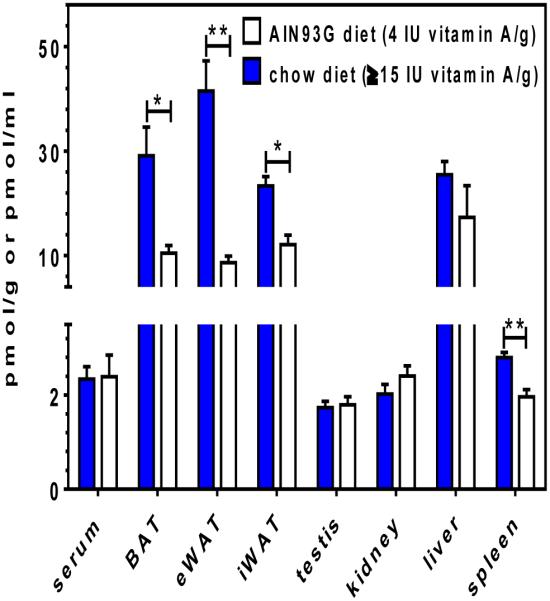
Data were generated from adult male C57BL/6 mice fed and bred from dams fed a chow diet or the AIN93G diet. Values are means ± SE from 6 to 10 mice. Statistics were generated using an unpaired, non-parametric Mann-Whitney test: *p < 0.003; **p < 0.001.
Data using mouse liver microsomes illustrate the in vitro utility of the assay (Figure 9). Retinal biosynthesis within two min can be quantified using 10 μg mouse liver microsomal protein.
Figure 9. Retinal biosynthesis from retinol catalyzed by mouse liver microsomes.

A) Retinal was generated from 200 nM retinol and 10 μg mouse liver microsomal protein. Data were fit by non-linear regression analysis with GraphPad Prism. B) Representative selective reaction monitoring chromatograms of retinal and IS O-ethyl oximes showing retinal generated in 2 min.
Comparison to previous assays
We found only one validated assay that reported efficacy with tissues other than the eye and a combination of LOD, LOQ, intra- and interassay variation, recovery, and the linear dynamic range (Table 1). Most validated retinal assays focused on eye and/or reported only standards, and/or did not report pertinent information, as presented in detail here. The most complete assay relied on UV detection and therefore had an LOD 20-fold less sensitive than the current assay, and did not include an internal standard [9]. This literature review reveals that the current assay is both the most completely validated and most sensitive reported to date for quantifying all-trans-retinal in multiple tissues other than the eye.
Table 1.
Comparison of current assay to published retinal assays. Blank spaces indicate information that was not provided in the reference cited.
| Study | Method | Derivative | LOD (fmol) |
LOQ (fmol) |
Intra assay CV (%) |
Inter assay CV (%) |
Recovery (%) |
Linear range (pmol) |
Internal standard | Tissues assayed |
|---|---|---|---|---|---|---|---|---|---|---|
| Present | ULC/MS/MS |
O-ethyl oxime |
5 | 20 | 5.8 | 7.9 | 92 | 0.005-1 | all-trans-3,4- didehydroretinal |
serum, liver, kidney, BAT, eWAT, iWAT, testis, spleen |
| [14] | LC/MS/MS | oxime | all-trans-13,14- dihydro-retinal or all-trans-3,4- dihydro-retinal |
eye | ||||||
| [9] | LC/UV | O-ethyl oxime | 200 | 400 | 6.9 | 5.9 | 95 | 0.4-600 | serum, liver, kidney, WAT, testis |
|
| [34] | LC/UV | oxime | 100- 200 |
pineal gland, eye |
||||||
| [7] | LC/UV | oxime | eye | |||||||
| [8] | LC/UV |
O-ethyl oxime |
3,500 | 3.5 | 98 | 3.5-211 | retinyl acetate | eye | ||
| [6] | LC/UV | oxime | 95 | eye | ||||||
| [33] | LC/UV, NMR, MS |
oxime | standard only | |||||||
| [5] | LC/UV | none | tetraphenylethylene or 2,6-di-tert-butyl- p-cresol |
standard only | ||||||
| [32] | LC/UV | none | 70,000 | standard only |
CONCLUSIONS
We report a sensitive assay to quantify all-trans-retinal in small biological samples, applicable for tissue and in vitro analyses. This assay allows quantification using much smaller biological samples than previously reported assays, and can be applied to a variety of tissues, which is especially advantageous for quantifying retinal in adipose tissue. This assay validated retinal concentrations in mouse tissues in the range ~2 to 40 pmol/g tissue, i.e. about the same range as RA. Retinal has low, if any, affinity for RAR compared to RA, which has a kd for RAR ≤0.4 nM[29–31]. Therefore, if retinal has biological activity in its own right, it seems unlikely to function by activating RAR, because of unfavorable competition with RA. This method provides a powerful method to study retinoid metabolism in vivo and enzyme activity in vitro.
ACKNOWLEDGMENTS
This work was supported in part by NIH grants DK09522 and AA017927 (JLN). The authors are grateful to Charles Krois for helpful conversations.
Footnotes
Publisher's Disclaimer: This is a PDF file of an unedited manuscript that has been accepted for publication. As a service to our customers we are providing this early version of the manuscript. The manuscript will undergo copyediting, typesetting, and review of the resulting proof before it is published in its final citable form. Please note that during the production process errors may be discovered which could affect the content, and all legal disclaimers that apply to the journal pertain.
REFERENCES
- [1].Eroglu A, Hruszkewycz DP, dela Sena C, Narayanasamy S, Riedl KM, Kopec RE, et al. Naturally occurring eccentric cleavage products of provitamin A β-carotene function as antagonists of retinoic acid receptors. J. Biol. Chem. 2012;287:15886–15895. doi: 10.1074/jbc.M111.325142. doi:10.1074/jbc.M111.325142. [DOI] [PMC free article] [PubMed] [Google Scholar]
- [2].dela Seña C, Riedl KM, Narayanasamy S, Curley RW, Schwartz SJ, Harrison EH. The human enzyme that converts dietary provitamin A carotenoids to vitamin A is a dioxygenase. J. Biol. Chem. 2014;289:13661–13666. doi: 10.1074/jbc.M114.557710. doi:10.1074/jbc.M114.557710. [DOI] [PMC free article] [PubMed] [Google Scholar]
- [3].Kakkad BP, Ong DE. Reduction of retinaldehyde bound to cellular retinol-binding protein (type II) by microsomes from rat small intestine. J. Biol. Chem. 1988;263:12916–12919. [PubMed] [Google Scholar]
- [4].Saari JC. Vitamin A metabolism in rod and cone visual cycles. Annu. Rev. Nutr. 2012;32:125–145. doi: 10.1146/annurev-nutr-071811-150748. doi:10.1146/annurev-nutr-071811-150748. [DOI] [PubMed] [Google Scholar]
- [5].Tsukida K, Kodama A, Ito M. Simultaneous determination of cis-trans isomeric retinals by high-performance liquid chromatography. J. Chromatogr. 1977;134:331–336. doi: 10.1016/s0021-9673(00)88530-1. [DOI] [PubMed] [Google Scholar]
- [6].Groenendijk GW, De Grip WJ, Daemen FJ. Quantitative determination of retinals with complete retention of their geometric configuration. Biochim. Biophys. Acta. 1980;617:430–438. doi: 10.1016/0005-2760(80)90009-0. [DOI] [PubMed] [Google Scholar]
- [7].Landers GM, Olson JA. Rapid, simultaneous determination of isomers of retinal, retinal oxime and retinol by high-performance liquid chromatography. J. Chromatogr. 1988;438:383–392. doi: 10.1016/s0021-9673(00)90269-3. [DOI] [PubMed] [Google Scholar]
- [8].van Kuijk FJ, Handelman GJ, Dratz EA. Rapid analysis of the major classes of retinoids by step gradient reversed-phase high-performance liquid chromatography using retinal (O-ethyl) oxime derivatives. J. Chromatogr. 1985;348:241–251. doi: 10.1016/s0021-9673(01)92458-6. [DOI] [PubMed] [Google Scholar]
- [9].Kane MA, Folias AE, Napoli JL. HPLC/UV quantitation of retinal, retinol, and retinyl esters in serum and tissues. Anal. Biochem. 2008;378:71–79. doi: 10.1016/j.ab.2008.03.038. doi:10.1016/j.ab.2008.03.038. [DOI] [PMC free article] [PubMed] [Google Scholar]
- [10].Bridges CD. High-performance liquid chromatography of retinoid isomers: an overview. Methods Enzymol. 1990;189:60–69. doi: 10.1016/0076-6879(90)89276-n. [DOI] [PubMed] [Google Scholar]
- [11].Landers GM. High-performance liquid chromatography of retinoid isomers. Methods Enzymol. 1990;189:70–80. doi: 10.1016/0076-6879(90)89277-o. [DOI] [PubMed] [Google Scholar]
- [12].Van Hooser JP, Garwin GG, Saari JC. Analysis of visual cycle in normal and transgenic mice. Methods Enzymol. 2000;316:565–575. doi: 10.1016/s0076-6879(00)16750-3. [DOI] [PubMed] [Google Scholar]
- [13].Garwin GG, Saari JC. High-performance liquid chromatography analysis of visual cycle retinoids. Methods Enzymol. 2000;316:313–324. doi: 10.1016/s0076-6879(00)16731-x. [DOI] [PubMed] [Google Scholar]
- [14].Golczak M, Bereta G, Maeda A, Palczewski K. Molecular biology and analytical chemistry methods used to probe the retinoid cycle. Methods Mol. Biol. Clifton NJ. 2010;652:229–245. doi: 10.1007/978-1-60327-325-1_13. doi:10.1007/978-1-60327-325-1_13. [DOI] [PMC free article] [PubMed] [Google Scholar]
- [15].Napoli JL. Physiological insights into all-trans-retinoic acid biosynthesis. Biochim. Biophys. Acta. 2012;1821:152–167. doi: 10.1016/j.bbalip.2011.05.004. doi:10.1016/j.bbalip.2011.05.004. [DOI] [PMC free article] [PubMed] [Google Scholar]
- [16].Kedishvili NY. Enzymology of retinoic acid biosynthesis and degradation. J. Lipid Res. 2013;54:1744–1760. doi: 10.1194/jlr.R037028. doi:10.1194/jlr.R037028. [DOI] [PMC free article] [PubMed] [Google Scholar]
- [17].Rhinn M, Dollé P. Retinoic acid signalling during development. Dev. Camb. Engl. 2012;139:843–858. doi: 10.1242/dev.065938. doi:10.1242/dev.065938. [DOI] [PubMed] [Google Scholar]
- [18].Das BC, Thapa P, Karki R, Das S, Mahapatra S, Liu T-C, et al. Retinoic acid signaling pathways in development and diseases. Bioorg. Med. Chem. 2014;22:673–683. doi: 10.1016/j.bmc.2013.11.025. doi:10.1016/j.bmc.2013.11.025. [DOI] [PMC free article] [PubMed] [Google Scholar]
- [19].Piskunov A, Al Tanoury Z, Rochette-Egly C. Nuclear and extra-nuclear effects of retinoid acid receptors: how they are interconnected. Subcell. Biochem. 2014;70:103–127. doi: 10.1007/978-94-017-9050-5_6. doi:10.1007/978-94-017-9050-5_6. [DOI] [PubMed] [Google Scholar]
- [20].Ziouzenkova O, Orasanu G, Sharlach M, Akiyama TE, Berger JP, Viereck J, et al. Retinaldehyde represses adipogenesis and diet-induced obesity. Nat. Med. 2007;13:695–702. doi: 10.1038/nm1587. doi:10.1038/nm1587. [DOI] [PMC free article] [PubMed] [Google Scholar]
- [21].Barua AB, Furr HC. Properties of retinoids. Structure, handling, and preparation. Mol. Biotechnol. 1998;10:167–182. doi: 10.1007/BF02760863. doi:10.1007/BF02760863. [DOI] [PubMed] [Google Scholar]
- [22].Kane MA, Napoli JL. Quantification of endogenous retinoids. Methods Mol. Biol. Clifton NJ. 2010;652:1–54. doi: 10.1007/978-1-60327-325-1_1. doi:10.1007/978-1-60327-325-1_1. [DOI] [PMC free article] [PubMed] [Google Scholar]
- [23].Napoli JL, Horst RL. Quantitative analyses of naturally occurring retinoids. Methods Mol. Biol. Clifton NJ. 1998;89:29–40. doi: 10.1385/0-89603-438-0:29. doi:10.1385/0-89603-438-0:29. [DOI] [PubMed] [Google Scholar]
- [24].Schmidt CK, Brouwer A, Nau H. Chromatographic analysis of endogenous retinoids in tissues and serum. Anal. Biochem. 2003;315:36–48. doi: 10.1016/s0003-2697(02)00662-0. [DOI] [PubMed] [Google Scholar]
- [25].Wang Y, Chang WY, Prins GS, van Breemen RB. Simultaneous determination of all-trans, 9-cis, 13-cis retinoic acid and retinol in rat prostate using liquid chromatography-mass spectrometry. J. Mass Spectrom. JMS. 2001;36:882–888. doi: 10.1002/jms.189. doi:10.1002/jms.189. [DOI] [PubMed] [Google Scholar]
- [26].Kane MA, Folias AE, Wang C, Napoli JL. Quantitative profiling of endogenous retinoic acid in vivo and in vitro by tandem mass spectrometry. Anal. Chem. 2008;80:1702–1708. doi: 10.1021/ac702030f. doi:10.1021/ac702030f. [DOI] [PMC free article] [PubMed] [Google Scholar]
- [27].Rosenberg E. The potential of organic (electrospray- and atmospheric pressure chemical ionisation) mass spectrometric techniques coupled to liquid-phase separation for speciation analysis. J. Chromatogr. A. 2003;1000:841–889. doi: 10.1016/s0021-9673(03)00603-4. [DOI] [PubMed] [Google Scholar]
- [28].Kane MA, Chen N, Sparks S, Napoli JL. Quantification of endogenous retinoic acid in limited biological samples by LC/MS/MS. Biochem. J. 2005;388:363–369. doi: 10.1042/BJ20041867. doi:10.1042/BJ20041867. [DOI] [PMC free article] [PubMed] [Google Scholar]
- [29].Crettaz M, Baron A, Siegenthaler G, Hunziker W. Ligand specificities of recombinant retinoic acid receptors RAR alpha and RAR beta. Biochem. J. 1990;272:391–397. doi: 10.1042/bj2720391. [DOI] [PMC free article] [PubMed] [Google Scholar]
- [30].Blumberg B, Bolado J, Derguini F, Craig AG, Moreno TA, Chakravarti D, et al. Novel retinoic acid receptor ligands in Xenopus embryos. Proc. Natl. Acad. Sci. U. S. A. 1996;93:4873–4878. doi: 10.1073/pnas.93.10.4873. [DOI] [PMC free article] [PubMed] [Google Scholar]
- [31].di Masi A, Leboffe L, De Marinis E, Pagano F, Cicconi L, Rochette-Egly C, et al. Retinoic acid receptors: From molecular mechanisms to cancer therapy. Mol. Aspects Med. 2014 doi: 10.1016/j.mam.2014.12.003. doi:10.1016/j.mam.2014.12.003. [DOI] [PubMed] [Google Scholar]