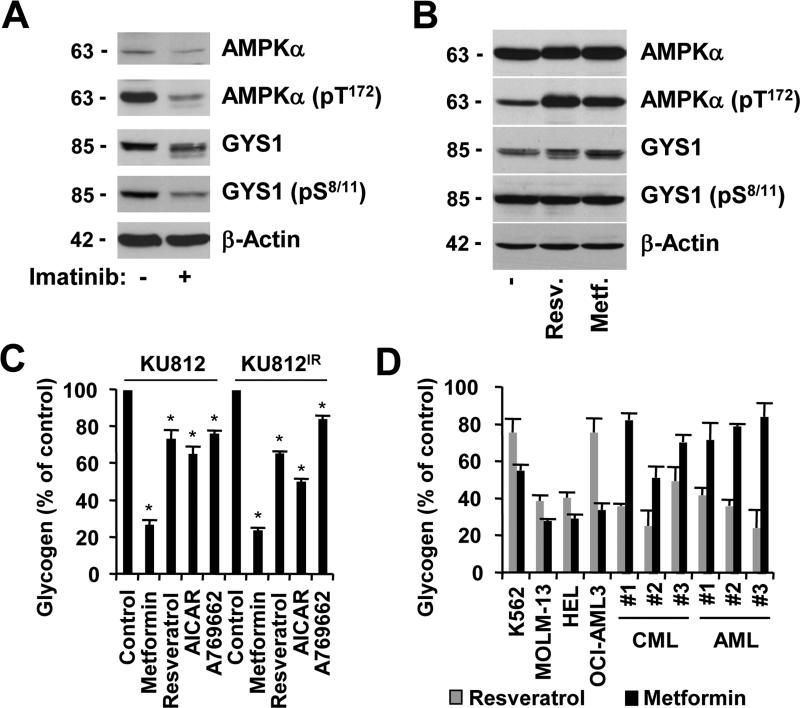
Figure 3. Glycogen production is regulated at multiple levels.
Expression of AMPKα, AMPKα (pT172), GYS1, GYS1 (pS8/11), GYS1 (pS641) and β-actin was determined by immunoblotting in KU812 cells that were left untreated or treated for 18h with (a) imatinib (1 μM) or (b) resveratrol (10 μM) and metformin (1 mM). Changes in glycogen levels were measured in cellular extracts of (c) KU812 or KU812IR cells in response to treatment (72h) with either metformin (1 mM), resveratrol (10 μM), AICAR (1mM) and A769662 (100 μM) (n=3) or (d) in cellular extracts of cell lines (K562, MOLM-13, HEL and OCI-AML3) as well as primary patient specimens in response to metformin (1 mM) and resveratrol (10 μM). *Significant differences (p<0.05) were observed between control and treated cells.

