

Background: Insulin suppresses lipolysis in adipocytes by inducing Egr1 that inhibits expression of ATGL.
Results: Stimulation of mTORC1 or genetic ablation of 4E-BP1/2 increase expression of Egr1 regardless of its mRNA levels.
Conclusion: Regulation of Egr1 by insulin takes place predominantly at the level of translation via mTORC1/4E-BP.
Significance: Translational control of the Egr1 expression explains the role of mTORC1 in regulation of lipolysis.
Keywords: adipose triglyceride lipase (ATGL), early growth response protein 1 (EGR1), insulin, lipolysis, mammalian target of rapamycin (mTOR)
Abstract
Early growth response transcription factor Egr1 controls multiple aspects of cell physiology and metabolism. In particular, Egr1 suppresses lipolysis and promotes fat accumulation in adipocytes by inhibiting the expression of adipose triglyceride lipase. According to current dogma, regulation of the Egr1 expression takes place primarily at the level of transcription. Correspondingly, treatment of cultured adipocytes with insulin stimulates expression of Egr1 mRNA and protein. Unexpectedly, the MEK inhibitor PD98059 completely blocks insulin-stimulated increase in the Egr1 mRNA but has only a moderate effect on the Egr1 protein. At the same time, mTORC1 inhibitors rapamycin and PP242 suppress expression of the Egr1 protein and have an opposite effect on the Egr1 mRNA. Mouse embryonic fibroblasts with genetic ablations of TSC2 or 4E-BP1/2 express less Egr1 mRNA but more Egr1 protein than wild type controls. 35S-labeling has confirmed that translation of the Egr1 mRNA is much more effective in 4E-BP1/2-null cells than in control. A selective agonist of the CB1 receptors, ACEA, up-regulates Egr1 mRNA, but does not activate mTORC1 and does not increase Egr1 protein in adipocytes. These data suggest that although insulin activates both the Erk and the mTORC1 signaling pathways in adipocytes, regulation of the Egr1 expression takes place predominantly via the mTORC1/4E-BP-mediated axis. In confirmation of this model, we show that 4E-BP1/2-null MEFs express less ATGL and accumulate more fat than control cells, while knock down of Egr1 in 4E-BP1/2-null MEFs increases ATGL expression and decreases fat storage.
Introduction
In mammalian organism, most energy is stored as triglycerides (TG)5 accumulated in the adipose tissue. Upon TG hydrolysis, fatty acids are delivered by blood to cells and tissues for energy production and the synthesis of most lipids. However, despite their fundamental physiological importance, an oversupply of fatty acids is highly detrimental as it causes a number of pathological effects collectively known as lipotoxicity, which, in turn, provokes and aggravates type 2 diabetes, cardiac dysfunction, hypertension, hepatic steatosis, and other metabolic disease (1–5). Therefore, hydrolysis of TG, or lipolysis, is placed under strict hormonal control.
Among the major regulators of lipolysis are catecholamines that stimulate and insulin that restrains lipolysis and promotes TG storage. Recently, we have found that the effect of insulin on lipolysis is partially mediated by mTORC1 (6) that represents a major (or the major) energy and nutrient sensor in the cell (7–9) and a “critical node in insulin signaling” (10). mTORC1 decreases expression of the rate-limiting lipolytic enzyme, adipose triglyceride lipase, or ATGL (a.k.a. desnutrin, PNPLA2, TTS2.2, iPLA2ζ) (11–13). Using a genetic screen in Saccharomyces cerevisiae, we have determined that the effect of mTORC1 on the expression of ATGL is mediated by the primary early growth response transcription factor Egr1 that directly binds to and inhibits activity of the ATGL promoter (14).
Egr1 (a.k.a. NGFI-A, Zif268, TIS8, and Krox24) is a zinc finger transcription factor that belongs to the family of primary response genes (15). Like other members of this family, Egr1 participates in growth control, differentiation, and cancer progression (16–18). Interestingly, two polymorphisms in Egr1 have been associated with impaired lipid metabolism in humans (19), and several recent reports have confirmed that Egr1 is intimately involved in the regulation of lipid metabolism. Thus, in addition to the regulation of ATGL expression (14), Egr1 has been implicated in adipogenesis (20), insulin biosynthesis (21) and resistance (22), and cholesterol biosynthesis (23).
Previous studies have established that regulation of Egr1 takes place primarily at the level of its biosynthesis and not post-translationally (18). In particular, expression of Egr1 is rapidly induced by growth factors, neurotransmitters, and various stresses (16–18). Since Egr1 mRNA is also up-regulated by various biological stimuli similar to other primary response genes (15), a general consensus in the field has been that Egr1 expression is largely controlled at the level of transcription (16). In this regard, it has been shown that the promoter region of Egr1 incorporates five serum response elements, five Ets binding sites, two cAMP response elements, two Sp1 binding sites, an AP1- and an Egr1-binding sites all of which have been shown to participate in the regulation of Egr1 transcription in different cells (16).
In line with this model, we and others have found that, in adipocytes, insulin increases transcription of the Egr1 gene (14, 24, 25) via the Erk-mediated pathway (this report). Unexpectedly, it turns out that an increase in the Egr1 mRNA is largely dispensable for the up-regulation of the Egr1 protein. The latter takes place primarily at the level of translation via the mTORC1–4E-BP-mediated axis. Increased Egr1 expression in 4E-BP1/2 ablated cells leads to down-regulation of ATGL and accumulation of triglycerides. These results uncover yet another mechanistic connection between mTORC1 and regulation of lipid homeostasis in mammalian cells.
EXPERIMENTAL PROCEDURES
Materials
Antibodies against ATGL, phospho-4E-BP1 (Ser-65), Phospho-p70 S6K1 (Ser-371), Phospho-S6, Phospho-44/42 Erk1/2, 44/42 Erk1/2, p70 S6K1, S6, 4E-BP1, perilipin, actin, as well as PD98059 were purchased from Cell Signaling Technology (Beverly, MA). Antibodies against Egr1, C/EBPα, and PPARγ were from Santa Cruz Biotechnology (Dallas, TX). Antibody against HSL was purchased from Cayman Chemical (Ann Arbor, MI). Horseradish peroxidase-labeled anti-rabbit and anti-mouse IgG, rapamycin, PP242, insulin, bovine serum albumin, protease inhibitors mixture, and actinomycin D were procured from Sigma Aldrich. Bovine serum (BS) and fetal bovine serum (FBS) were from Atlanta Biologicals (Lawrenceville, GA). Dulbecco's modified Eagle's medium (DMEM), DMEM without Methionine and Cysteine, l-Glutamine, Opti-MEM, penicillin, streptomycin, Lipofectamine 2000, TRIzol, and sheep anti-rabbit Dynabeads m-280 were purchased from Life Technologies (Grand Island, NY). Easy TagTM Express 35S protein labeling mix was obtained from Perkin-Elmer Life Sciences (Boston, MA).
Cell Culture
3T3-L1 pre-adipocytes were cultured in DMEM supplemented with 10% bovine serum, 100 units/ml penicillin, 100 μg/ml streptomycin and 2 mm l-glutamine. Two days after confluence, cells were incubated in the differentiation medium (DMEM with 10% FBS, 1.67 μm insulin, 1 μm dexamethasone, and 0.5 mm 3-isobutyl-1-methylxanthine). After 48 h, differentiation medium was replaced with DMEM containing 10% FBS. 4E-BP1/2 double knock-out (DKO) mouse embryonic fibroblasts (MEFs) were a kind gift of Dr. Sonenberg (26), TSC2 knock-out MEFs were a kind gift of Dr. Manning (27). Knock-out MEFs and their littermate control wild-type MEFs were maintained in DMEM supplemented with 10% FBS, 100 units/ml penicillin, 100 μg/ml streptomycin, and 2 nm l-glutamine.
Promoter Luciferase Assay
The human Egr1 promoter luciferase construct (kindly provided by Dr. Gerald Thiel, University of Saarland Medical Center, Homburg, Germany) and the ATGL promoter luciferase construct (28) were transfected along with the pEGFP-N1 vector (0.1 μg) into ∼80% confluent HEK293T cells or ca. 50% confluent mouse embryonic fibroblasts plated on 6-well dishes using Lipofectamine 2000. After 48 h, cells were harvested in the reporter lysis buffer (Promega Inc.). Luciferase activity in cell lysates was assayed using Luciferase Assay Kit (Promega). Luciferase expression and pEGFP fluorescence was measured in a Synergy HT Microplate Reader (Biotek, Winooski, VT). Luciferase activity was normalized by EGFP fluorescence to obtain relative Egr1 promoter activity.
Immunoisolation of the Egr1 mRNA
Cells were washed three times with PBS and harvested in 10 mm HEPES, 1 mm EGTA, 100 mm KCl, 10 mm MgCl2, 1 mm PMSF, 0.1% Triton X-100, 1 μm leupeptin, 10 units/ml RNAsin Plus, pH 7.4 prepared in diethyl pyrocarbonate-treated water. Cell extracts were incubated with rabbit antibody against 4E-BP1 or nonspecific rabbit IgG and sheep anti-rabbit Dynabeads overnight at 4 °C on the orbital shaker. Next day, the beads were washed four times with the same buffer, RNA was harvested using TRIzol reagent, and subjected to the qPCR analysis as described below.
RNA Extraction and Quantitative PCR
Total RNA was extracted from cells using the TRIzol reagent. Reverse transcription of 500 ng total RNA was performed using random decamers (RETROscript kit; Ambion, Austin, TX), and the gene expression was determined by quantitative PCR (MX4000 Multiplex qPCR system; Stratagene, La Jolla, CA). Reactions were performed in triplicate in the total volume of 25 μl containing 2.5 μl 1:10- diluted cDNA, 1× SYBR green master mix (Brilliant II SYBR Green qPCR Master Mix; Stratagene), and gene-specific primers (CCACAACAACAGGGAGACCT and ACTGAGTGGCGAAGGCTTTA for Egr1). Gene expression was normalized by GAPDH with the following primers: AACTTTGGCATTGTGGAAGG and GGATGCAGGGATGATGTTCT. Gene expression was measured using ΔΔCt method. Deoxyribonuclease-treated samples and no-template controls were analyzed in parallel experiments to confirm specificity.
siRNA Treatment
cells were transfected with 100 nm of siEgr1 Smartpool ON-TARGETplus (Dharmacon Inc., Lafayette, CO) using Lipofectamine 2000 according to manufacturer's protocol.
Egr1 Biosynthesis
WT and DKO MEFs were cultured in 35-mm dishes overnight. Cells were then incubated in methionine, cysteine, and glutamine-free DMEM medium with 10% serum for 4 h and labeled with [35S]methionine/cysteine using EasyTagTM Express35S Protein Labeling Mix (110μCi/ml) and glutamine (2 mm). Following labeling, cells were washed with PBS three times and harvested in RIPA lysis buffer (20 mm Tris, pH 7.4, 120 mm NaCl, 1% Triton, 1 mm EGTA, 1 μm aprotinin, 2 μm leupeptin, 1 μm pepstatin, 5 mm benzamidine). Total cell lysates (3 μl) were applied onto Whatman 3MM filters and air dried. Dried filters were immersed in a beaker with ice cold 5% trichloroacetic acid for 15 min with gentle shaking. The procedure was repeated three times. After that, filters were additionally washed with 95% ethanol for 10 min, dried at 90 °C for 15 min, placed in scintillation vials with 9 ml of the scintillation mixture (MP Biomedicals, Santa Ana, CA). Radioactivity was measured in a scintillation counter (LKB Wallac 1217 Rack Beta, Mount Waverly, Australia) and normalized by protein content.
Cell lysates (500 μg) were immunoprecipitated with Egr1 antibody and anti-rabbit Dynabeads overnight at 4 °C on an orbital shaker. Beads were washed twice with RIPA buffer and once with PBS; proteins were eluted with Laemmli sample buffer and separated by 10% SDS-PAGE. The gel was incubated in fixative (40% methanol, 7.5% acetic acid, and 10% glycerol) for 30 min, dried using a Model 583 Gel Dryer with hydroTechTM Pump (Bio-Rad) for 2 h and exposed with the HyBlot ES Autoradiography film (Denville Scientific Inc., South Plain Field, NJ) at −80 °C overnight. The film was developed in the Konica Minolta SRX-101A processor (Ontario, Canada).
Western Blotting
Cells were lysed in RIPA lysis buffer and protein concentration was measured with Pierce BCA Protein assay reagent (Thermo Scientific, Rockford, IL). Samples (usually, 40 μg per lane) were separated by SDS-PAGE and transferred onto an Immobilon-P-membrane (Millipore Corp, Bedford, MA). The membrane was blocked in 5% BSA in PBS with 0.5% Tween 20 for 1 h and incubated overnight with specific antibodies at 4 °C. Next day, membrane was washed three times in PBS with 0.5% Tween-20 and incubated for 1 h at room temperature with horseradish peroxidase-conjugated secondary antibody. The membrane was washed extensively, and the protein bands were visualized with the enhanced chemiluminescence substrate kit (PerkinElmer Life Sciences, Boston, MA) using a Bio-Rad ChemiDoc Image Station (Hercules, CA).
TG Staining
Cells were washed with PBS and fixed with formaldehyde (3.7%) in phosphate-buffered saline (pH 7.4) for 15–20 min. Fixed cells were stained with Oil Red O solution (60:40 v/v dilution in water) for 1 h, followed by two washes with water. Alternatively, cells growing on poly-l-lysine coated coverslips (Neuvitro, Germany) were fixed and stained with BoDiPY 493/503 (Life Technologies). A stock 1000× solution of BoDIPY 493/503 was prepared at the concentration 1 mg/ml in ethanol and stored at −20 °C in the dark. Cells were incubated with BoDIPY diluted in PBS for 30 min with gentle shaking, washed three times with PBS, and mounted on slides using Prolong Gold Antifade mounting media with DAPI (Life Technologies). Slides were examined with the help of the Axio Observer Z1 fluorescence microscope equipped with C10600/ORCA-R2 digital camera (Hamamatsu, Japan) and AxioVision 4.8.1 (Carl Zeiss, Thornwood, NY).
Statistics
Student's paired two-tailed t test was used to evaluate the statistical significance of the results.
RESULTS
Fig. 1A shows that the activity of the Egr1 promoter in HEK 293 cells is increased by insulin in a PD98059-dependent fashion suggesting that the Erk-mediated pathway plays a major role in the regulation of Egr1 transcription by insulin. Correspondingly, treatment of 3T3-L1 adipocytes with insulin causes a significant increase in the Egr1 mRNA and protein (see also (14, 24, 25)). Surprisingly, PD98059, while completely blocking Erk activation and preventing a rise in the Egr1 mRNA, has only a 20% effect on insulin-stimulated increase in the Egr1 protein (Figs. 1, B and C).
FIGURE 1.
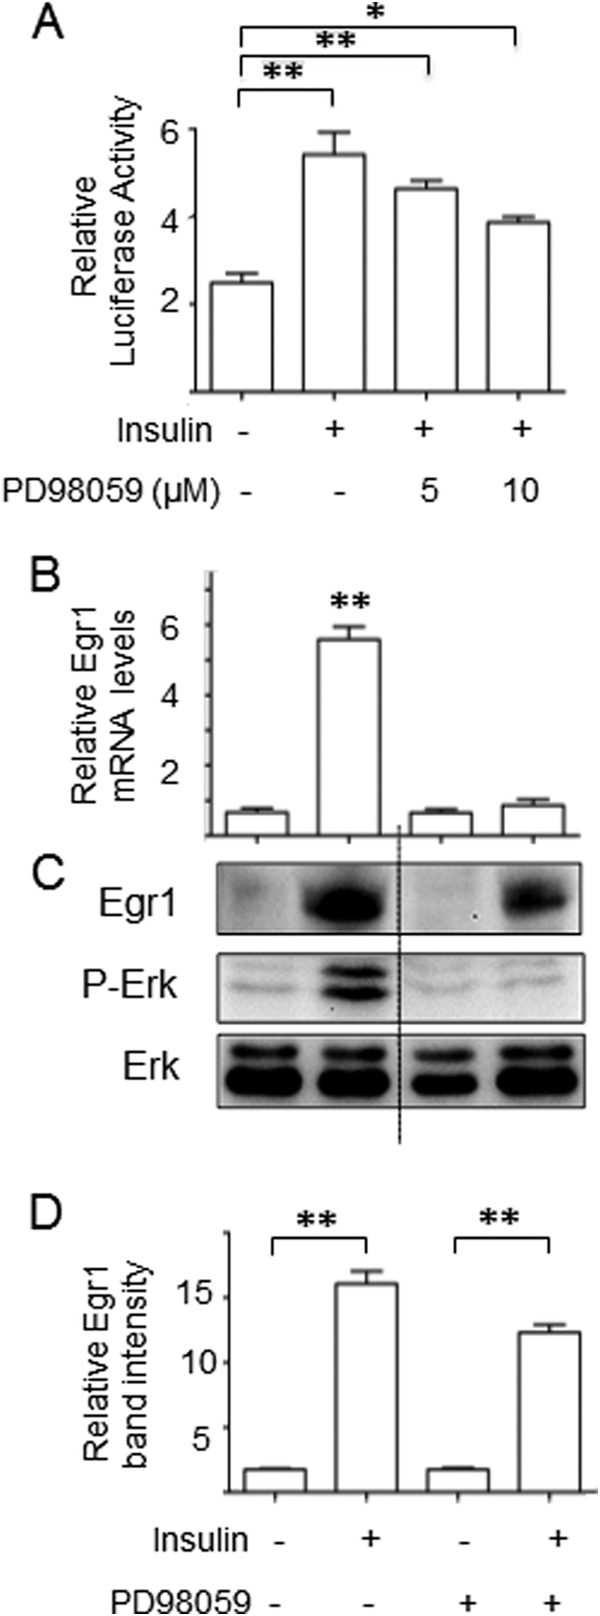
In cultured adipocytes, Egr1 mRNA but not protein is regulated by the Erk pathway. A, HEK293T cells were transfected with the Egr1 promoter luciferase construct along with the pEGFP-N1 vector (0.1 μg). After 24 h, transfected cells were treated with insulin (100 nm) and indicated amounts of PD98059. After another 24 h, cells were harvested in reporter lysis buffer and luciferase activity in cell lysates was assayed as described under “Experimental Procedures” and normalized by eGFP fluorescence. Experiments were repeated three times and the data are presented for triplicate samples as mean ± S.D. B—D, 3T3-L1 adipocytes were serum starved for 4 h and treated with insulin (100 nm) and PD98059 (10 μm) for 4 h. Egr1 mRNA was analyzed by qPCR and normalized by GAPDH (panel B), and Egr1 protein was examined by Western blotting along with total and phospho-Erk (panel C). The dotted line indicates that irrelevant lanes have been spliced out. Panel D shows quantification of Western blot results obtained in three independent experiments. Results are presented as mean ± S.D. *, p < 0.05; **, p < 0.01.
On the contrary, the mTORC1 inhibitors, rapamycin and even more so PP242, dramatically suppress expression of the Egr1 protein but have an opposite action on the Egr1 mRNA (Fig. 2). We suggest that the latter effect may be related to the well-known inhibitory role of mTORC1 in insulin signaling described by us and others (29–36), so that inhibition of mTORC1 potentiates insulin action. In fact, a recent paper has demonstrated that PP242 activates Erk in multiple myeloma cells (37).
FIGURE 2.
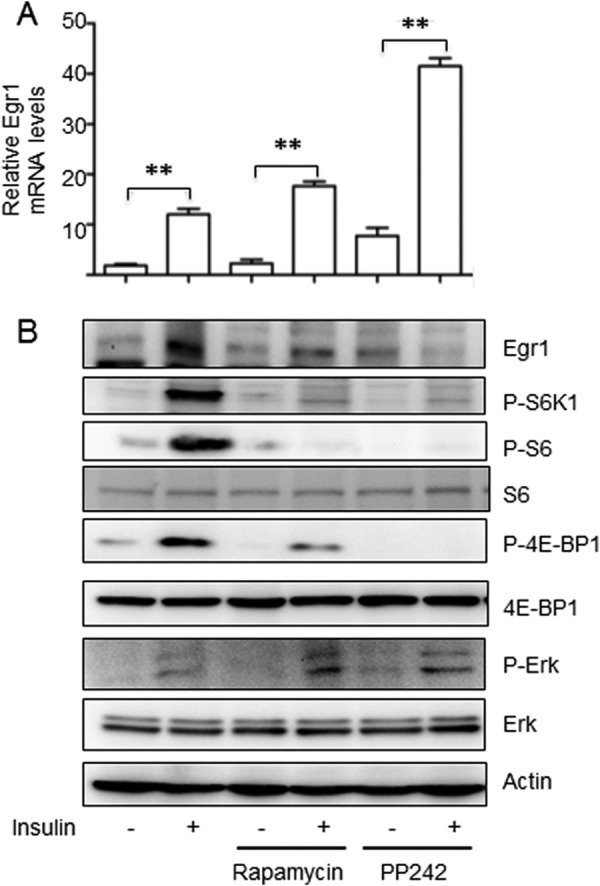
In cultured adipocytes, Egr1 protein but not Egr1 mRNA is suppressed by mTORC1 inhibitors. 3T3-L1 adipocytes were serum starved for 4 h and treated with insulin (100 nm), rapamycin (100 nm), and PP242 (15 μm) for 4 h. Egr1 mRNA was analyzed by qPCR and normalized by GAPDH (panel A), and Egr1 and other proteins were examined by Western blotting (panel B). Experiments were repeated three times and the data are presented for triplicate samples as mean ± S.D.; **, p < 0.01.
To further explore the role of mTORC1 in the expression of Egr1, we have measured levels of Egr1 mRNA and protein in TSC2-null MEFs that have hyperactive mTORC1 (38). We have found that these cells have higher levels of the Egr1 protein despite the lower levels of Egr1 mRNA (Fig. 3, A and B). Of note, the activity of the Egr1 promoter is higher in TSC2 null MEFs in comparison to wild type cells (Fig. 3C). This moderate increase may be attributed, at least in part, to elevated levels of Egr1 in TSC2-null MEFs, since Egr1 can increase activity of its own promoter (Fig. 3D). To clarify a discrepancy between the activity of the Egr1 promoter and levels of cognate mRNA, we measured its stability in wild type and TSC2-null MEFs. We found that the Egr1 mRNA is significantly less stable in latter cells (Fig. 3E), which may explain data shown in Fig. 3A.
FIGURE 3.

Expression of the Egr1 mRNA and protein in TSC2−/− and control MEFs. Egr1 expression in WT and TSC2−/− MEFs was examined by qPCR and normalized by GAPDH (panel A) and Western blotting (panel B). Egr1 promoter activity was analyzed in WT and TSC2−/− MEFs (panel C). Activity of the Egr1 promoter was analyzed in HEK293T cells co-transfected with indicated amounts of the Egr1 cDNA (panel D). WT and TSC2−/− MEFs were treated with 0.2 μg/ml Actinomycin D for the indicated periods of time, levels of the Egr1 mRNA were determined by qPCR and normalized to GAPDH mRNA. The data are presented as a percentage of the Egr1 mRNA at time 0 before adding actinomycin D (panel E). Structure of the 5′-UTR of human Egr1 mRNA (panel F). WT and TSC2−/− MEFs were treated (black bars) or not treated (white bars) with insulin (100 nm) for 1 h, and cell extracts (500 μg) were immunoprecipitated with 2 μg of rabbit antibody against 4E-BP1 or nonspecific rabbit IgG and 40 μl of sheep anti-rabbit Dynabeads. RNA was isolated from immunoprecipitated samples, and Egr1 mRNA was measured in 4E-BP1- and Ig-bound material by qPCR; nonspecific (IgG-bound) values were subtracted from those associated with 4E-BP1 (panel G). All panels show representative results of at least three independent experiments; *, p < 0.05.
One hypothesis that can potentially explain our results is that mTORC1 increases expression of Egr1 primarily at the level of translation. In support of this idea, we have observed that the 5′-UTR of the Egr1 mRNA has a high degree of the secondary structure (Fig. 3F) with the estimated folding energy 103.56 kcal/mol as predicted by the RNAfold program Vienna RNA Package. Thus, translation of the Egr1 mRNA should require an mRNA helicase, such as eIF-4A (39). Furthermore, the 5′-UTR of the Egr1 mRNA contains several CCCC/GCGCCC motifs that represent a recently discovered hallmark of eIF-4A-dependent transcripts (40).
eIF-4A, along with the scaffold eIF-4G and the cap-binding protein eIF-4E, form the multi-subunit complex eIF-4F which is recruited to mRNA via the interaction between its cap structure and eIF-4E. Activity of the latter is controlled by the inhibitory eIF-4E-binding proteins (4E-BPs 1 & 2) that, in turn, are phosphorylated and inactivated by mTORC1 (41). Thus, according to our hypothesis, translation of the Egr1 mRNA should be regulated by mTORC1 via the 4E-BP1/2-mediated pathway. To test this idea, we immunoprecipitated the Egr1 mRNA using the antibody against 4E-BP1 from wild type and TSC2 null MEFs treated and not treated with insulin (Fig. 3G). We found that, under basal conditions (white bars), significantly less Egr1 mRNA is associated with 4E-BP1 in TSC2 null MEFs, than in wild type control, and insulin administration (black bars) decreases 4E-BP1 binding to the Egr1 mRNA in both cell types.
Next, we analyzed the expression of Egr1 mRNA and protein in 4E-BP1/2 double knock out (DKO) MEFs (26). Similar to TSC2 null MEFs, DKO MEFs have lower levels of the Egr1 mRNA and higher levels of the Egr1 protein than wild type controls (Fig. 4, A and B). We then studied the rate of protein biosynthesis in control and DKO MEFs by 35S labeling. As expected, incorporation of radioactive precursors into the total protein fraction was higher in the latter case (Fig. 4C) although no apparent qualitative changes in the set of de novo synthesized proteins were detected (Fig. 4D). Nonetheless, the efficiency of Egr1 translation was much higher in DKO MEFs than in wild type MEFs (Fig. 4E). Interestingly, insulin stimulates Egr1 transcription in DKO cells, but has only a small effect on the Egr1 protein (Fig. 4, F and G), probably because it is already close to its maximum level due to the ablation of 4E-BP1/2. Thus, our data strongly suggest that mTORC1 activates translation of Egr1 mRNA via the 4E-BP-mediated mechanism. In general, it appears that to increase the expression of Egr1 in adipocytes, insulin activates two independent signaling pathways simultaneously: the Erk-mediated pathway that up-regulates the Egr1 mRNA (Fig. 1), and the mTORC1–4E-BP mediated pathway that enhances its translation (Figs. 3 and 4).
FIGURE 4.
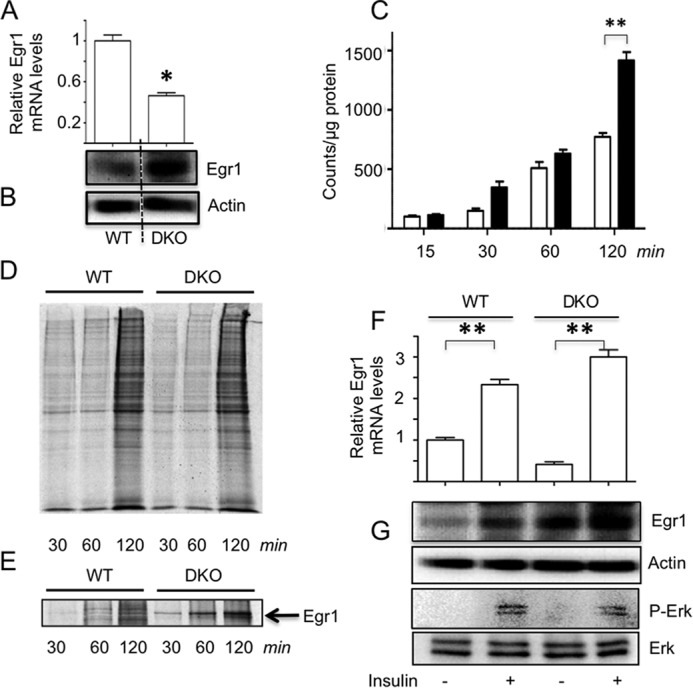
Expression of Egr1 is controlled at the level of translation by the mTORC1–4E-BP1/2 axis. Egr1 expression in WT and DKO MEFs was measured by qPCR and normalized by GAPDH (panel A) and Western blotting (panel B). WT (white bars) and DKO MEFs (black bars) were labeled with [35S]methionine/cysteine for the indicated periods of time, and 35S incorporation into the total protein fraction was measured by TCA precipitation (panel C) and SDS-PAGE followed by autoradiography (panel D). 35S incorporation into Egr1 immunoprecipitated from total cell lysates (500 μg) with 2 μg of the antibody and 40 μl of Dynabeads was analyzed by SDS-PAGE and autoradiography (panel E). WT and DKO MEFs were treated with insulin (100 nm) for 4 h. Egr1 mRNA was analyzed by qPCR and normalized by GAPDH (panel F), and Egr1 protein was examined by Western blotting (panel G). All panels show representative results of three independent experiments; *, p < 0.05; **, p < 0.01.
Still, the inhibitory analysis shown in Figs. 1 and 2 suggests that the mTORC1-mediated pathway plays a more important role in the regulation of Egr1 expression by insulin, than transcriptional control. To test this idea, we have identified a compound that increases Egr1 mRNA but, unlike insulin, does not up-regulate mTORC1. This drug is the selective agonist of the abundantly expressed in adipocytes cannabinoid receptors CB1, ACEA. In cultured 3T3-L1 adipocytes, ACEA and insulin have a similar effect on the Egr1 mRNA (Fig. 5A). However, ACEA has no effect on the activity of mTORC1 hence expression of the Egr1 protein (Fig. 5B).
FIGURE 5.
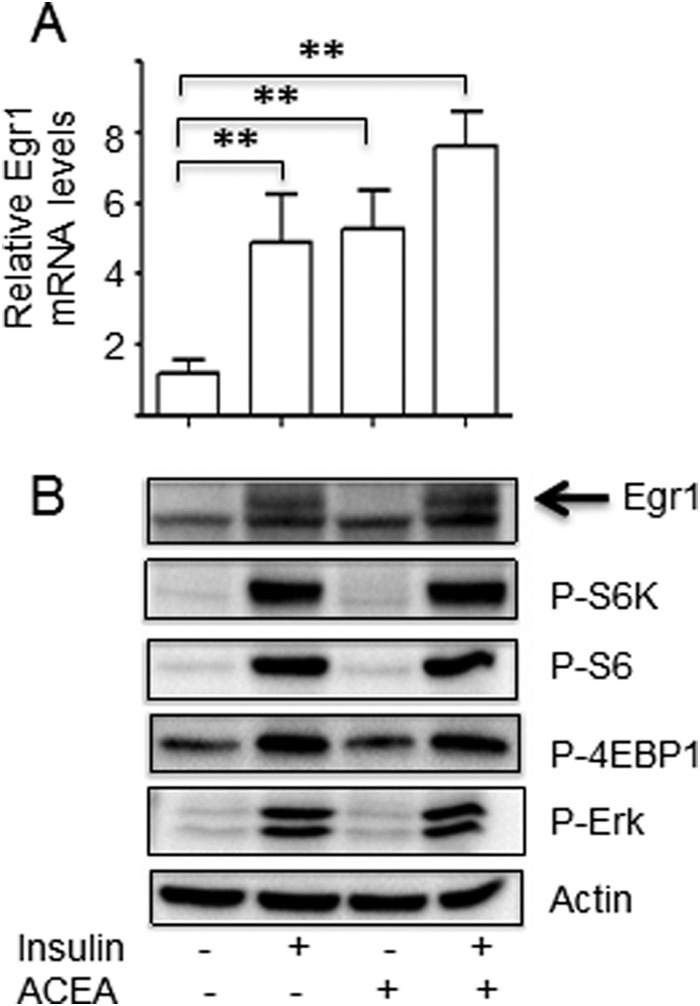
Up-regulation of the Egr1 mRNA without activation of mTORC1 is not sufficient to increase expression of the Egr1 protein. Adipocytes were serum starved for 4 h and treated with insulin (100 nm) and ACEA (2 μm) for 4 h. Egr1 mRNA was analyzed by qPCR and normalized by GAPDH (panel A). Egr1 and other proteins were examined by Western blotting (panel B). Representative results of at least three independent experiments are shown; **, p < 0.01.
As we have recently shown, Egr1 directly binds to the ATGL promoter and inhibits ATGL expression suppressing lipolysis and promoting triglyceride accumulation (14). Therefore, Egr1-rich DKO MEFs should express less ATGL and contain more fat, than control cells. Indeed, we have found that the activity of the ATGL promoter (Fig. 6A) as well as the content of the ATGL mRNA (Fig. 6B) and protein (Fig. 6C) in DKO MEFs is decreased, while fat storage in these cells is increased (Fig. 6D) in comparison to wild type MEFs. Since expression of the adipogenic transcription factors C/EBPα and PPARγ and the adipogenic marker FSP27 is not altered in DKO MEFs in comparison to wild type cells (Fig. 6C), we suggest that accumulation of fat in DKO MEFs takes place regardless of differences in cell differentiation induced by the ablation of 4E-BP1/2 (26) and is mediated by the Egr1-mediated decrease in ATGL expression. Thus, we knocked down Egr1 in DKO MEFs with the help of siRNA. As expected, treatment with Egr1 siRNA lead to a significant increase in ATGL expression (Fig. 6E) and a corresponding decrease in fat accumulation in cells (Fig. 6F). Based on these results, we conclude that the newly discovered regulatory connection between 4E-BP1/2, Egr1, and ATGL links mTORC1 to TG storage.
FIGURE 6.
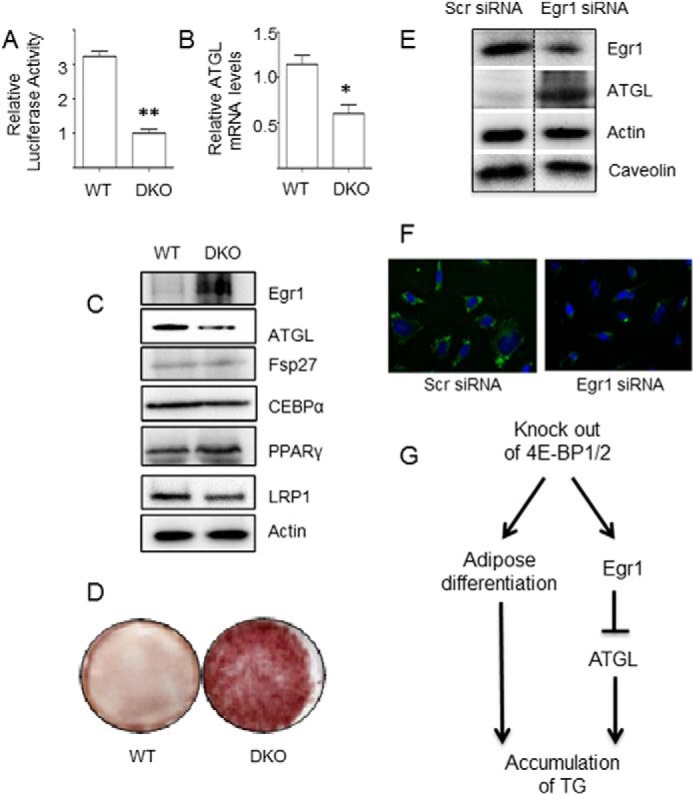
Undifferentiated DKO MEFs express less ATGL and accumulate more fat than control cells. Activity of the ATGL promoter was examined in wild type and DKO MEFs as described under “Experimental Procedures” (panel A). ATGL mRNA was analyzed in wild type and DKO MEFs by qPCR and normalized by GAPDH (panel B). Wild type and DKO MEFs were cultured for 7 days after confluency in 60-mm dishes, and protein content in cell lysates was analyzed by Western blotting (panel C). Wild type and DKO MEFs were cultured for 7 days after confluency, and TG content in cells was analyzed by Oil Red staining (panel D). DKO MEFs were cultured in 60-mm dishes until confluency, transfected with Egr1 specific or scrambled siRNA, and analyzed by Western blotting (40 μg per lane) 72 h after transfection. The dotted line indicates that irrelevant lanes have been spliced out (panel E). 48 h after transfection, cells were trypsinized and plated on coverslips for another 24 h. After that, cells were washed three times with PBS and stained with BoDiPY (green) and DAPI (blue) (panel F). Knock-out of 4E-BP1/2 promote fat accumulation by increasing adipose differentiation (26) and via the Egr1-ATGL axis (this report) (panel G). Panels A–F show representative results of at least two independent experiments; *, p < 0.05; **, p < 0.01.
DISCUSSION
The emerging role of mTORC1 in lipid homeostasis has captured the attention of many labs involved in the metabolic research (42, 43). In particular, we have recently shown that mTORC1 mediates the effect of insulin on lipolysis in mammalian adipocytes by suppressing the expression of the rate-limiting lipase, ATGL, at the level of transcription (6). Importantly, the regulatory connection between TOR and ATGL orthologs is conserved in evolution from yeast (14) through Drosophila (44, 45) to mammals (6), and as such should be essential for the regulation of metabolism. In S. cerevisiae, the effect of TOR on the expression of the functional ortholog of ATGL, Tgl4p, is mediated by the transcription factor Msn4p, and in mammalian cells this function belongs to the Msn4p homologue Egr1 (14).
Regulation of Egr1 (16–18) just like other primary response genes (15) is thought to take place at the level of transcription. In line with this concept, we have previously shown that TOR increases transcription of Msn4 in S. cerevisiae (14). Therefore, we have first thought that in adipocytes, mTORC1 controls expression of Egr1 also at the level of transcription. This, however, proved not to be the case (Figs. 2A and 3, A–E). Instead, we have found that mTORC1 increases translation of the Egr1 protein via the 4E-BP1/2-mediated pathway. To the best of our knowledge, we present the first evidence for the role of mTORC1 in the control of Egr1 expression. At the same time, mTORC1 is known to regulate translation of c-Myc (46, 47), c-Fos (48), and other primary response proteins (49). These observations establish the role of mTORC1 in the formation of primary and stress response (50–52).
A legitimate question is why the effect of mTORC1 on the well-studied Egr1 expression has not been uncovered in other cell types? One explanation is that, in other cells, mTORC1 plays only a permissive role in the Egr1 expression, whereas in adipocytes and MEFs, its role is the rate-limiting. In other words, we think that cell specific variations in the activity of signaling pathways that control transcription and translation are crucial for the control of Egr1 expression.
Our findings shed new light on the molecular mechanisms that underlie the role of mTORC1 in the regulation of obesity and lipid metabolism. Thus, Le Bacquer et al. have reported that combined genetic ablation of 4E-BP1 and 4E-BP2 increases adiposity in mice on normal and high fat diet in vivo (26). Interestingly, basal triglyceride biosynthesis did not change in DKO mice, whereas basal lipolysis was significantly lower despite absence of detectable changes in catecholamine-regulated hormone-sensitive lipase and perilipin. The authors have concluded that reduced lipolysis could be a major contributing factor to the development of obesity in DKO mice, although the molecular mechanism of this effect remained obscure. Here, we have shown that the link between knock-out of 4E-BP1/2, down-regulation of lipolysis, and fat accumulation is likely to be explained by the Egr1-mediated inhibition of ATGL expression. Indeed, previous studies have reliably established that ATGL is responsible for the bulk of triacylglycerol hydrolase activity in various cells and represents the rate-limiting lipolytic enzyme. In other words, in every experimental model tested thus far, including DKO MEFs analyzed in this report, attenuated ATGL expression decreases lipolysis and promotes fat storage while elevated ATGL expression increases lipolysis and decreases the size of TG stores (6, 11–13, 53–59).
In addition to suppression of lipolysis, Le Bacquer et al. have uncovered another reason for the elevated TG accumulation in DKO null MEFs: an increased adipose differentiation (26). Importantly, conversion of pre-adipocytes to fully differentiated adipocytes in vitro requires specific culturing conditions used by Le Bacquer et al., but not in our study. In fact, our results shown in Fig. 6C demonstrate that, under our experimental conditions, expression levels of the key differentiation transcription factors, C/EBPα and PPARγ and other markers of differentiation, such as FSP27, in DKO and WT cells are similar. Furthermore, elevated expression of Egr1 has been associated with decreased differentiation of cultured adipocytes (20). Therefore, 4E-BP1/2 may control fat accumulation via two independent mechanisms: by changing adipose differentiation (26) and via the Egr1-ATGL axis described in this report (Fig. 6G).
Acknowledgment
We thank Harun Thimmiah (Boston University Medical School) for help with several experiments.
Note Added in Proof
In the version of this article that was published on March 26, 2015 as a Paper in Press, Fig. 4, B and G, did not conform with the JBC policy that figures assembled from separate images should indicate the borders between the images. Furthermore, the image representing actin in WT cells treated with insulin was mistakenly reused to represent actin from DKO cells treated without insulin in Fig. 4B. These errors have been corrected. This correction does not change the interpretation of the results or the conclusions.
This work was supported by Research Grants DK52057 and AG039612 from the National Institutes of Health, and Research Grant 7-11-BS-76 from the American Diabetes Association (to K. V. K.).
- TG
- triglyceride
- mTOR
- mammalian target of rapamycin
- EGR
- early growth response protein
- ATGL
- adipose triglyceride lipase
- UTR
- untranslated region
- DKO
- double knock-out.
REFERENCES
- 1. Unger R. H., Clark G. O., Scherer P. E., Orci L. (2010) Lipid homeostasis, lipotoxicity and the metabolic syndrome. Biochim. Biophys. Acta 1801, 209–214 [DOI] [PubMed] [Google Scholar]
- 2. Brookheart R. T., Michel C. I., Schaffer J. E. (2009) As a matter of fat. Cell Metab. 10, 9–12 [DOI] [PMC free article] [PubMed] [Google Scholar]
- 3. Guilherme A., Virbasius J. V., Puri V., Czech M. P. (2008) Adipocyte dysfunctions linking obesity to insulin resistance and type 2 diabetes. Nat. Rev. Mol. Cell Biol. 9, 367–377 [DOI] [PMC free article] [PubMed] [Google Scholar]
- 4. Savage D. B., Petersen K. F., Shulman G. I. (2007) Disordered lipid metabolism and the pathogenesis of insulin resistance. Physiol. Rev. 87, 507–520 [DOI] [PMC free article] [PubMed] [Google Scholar]
- 5. McGarry J. D. (2002) Banting lecture 2001: dysregulation of fatty acid metabolism in the etiology of type 2 diabetes. Diabetes 51, 7–18 [DOI] [PubMed] [Google Scholar]
- 6. Chakrabarti P., English T., Shi J., Smas C. M., Kandror K. V. (2010) The mTOR complex 1 suppresses lipolysis, stimulates lipogenesis and promotes fat storage. Diabetes 59, 775–781 [DOI] [PMC free article] [PubMed] [Google Scholar]
- 7. Dibble C. C., Manning B. D. (2013) Signal integration by mTORC1 coordinates nutrient input with biosynthetic output. Nature Cell Biology 15, 555–564 [DOI] [PMC free article] [PubMed] [Google Scholar]
- 8. Howell J. J., Manning B. D. (2011) mTOR couples cellular nutrient sensing to organismal metabolic homeostasis. Trends Endocrinol. Metab. 22, 94–102 [DOI] [PMC free article] [PubMed] [Google Scholar]
- 9. Zoncu R., Efeyan A., Sabatini D. M. (2010) mTOR: from growth signal integration to cancer, diabetes and ageing. Nat. Rev. Mol. Cell Biol. 12, 21–35 [DOI] [PMC free article] [PubMed] [Google Scholar]
- 10. Taniguchi C. M., Emanuelli B., Kahn C. R. (2006) Critical nodes in signalling pathways: insights into insulin action. Nat. Rev. Mol. Cell Biol. 7, 85–96 [DOI] [PubMed] [Google Scholar]
- 11. Zimmermann R., Strauss J. G., Haemmerle G., Schoiswohl G., Birner-Gruenberger R., Riederer M., Lass A., Neuberger G., Eisenhaber F., Hermetter A., Zechner R. (2004) Fat mobilization in adipose tissue is promoted by adipose triglyceride lipase. Science 306, 1383–1386 [DOI] [PubMed] [Google Scholar]
- 12. Villena J. A., Roy S., Sarkadi-Nagy E., Kim K. H., Sul H. S. (2004) Desnutrin, an adipocyte gene encoding a novel patatin domain-containing protein, is induced by fasting and glucocorticoids: ectopic expression of desnutrin increases triglyceride hydrolysis. J. Biol. Chem. 279, 47066–47075 [DOI] [PubMed] [Google Scholar]
- 13. Jenkins C. M., Mancuso D. J., Yan W., Sims H. F., Gibson B., Gross R. W. (2004) Identification, cloning, expression, and purification of three novel human calcium-independent phospholipase A2 family members possessing triacylglycerol lipase and acylglycerol transacylase activities. J. Biol. Chem. 279, 48968–48975 [DOI] [PubMed] [Google Scholar]
- 14. Chakrabarti P., Kim J. Y., Singh M., Shin Y. K., Kim J., Kumbrink J., Wu Y., Lee M. J., Kirsch K. H., Fried S. K., Kandror K. V. (2013) Insulin inhibits lipolysis in adipocytes via the evolutionary conserved mTORC1-Egr1-ATGL-mediated pathway. Mol. Cell. Biol. 33, 3659–3666 [DOI] [PMC free article] [PubMed] [Google Scholar]
- 15. Fowler T., Sen R., Roy A. L. (2011) Regulation of primary response genes. Mol. Cell 44, 348–360 [DOI] [PMC free article] [PubMed] [Google Scholar]
- 16. Pagel J. I., Deindl E. (2011) Early growth response 1–a transcription factor in the crossfire of signal transduction cascades. Ind. J. Biochem. Biophys. 48, 226–235 [PubMed] [Google Scholar]
- 17. Thiel G., Cibelli G. (2002) Regulation of life and death by the zinc finger transcription factor Egr-1. J. Cell Physiol. 193, 287–292 [DOI] [PubMed] [Google Scholar]
- 18. Thiel G., Mayer S. I., Müller I., Stefano L., Rössler O. G. (2010) Egr-1-A Ca(2+)-regulated transcription factor. Cell Calcium 47, 397–403 [DOI] [PubMed] [Google Scholar]
- 19. Brand E., Herrmann S. M., Nicaud V., Evans A., Ruidavets J. B., Arveiler D., Luc G., Cambien F., Soubrier F. (2000) Identification of two polymorphisms in the early growth response protein-1 gene: possible association with lipid variables. J. Mol. Med. 78, 81–86 [DOI] [PubMed] [Google Scholar]
- 20. Boyle K. B., Hadaschik D., Virtue S., Cawthorn W. P., Ridley S. H., O'Rahilly S., Siddle K. (2009) The transcription factors Egr1 and Egr2 have opposing influences on adipocyte differentiation. Cell Death Differ. 16, 782–789 [DOI] [PMC free article] [PubMed] [Google Scholar]
- 21. Müller I., Rössler O. G., Wittig C., Menger M. D., Thiel G. (2012) Critical role of Egr transcription factors in regulating insulin biosynthesis, blood glucose homeostasis, and islet size. Endocrinology 153, 3040–3053 [DOI] [PubMed] [Google Scholar]
- 22. Shen N., Yu X., Pan F. Y., Gao X., Xue B., Li C. J. (2011) An early response transcription factor, egr-1, enhances insulin resistance in type 2 diabetes with chronic hyperinsulinism. J. Biol. Chem. 286, 14508–14515 [DOI] [PMC free article] [PubMed] [Google Scholar]
- 23. Gokey N. G., Lopez-Anido C., Gillian-Daniel A. L., Svaren J. (2011) Early growth response 1 (egr1) regulates cholesterol biosynthetic gene expression. J. Biol. Chem. 286, 29501–29510 [DOI] [PMC free article] [PubMed] [Google Scholar]
- 24. Alexander-Bridges M., Buggs C., Giere L., Denaro M., Kahn B., White M., Sukhatme V., Nasrin N. (1992) Models of insulin action on metabolic and growth response genes. Mol. Cell. Biochem. 109, 99–105 [DOI] [PubMed] [Google Scholar]
- 25. Sartipy P., Loskutoff D. J. (2003) Expression profiling identifies genes that continue to respond to insulin in adipocytes made insulin-resistant by treatment with tumor necrosis factor-α. J. Biol. Chem. 278, 52298–52306 [DOI] [PubMed] [Google Scholar]
- 26. Le Bacquer O., Petroulakis E., Paglialunga S., Poulin F., Richard D., Cianflone K., Sonenberg N. (2007) Elevated sensitivity to diet-induced obesity and insulin resistance in mice lacking 4E-BP1 and 4E-BP2. J. Clin. Invest. 117, 387–396 [DOI] [PMC free article] [PubMed] [Google Scholar]
- 27. Zhang H. H., Lipovsky A. I., Dibble C. C., Sahin M., Manning B. D. (2006) S6K1 regulates GSK3 under conditions of mTOR-dependent feedback inhibition of Akt. Mol. Cell 24, 185–197 [DOI] [PMC free article] [PubMed] [Google Scholar]
- 28. Kim J. Y., Tillison K., Lee J. H., Rearick D. A., Smas C. M. (2006) The adipose tissue triglyceride lipase ATGL/PNPLA2 is downregulated by insulin and TNF-alpha in 3T3-L1 adipocytes and is a target for transactivation by PPARgamma. Am. J. Physiol. Endocrinol. Metab. 291, E115–E127 [DOI] [PubMed] [Google Scholar]
- 29. Tremblay F., Gagnon A., Veilleux A., Sorisky A., Marette A. (2005) Activation of the mammalian target of rapamycin pathway acutely inhibits insulin signaling to Akt and glucose transport in 3T3-L1 and human adipocytes. Endocrinology 146, 1328–1337 [DOI] [PubMed] [Google Scholar]
- 30. Tremblay F., Marette A. (2001) Amino acid and insulin signaling via the mTOR/p70 S6 kinase pathway. A negative feedback mechanism leading to insulin resistance in skeletal muscle cells. J. Biol. Chem. 276, 38052–38060 [DOI] [PubMed] [Google Scholar]
- 31. Um S. H., Frigerio F., Watanabe M., Picard F., Joaquin M., Sticker M., Fumagalli S., Allegrini P. R., Kozma S. C., Auwerx J., Thomas G. (2004) Absence of S6K1 protects against age- and diet-induced obesity while enhancing insulin sensitivity. Nature 431, 200–205 [DOI] [PubMed] [Google Scholar]
- 32. Harrington L. S., Findlay G. M., Gray A., Tolkacheva T., Wigfield S., Rebholz H., Barnett J., Leslie N. R., Cheng S., Shepherd P. R., Gout I., Downes C. P., Lamb R. F. (2004) The TSC1–2 tumor suppressor controls insulin-PI3K signaling via regulation of IRS proteins. J. Cell Biol. 166, 213–223 [DOI] [PMC free article] [PubMed] [Google Scholar]
- 33. Tzatsos A., Kandror K. V. (2006) Nutrients suppress phosphatidylinositol 3-kinase/Akt signaling via raptor-dependent mTOR-mediated insulin receptor substrate-1 phosphorylation. Mol. Cell. Biol. 26, 63–76 [DOI] [PMC free article] [PubMed] [Google Scholar]
- 34. Ge Y., Yoon M. S., Chen J. (2011) Raptor and Rheb negatively regulate skeletal myogenesis through suppression of insulin receptor substrate 1 (IRS1). J. Biol. Chem. 286, 35675–35682 [DOI] [PMC free article] [PubMed] [Google Scholar]
- 35. Hsu P. P., Kang S. A., Rameseder J., Zhang Y., Ottina K. A., Lim D., Peterson T. R., Choi Y., Gray N. S., Yaffe M. B., Marto J. A., Sabatini D. M. (2011) The mTOR-regulated phosphoproteome reveals a mechanism of mTORC1-mediated inhibition of growth factor signaling. Science 332, 1317–1322 [DOI] [PMC free article] [PubMed] [Google Scholar]
- 36. Yu Y., Yoon S. O., Poulogiannis G., Yang Q., Ma X. M., Villén J., Kubica N., Hoffman G. R., Cantley L. C., Gygi S. P., Blenis J. (2011) Phosphoproteomic analysis identifies Grb10 as an mTORC1 substrate that negatively regulates insulin signaling. Science 332, 1322–1326 [DOI] [PMC free article] [PubMed] [Google Scholar]
- 37. Hoang B., Benavides A., Shi Y., Yang Y., Frost P., Gera J., Lichtenstein A. (2012) The PP242 mammalian target of rapamycin (mTOR) inhibitor activates extracellular signal-regulated kinase (ERK) in multiple myeloma cells via a target of rapamycin complex 1 (TORC1)/eukaryotic translation initiation factor 4E (eIF-4E)/RAF pathway and activation is a mechanism of resistance. J. Biol. Chem. 287, 21796–21805 [DOI] [PMC free article] [PubMed] [Google Scholar]
- 38. Huang J., Manning B. D. (2008) The TSC1-TSC2 complex: a molecular switchboard controlling cell growth. Biochem. J. 412, 179–190 [DOI] [PMC free article] [PubMed] [Google Scholar]
- 39. Parsyan A., Svitkin Y., Shahbazian D., Gkogkas C., Lasko P., Merrick W. C., Sonenberg N. (2011) mRNA helicases: the tacticians of translational control. Nat. Rev. Mol. Cell Biol. 12, 235–245 [DOI] [PubMed] [Google Scholar]
- 40. Wolfe A. L., Singh K., Zhong Y., Drewe P., Rajasekhar V. K., Sanghvi V. R., Mavrakis K. J., Jiang M., Roderick J. E., Van der Meulen J., Schatz J. H., Rodrigo C. M., Zhao C., Rondou P., de Stanchina E., Teruya-Feldstein J., Kelliher M. A., Speleman F., Porco J. A., Jr., Pelletier J., Rätsch G., Wendel H. G. (2014) RNA G-quadruplexes cause eIF4A-dependent oncogene translation in cancer. Nature 513, 65–70 [DOI] [PMC free article] [PubMed] [Google Scholar]
- 41. Gingras A. C., Raught B., Sonenberg N. (2001) Regulation of translation initiation by FRAP/mTOR. Genes Dev. 15, 807–826 [DOI] [PubMed] [Google Scholar]
- 42. Lamming D. W., Sabatini D. M. (2013) A Central role for mTOR in lipid homeostasis. Cell Metab. 18, 465–469 [DOI] [PMC free article] [PubMed] [Google Scholar]
- 43. Ricoult S. J., Manning B. D. (2013) The multifaceted role of mTORC1 in the control of lipid metabolism. EMBO Reports 14, 242–251 [DOI] [PMC free article] [PubMed] [Google Scholar]
- 44. Luong N., Davies C. R., Wessells R. J., Graham S. M., King M. T., Veech R., Bodmer R., Oldham S. M. (2006) Activated FOXO-mediated insulin resistance is blocked by reduction of TOR activity. Cell Metab. 4, 133–142 [DOI] [PubMed] [Google Scholar]
- 45. Birse R. T., Choi J., Reardon K., Rodriguez J., Graham S., Diop S., Ocorr K., Bodmer R., Oldham S. (2010) High-fat-diet-induced obesity and heart dysfunction are regulated by the TOR pathway in Drosophila. Cell Metab. 12, 533–544 [DOI] [PMC free article] [PubMed] [Google Scholar]
- 46. Csibi A., Lee G., Yoon S. O., Tong H., Ilter D., Elia I., Fendt S. M., Roberts T. M., Blenis J. (2014) The mTORC1/S6K1 Pathway Regulates Glutamine Metabolism through the eIF4B-Dependent Control of c-Myc Translation. Curr. Biol. 24, 2274–2280 [DOI] [PMC free article] [PubMed] [Google Scholar] [Retracted]
- 47. West M. J., Stoneley M., Willis A. E. (1998) Translational induction of the c-myc oncogene via activation of the FRAP/TOR signalling pathway. Oncogene 17, 769–780 [DOI] [PubMed] [Google Scholar]
- 48. Takeuchi K., Shibamoto S., Nagamine K., Shigemori I., Omura S., Kitamura N., Ito F. (2001) Signaling pathways leading to transcription and translation cooperatively regulate the transient increase in expression of c-Fos protein. J. Biol. Chem. 276, 26077–26083 [DOI] [PubMed] [Google Scholar]
- 49. Vesely P. W., Staber P. B., Hoefler G., Kenner L. (2009) Translational regulation mechanisms of AP-1 proteins. Mutation Research 682, 7–12 [DOI] [PubMed] [Google Scholar]
- 50. Aramburu J., Ortells M. C., Tejedor S., Buxadé M., López-Rodriguez C. (2014) Transcriptional regulation of the stress response by mTOR. Sci. Signal 7, re2. [DOI] [PubMed] [Google Scholar]
- 51. Laplante M., Sabatini D. M. (2013) Regulation of mTORC1 and its impact on gene expression at a glance. J. Cell Sci. 126, 1713–1719 [DOI] [PMC free article] [PubMed] [Google Scholar]
- 52. Sengupta S., Peterson T. R., Sabatini D. M. (2010) Regulation of the mTOR complex 1 pathway by nutrients, growth factors, and stress. Mol. Cell 40, 310–322 [DOI] [PMC free article] [PubMed] [Google Scholar]
- 53. Smirnova E., Goldberg E. B., Makarova K. S., Lin L., Brown W. J., Jackson C. L. (2006) ATGL has a key role in lipid droplet/adiposome degradation in mammalian cells. EMBO Reports 7, 106–113 [DOI] [PMC free article] [PubMed] [Google Scholar]
- 54. Haemmerle G., Lass A., Zimmermann R., Gorkiewicz G., Meyer C., Rozman J., Heldmaier G., Maier R., Theussl C., Eder S., Kratky D., Wagner E. F., Klingenspor M., Hoefler G., Zechner R. (2006) Defective lipolysis and altered energy metabolism in mice lacking adipose triglyceride lipase. Science 312, 734–737 [DOI] [PubMed] [Google Scholar]
- 55. Bezaire V., Mairal A., Ribet C., Lefort C., Girousse A., Jocken J., Laurencikiene J., Anesia R., Rodriguez A. M., Ryden M., Stenson B. M., Dani C., Ailhaud G., Arner P., Langin D. (2009) Contribution of Adipose Triglyceride Lipase and Hormone-sensitive Lipase to Lipolysis in hMADS Adipocytes. J. Biol. Chem. 284, 18282–18291 [DOI] [PMC free article] [PubMed] [Google Scholar]
- 56. Miyoshi H., Perfield J. W., 2nd, Obin M. S., Greenberg A. S. (2008) Adipose triglyceride lipase regulates basal lipolysis and lipid droplet size in adipocytes. J. Cell Biochem. 105, 1430–1436 [DOI] [PMC free article] [PubMed] [Google Scholar]
- 57. Kershaw E. E., Hamm J. K., Verhagen L. A., Peroni O., Katic M., Flier J. S. (2006) Adipose triglyceride lipase: function, regulation by insulin, and comparison with adiponutrin. Diabetes 55, 148–157 [PMC free article] [PubMed] [Google Scholar]
- 58. Grönke S., Mildner A., Fellert S., Tennagels N., Petry S., Müller G., Jäckle H., Kühnlein R. P. (2005) Brummer lipase is an evolutionary conserved fat storage regulator in Drosophila. Cell Metab. 1, 323–330 [DOI] [PubMed] [Google Scholar]
- 59. Kurat C. F., Natter K., Petschnigg J., Wolinski H., Scheuringer K., Scholz H., Zimmermann R., Leber R., Zechner R., Kohlwein S. D. (2006) Obese yeast: triglyceride lipolysis is functionally conserved from mammals to yeast. J. Biol. Chem. 281, 491–500 [DOI] [PubMed] [Google Scholar]