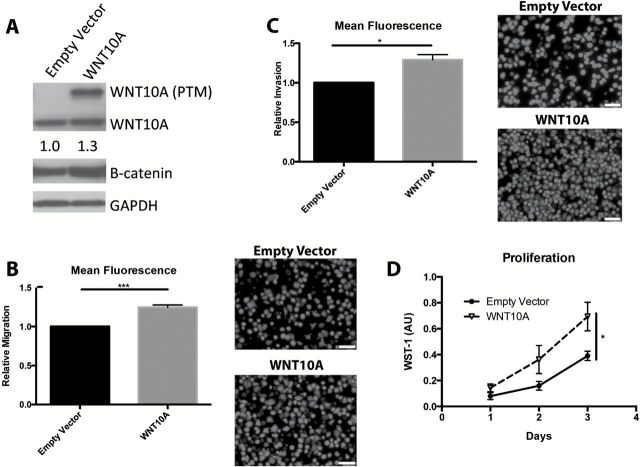
Figure 3.
WNT10A promotes migration and invasion. (A) Western blot (cropped image) of EPC2-hTERT-EGFR-p53R175H either overexpressing empty vector or WNT10A. Multiple bands indicate post-translational modifications of WNT10A. B-catenin densitometry indicates a modest 1.3-fold increase in total β-catenin relative to GAPDH, with WNT10A overexpression (n = 3 experiments). (B) Transwell Boyden Chamber migration assay of empty vector compared with WNT10A cells along with representative images of migratory cells stained with Calcein AM. (C) Transwell Boyden Chamber invasion assay of empty vector compared with WNT10A cells with representative images of invasive cells stained with Calcein AM. Scale bars =100 μM. n = 3 in triplicate. Bar graphs represent fold changes ± SEM. *P < 0.05, **P < 0.005 (paired Student’s t-test). (D) Proliferation assay utilizing a WST-1 colorimetric assay. (n = 5 experiments in quintuplicate). *P < 0.05 (paired Student’s t-test).

