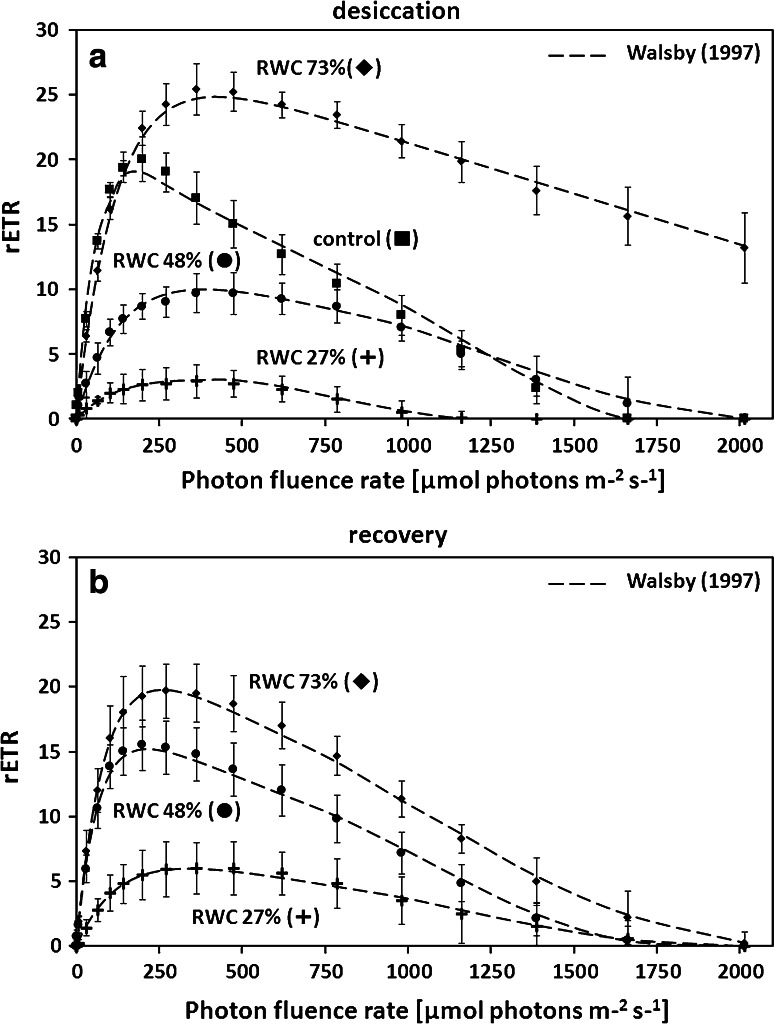
Fig. 8.
Relative electron transport rates (rETRs, μmol electrons m−2 s−1) as a function of increasing light intensities up to 2016 μmol photons m−2 s−1 in Ulva sp. a rETR curves in the control group and discs desiccated for 30 min (RWC 73 %), 60 min (48 %) or 90 min (RWC 27 %) at ~62 % RH (n = 6, mean value ± SD). b rETR curves in desiccated samples (30, 60 or 90 min) after 2 h recovery in ASW. rETR curves were determined using the fitting model of Walsby (1997) as photoinhibition occurred. Characteristic photosynthetic parameters (α, I k and rETRmax) derived from rETR curves are shown in Table 1

