

SUMMARY
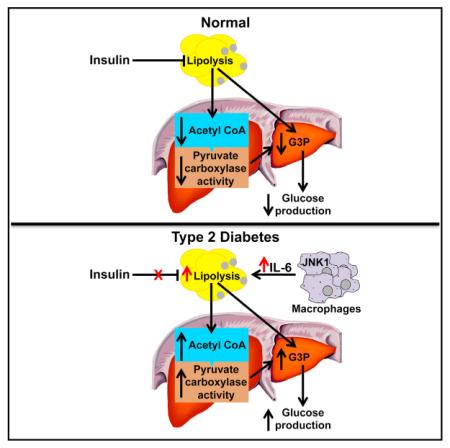
Impaired insulin-mediated suppression of hepatic glucose production (HGP) plays a major role in the pathogenesis of type 2 diabetes (T2D), yet the molecular mechanism by which this occurs remains unknown. Using a novel in vivo metabolomics approach, we show that the major mechanism by which insulin suppresses HGP is through reductions in hepatic acetyl CoA by suppression of lipolysis in white adipose tissue (WAT) leading to reductions in pyruvate carboxylase flux. This mechanism was confirmed in mice and rats with genetic ablation of insulin signaling and mice lacking adipose triglyceride lipase. Insulin’s ability to suppress hepatic acetyl CoA, PC activity, and lipolysis was lost in high-fat-fed rats, a phenomenon reversible by IL-6 neutralization and inducible by IL-6 infusion. Taken together, these data identify WAT-derived hepatic acetyl CoA as the main regulator of HGP by insulin and link it to inflammation-induced hepatic insulin resistance associated with obesity and T2D.
INTRODUCTION
The Centers for Disease Control predict that by the year 2050, one in three Americans will suffer from type 2 diabetes (T2D) (Boyle et al., 2010); therefore, efforts to understand and intervene in the pathogenesis of the disease are urgently needed. Fasting hyperglycemia, due to increased rates of hepatic gluconeogenesis, and the inability of insulin to suppress this process are the hallmark of T2D, but the molecular mechanism for this alteration is unknown (Kahn et al., 2014; Olefsky and Glass, 2010; Robbins et al., 2014; Samuel and Shulman, 2012). In this regard, mice lacking Akt1, Akt2, and Foxo1 (TKO) (Lu et al., 2012), the canonical insulin signaling proteins thought to regulate hepatic glucose production (HGP), surprisingly do not show any defect in insulin-mediated suppression of HGP.
We hypothesized that insulin’s ability to suppress lipolysis in white adipose tissue (WAT) may be critical for the suppression of HGP by reducing fatty acid flux to the liver resulting in decreased hepatic acetyl CoA concentrations and decreased pyruvate carboxylase (PC) activity, the first step in the conversion of pyruvate to glucose. While hepatic acetyl CoA has been previously shown to modulate PC activity in vitro (Barritt et al., 1966; Cazzulo and Stoppani, 1968; Cooper and Benedict, 1966; Keech and Utter, 1963; Krebs et al., 1965), methodological limitations stemming from acetyl CoA’s low concentrations and rapid degradation ex vivo have prevented its measurement in vivo.
We further hypothesized that increased hepatic acetyl CoA, due to increased rates of WAT lipolysis, is responsible for increased fasting HGP and reduced insulin-mediated suppression of HGP in high-fat-fed rodent models of diet-induced obesity associated with hepatic insulin resistance and hyperglycemia. In this regard, inflammatory cytokines are well-established mediators of lipolysis (Fonseca-Alaniz et al., 2007; Savage et al., 2005; Suganami and Ogawa, 2010), and protection from inflammation-associated insulin resistance could explain the preserved insulin sensitivity of macrophage-specific c-JUN N-terminal kinase (mφJNK) knockout mice fed a high-fat diet (Han et al., 2013).
To address these questions, we developed a novel liquid chromatography/tandem mass spectrometry (LC-MS/MS) technique to measure hepatic acetyl CoA content from in situ freezeclamped liver within 10 s of intravenous euthanasia in awake, unrestrained rats. These measurements were combined with measurements of whole-body rates of lipolysis, assessed by rates of [1,1,2,3,3-2H5] glycerol and [U-13C] palmitate turnover, combined with rates of glucose turnover assessed by [3-3H] glucose before and during a hyperinsulinemic-euglycemic clamp. Finally, we also performed additional studies to quantify in vivo pyruvate carboxylase flux and relative contributions of oxaloacetate and glycerol to hepatic gluconeogenesis using a combined NMR-LC-MS/MS positional isotopomer approach with [3-13C] lactate as a tracer. Using this comprehensive in vivo metabolomics approach, we show that hepatic acetyl CoA is the key regulator of hepatic insulin action in normal fasted, free-ranging rodents in vivo and that fasting hyperglycemia and insulin resistance in high-fat-fed rodents result from an inappropriate increase in hepatic acetyl CoA concentrations due to macrophage-induced WAT lipolysis.
RESULTS
Insulin Suppression of Glucose Production Is Temporally Associated with Suppression of Lipolysis and Hepatic Acetyl CoA
In order to examine the respective roles of hepatic acetyl CoA and glycerol turnover in the regulation of HGP by insulin, we infused awake rats with insulin to mimic physiologic postprandial insulin concentrations during a hyperinsulinemic-euglycemic clamp and found that plasma non-esterified fatty acid (NEFA) and glycerol concentrations were suppressed by 90% within 5 min, and HGP was suppressed by ~70% within 10 min after initiation of the insulin infusion as reflected by a rapid increase in the plasma glucose specific activity (Figures 1A–1C; Figures S1A–S1D). This reduction in HGP was associated with a 50% reduction in hepatic acetyl CoA concentrations within 10 min of the start of the insulin infusion as well as a 60% suppression of whole-body glycerol and palmitate turnover at steady state with no changes in plasma lactate, glucagon, or liver glycogen concentrations (Figures 1D–1F and S1E–S1G). Therefore, these data demonstrate that the major effect of insulin to suppress HGP under these conditions was through suppression of hepatic gluconeogenesis.
Figure 1. Rapid Suppression of Hepatic Glucose Production Rates Is Temporally Associated with a Parallel Rapid Suppression of Lipolysis.

(A) Hepatic glucose production measured by the Steele equation (Steele, 1959). Comparisons by ANOVA with Bonferroni’s multiple comparisons test. ****p < 0.0001 versus time 0.
(B and C) Plasma non-esterified fatty acid (NEFA) and glycerol concentrations during the hyperinsulinemic-euglycemic clamp. In (A)–(C), n = 6 per time point.
(D) Hepatic acetyl CoA concentrations. n = 4 per time point. *p < 0.01, **p < 0.01 versus time 0 by the two-tailed unpaired Student’s t test. (E and F) Whole-body palmitate and glycerol turnover rates.
(G–I) Liver acetyl CoA concentrations, hepatic glucose production, and pyruvate carboxylase activity in rats undergoing a hyperinsulinemic-euglycemic clamp with co-infusion of acetate. In (G)–(L), n = 4 per group.
(J–L) Plasma glycerol concentrations, whole-body glycerol turnover, and hepatic glucose production in rats undergoing a hyperinsulinemic-euglycemic clamp with co-infusion of glycerol.
In (G)–(L), n = 4 per group. *p < 0.05, **p < 0.01, ***p < 0.001, ****p < 0.0001 versus 0 μmol/(kg-min). In all panels, data are mean ± SEM. See also Figure S1.
Clamping Hepatic Acetyl CoA and Whole-Body Glycerol Turnover Abrogates Insulin Suppression of HGP
Based on the previous data, we next examined whether altering hepatic acetyl CoA concentrations, and/or altering rates of whole-body glycerol turnover, would change rates of HGP during a hyperinsulinemic-euglycemic clamp. In order to modify hepatic acetyl CoA concentrations, we infused sodium acetate at increasing rates during a hyperinsulinemic-euglycemic clamp, and observed a strong correlation between hepatic acetyl CoA concentrations and both pyruvate carboxylase (PC) activity (r2 = 0.85, p < 0.0001) and HGP (r2 = 0.68, p < 0.0001) during the clamp, without any changes in liver glycogen content (Figures 1G–1I and S1H–S1M).
Likewise, in order to assess the potential contribution of insulin-mediated suppression of glycerol turnover to insulin-mediated suppression of HGP by a substrate-push mechanism, we infused glycerol at increasing rates in awake rats during a hyperinsulinemic-euglycemic clamp and observed a strong correlation (r2 = 0.55, p < 0.0001) between rates of glycerol turnover and rates of HGP, without any change in liver glycogen or acetyl CoA (Figures 1J–1L and S1N–S1R). Taken together, these data demonstrate that modulation of either hepatic acetyl CoA concentrations or glycerol turnover can independently modulate rates of HGP during a hyperinsulinemic-euglycemic clamp.
In order to determine whether insulin-mediated suppression of hepatic acetyl CoA concentrations and glycerol turnover were responsible for insulin-mediated suppression of HGP, we co-infused both acetate and glycerol to match hepatic acetyl CoA concentrations and rates of glycerol turnover during a hyperinsulinemic-euglycemic clamp to those observed under basal conditions (Figures 2A–2D; Figures S2A and S2B). Matching hepatic acetyl CoA concentrations and whole-body glycerol turnover rates to baseline levels completely abrogated insulin-mediated suppression of PC flux and HGP, without any changes to plasma glucagon or liver glycogen concentrations, or expression of gluconeogenic proteins in the liver (Figures 2E, 2F, and S2C–S2E). Multiple regression analysis confirmed the linear relationships between HGP and both liver acetyl CoA and whole-body glycerol turnover (p = 0.002 and p = 0.01, respectively). We next assessed the relative contributions of oxaloacetate and glycerol conversion to glucose before and during a clamp and found that the suppression of hepatic gluconeogenesis could entirely be ascribed to suppression of lipolysis, with 85% of the suppression of HGP attributed to reduced conversion of oxaloacetate to glucose and the remainder attributed to reduced conversion of glycerol to glucose (Figure 2E).
Figure 2. Normalizing Hepatic Acetyl CoA Concentrations and Whole-Body Glycerol Turnover to Baseline Levels in the Hyperinsulinemic-Euglycemic Clamp Abrogates Insulin’s Ability to Suppress Hepatic Glucose Production.

(A) Liver acetyl CoA content.
(B) Whole-body glycerol turnover.
(C) Plasma glycerol concentrations.
(D) Glucose infusion rate.
(E) Hepatic glucose production from oxaloacetate (lower bars) and glycerol (upper bars).
(F) PC activity.
In all panels, ****p < 0.0001 versus basal, §§§§p < 0.0001 versus hyperinsulinemic-euglycemic clamp. n = 6 per group. Data are mean ± SEM. Comparisons by ANOVA with Bonferroni’s multiple comparisons test. See also Figure S2.
Liver Akt1/Ak2/Foxo1 Knockout Mice Suppress Lipolysis, Hepatic Acetyl CoA, and HGP Normally, but Acetate and Glycerol Infusion Abrogates Insulin Suppression of HGP
TKO mice exhibited no alterations in basal or insulin-mediated reductions in rates of HGP before and during a hyperinsulinemic-euglycemic clamp despite clear knockdown of Akt1/Akt2 and Foxo1 protein concentrations in liver (Lu et al., 2012) (Figure 3A; Figures S3A–S3C). Consistent with our data in awake rats, hepatic acetyl CoA concentrations, PC activity, and rates of whole-body lipolysis were similarly suppressed in WT and TKO mice during the hyperinsulinemic-euglycemic clamp, without any change in hepatic glycogen content (Figures 3B–3D and S3D–S3G). Furthermore, co-infusion of acetate and glycerol to maintain basal hepatic acetyl CoA concentrations and basal rates of glycerol turnover, fully abrogated insulin’s ability to suppress HGP during the hyperinsulinemic-euglycemic clamp (Figures 3B–3D).
Figure 3. Suppression of Lipolysis Results in Decreased Hepatic Acetyl CoA Concentrations and Suppression of Hepatic Glucose Production Independent of Hepatic Insulin Signaling.

(A) Protein expression in Akt1 and 2 and Foxo1 knockout mice.
(B) Hepatic glucose production. In all panels, black bars, basal; white bars, clamp; and gray bars, clamp+acetate+glycerol.
(C) Hepatic acetyl CoA concentrations.
(D) Hepatic pyruvate carboxylase activity. In (B)–(D), *p < 0.05, **p < 0.01, ***p < 0.001 versus basal, §p < 0.05, §§p < 0.01, §§§p < 0.001 versus hyperinsulinemic-euglycemic clamp by ANOVA. Data are mean ± SEM of n = 5 per group (basal), 8–9 per group (hyperinsulinemic-euglycemic clamp), and 3–4 per group (hyperinsulinemic-euglycemic clamp + acetate + glycerol).
(E) Protein expression in insulin receptor knockdown rats.
(F) Hepatic glucose production. Atglistatin-treated rats were given 600 μmol/kg.
(G) Liver acetyl CoA.
(H) Hepatic PC activity.
In (F)–(H), ****p < 0.0001 versus basal, §§§§p < 0.0001 versus hyperinsulinemic-euglycemic clamp by ANOVA. Data are mean ± SEM of n = 6 per group. See also Figure S3.
Inhibition of Lipolysis Decreases Hepatic Acetyl CoA and HGP in Insulin Receptor Antisense Oligonucleotide-Treated Rats Lacking Insulin Receptor in Liver and Fat
In order to more directly examine the putative requirement for suppression of lipolysis to permit suppression of HGP, we treated rats with a 2′-O-methoxyethyl chimeric antisense oligonucleotide to knock down the insulin receptor (IR ASO) in liver and adipose tissue (Figure 3E). IR ASO-treated rats displayed severe insulin resistance manifested by failure to suppress lipolysis, hepatic acetyl CoA, and HGP during a hyperinsulinemic-euglycemic clamp; however, all of these effects were abrogated by administration of atglistatin, a specific inhibitor of adipose triglyceride lipase (Figures 3F–3H and S3H–S3L), attributing the suppression of HGP to the inhibition of lipolysis and subsequent reductions in hepatic acetyl CoA and PC activity in both control and IR knockdown rats.
High-Fat-Fed Rats Manifest Increased Rates of HGP and Hepatic Insulin Resistance Associated with Increased Lipolysis and Increased Hepatic Acetyl CoA
In order to understand the potential role of hepatic acetyl CoA in the pathogenesis of fasting and postprandial hyperglycemia in a chronic high-fat-fed rodent model of insulin resistance associated with inflammation, we fed male Sprague-Dawley rats a high-fat diet for 4 weeks and observed, as expected, increases in fasting plasma glucose, insulin, and non-esterified fatty acid (NEFA) concentrations without any increases in plasma glucagon concentrations (Figures S4A–S4D). Fasting hyperglycemia in the HFD group was associated with a 25% increase in rates of basal HGP, 60% of which was derived from increases in hepatic pyruvate carboxylase flux, and 40% from increased conversion of glycerol to glucose. In chow-fed rats, insulin suppressed HGP in a hyperinsulinemic-euglycemic clamp, 85% through reductions in flux through hepatic pyruvate carboxylase, and 15% through reductions in the contribution of glycerol to glucose (Figure 4A; Figures S4E–S4G). However, in the high-fat-fed rats, insulin failed to suppress HGP during a hyperinsulinemic-euglycemic clamp associated with increased basal and clamped acetyl CoA and PC activity, and with higher rates of lipolysis both before and during the hyperinsulinemic-euglycemic clamp in the HFD group, without any differences in gluconeogenic protein expression (Figures 4B–4E, S4H, and S4I).
Figure 4. Four Weeks of High-Fat Feeding Increases Hepatic Glucose Production as a Result of Increased Lipolysis.

(A) Hepatic glucose production from oxaloacetate and glycerol. (B and C) Liver acetyl CoA and PC activity.
(D and E) Whole-body palmitate and glycerol turnover.
In (A)–(E), data are mean ± SEM of n = 6 per group. *p < 0.05, **p < 0.01, ****p < 0.0001 versus chow-fed, basal rats by the two-tailed unpaired Student’s t test.
(F) Hepatic glucose production in basal and clamped high-fat-fed adipose-specific ATGL knockout mice. (G and H) Liver acetyl CoA and PC activity.
(I and J) Whole-body palmitate and glycerol turnover.
In (F)–(J), data are mean ± SEM of n = 8 per group. ***p < 0.001, ****p < 0.0001 versus basal WT, ####p < 0.0001 versus basal ATGL knockouts by the two-tailed unpaired Student’s t test. See also Figures S4 and S5.
Increased Lipolysis Plays a Key Role in Excess Hepatic Gluconeogenesis in High-Fat-Fed Rodents
In order to confirm whether excess lipolysis causes excess HGP in diet-induced obesity, we studied high-fat-fed adipose-specific adipose triglyceride lipase (ATGL) knockout mice. These mice exhibited a 5-fold increase in insulin’s ability to suppress HGP in a hyperinsulinemic-euglycemic clamp, associated with 40%–60% reductions in hepatic acetyl CoA, PC activity, and whole-body palmitate and glycerol turnover during the clamp (Figures 4F–4J; Figures S5J–S5M).
High-Fat-Fed Rats Manifest Insulin Resistance in White Adipose Tissue
To determine the primary source(s) of the excess lipolysis in high-fat-fed rodents, we measured the ratio of tissue to plasma 13C16 palmitate in rats infused with 13C16 palmitate. The ratio of tissue to plasma 13C16 palmitate was ~100% in liver, skeletal muscle, and kidney, but only ~65% in WAT, confirming WAT as the source of the majority of fatty acids derived from lipolysis in both the basal and clamped state (Figures S4N and S4O). In addition, in order to determine the proportion of acetyl CoA derived from palmitate, we measured the ratio of hepatic 13C2 acetyl CoA to 13C16 palmitate in rats infused with 13C16 palmitate. In both chow and high-fat-fed rats, under both basal and clamped conditions, the enrichment of hepatic acetyl CoA was approximately 75% of palmitate, showing that a large proportion of hepatic acetyl CoA is derived from palmitate in vivo (Figure S4P).
WAT insulin resistance in high-fat-fed rats was reflected in the failure of insulin to stimulate Akt phosphorylation, glucose uptake, or lipogenesis in WAT (Figures S4Q–S4S). The increased lipolysis was associated with a larger mean diameter of large adipocytes, a reduced number of large adipocytes (Kursawe et al., 2010), and a doubling in WAT comparative gene identification-58 (CGI-58) protein expression (Yamaguchi et al., 2004, 2007), without any other changes in lipolytic or insulin signaling proteins in WAT, liver glycogen or ceramide content, plasma lactate, FGF-21, adiponectin, or lipolytic hormones (Figures S4T–S4EE). Liver concentrations of other putative mediators of gluconeogenesis, including the ratios of ATP to ADP, ATP to AMP, NAD+ to NADH, and four TCA cycle intermediates were also unchanged in high-fat-fed or clamped rats (Figures S5A–S5G).
Inhibition of Adipose Triglyceride Lipase Normalizes Hepatic Acetyl CoA Content, PC Activity, HGP, and Plasma Glucose Concentrations in High-Fat-Fed Rats
To determine whether increased rates of WAT lipolysis leading to increased hepatic acetyl CoA concentrations and PC activity in HFD rats were responsible for the increased rates of HGP in the basal state and the failure of insulin to suppress HGP during the hyperinsulinemic-euglycemic clamp, we treated rats with atglistatin. Atglistatin treatment normalized fasting plasma glucose and insulin concentrations and HGP by lowering WAT lipolysis, liver acetyl CoA concentrations, and PC activity without affecting plasma glucagon concentrations (Figures S5H–S5Q). These data demonstrate a critical but rapidly reversible role for WAT lipolysis driving increases in hepatic acetyl CoA and PC activity resulting in hyperglycemia in high-fat-fed, insulin-resistant rats.
To further examine the role of increases in hepatic acetyl CoA in causing excess gluconeogenesis, we treated chow and high-fat-fed rats with etomoxir, a potent inhibitor of carnitine palmitoyltransferase-1 (CPT-1). Consistent with the previous studies demonstrating a strong relationship between hepatic acetyl CoA concentration and rates of HGP, etomoxir treatment resulted in reductions in hepatic acetyl CoA content, which was associated with lower fasting plasma glucose and insulin concentrations, reduced rates of HGP, and reduced PC activity without any change in liver glycogen content (Figures S5R–S5W). These data further support the hypothesis that hepatic acetyl CoA is a key regulator of hepatic gluconeogenesis and HGP in normal, fasting rodents.
Adipose Tissue Inflammation Increases Hepatic Acetyl CoA Content and PC Activity and Causes Hepatic Insulin Resistance in HFD Rats
Next, we sought to determine the reason for the increased rates of lipolysis in HFD rats. In the absence of any changes in lipolytic hormone (growth hormone, epinephrine, norepinephrine, corticosterone) concentrations, we hypothesized that adipose tissue inflammation may play an important role in this process (Manteiga et al., 2013; Olefsky and Glass, 2010; Robbins et al., 2014). Consistent with this hypothesis, we observed a doubling of plasma and WAT macrophage interleukin-6 (IL-6) concentrations, without changes in any other inflammatory mediators (Figures 5A, 5B, and S6A). We confirmed white adipose tissue as a target of IL-6 by incubating WAT with the concentrations of IL-6 measured in plasma in vivo (15 and 25 nM) and observed a 50% increase in fatty acid release into the media over 24 hr (Figure S6B). Increases in granulocyte macrophage colony stimulating factor (GM-CSF) in both plasma and WAT may be responsible for attracting increased macrophages to WAT in high-fat-fed rats and/or inducing their proliferation, and IL-6 has been shown to stimulate lipolysis through activation of the JAK-Stat signaling pathway (Cernkovich et al., 2008; Guschin et al., 1995; Lütticken et al., 1994; Stahl et al., 1994). A modest 20% increase in WAT tumor necrosis factor-α (TNF-α) was also observed, consistent with increased macrophage activation in HFD rats (Figures S6C–S6D). Time-course studies with varying periods of HFD treatment confirmed a temporal relationship between fasting plasma glucose, insulin, and NEFA concentrations and both plasma and WAT macrophage IL-6 and GM-CSF concentrations (Figures S6E–S6K), with each increasing between days 6 and 8. In addition, by 6 days of high-fat feeding, adipocytes had begun to exhibit hypertrophy (Figure S6L).
Figure 5. Increases in Plasma Interleukin-6 Concentrations Cause Hyperglycemia in High-Fat-Fed Rats.

(A and B) IL-6 concentrations in plasma and white adipose tissue macrophages.
(C–F) Hepatic glucose production, PC activity, liver acetyl CoA, and whole-body palmitate turn-over in high-fat-fed rats treated with an IL-6-neutralizing antibody.
(G and H) Hepatic glucose production, liver PC activity, hepatic acetyl CoA, and whole-body palmitate turnover in control rats treated with or without IL-6 or IL-6 and atglistatin (200 αmol/kg). In all panels, data are mean ± SEM of n = 6 per group. Comparisons by the two-tailed unpaired Student’s t test (A–E) or by ANOVA with Bonferroni’s multiple comparisons test (F–H). *p < 0.05, **p < 0.01, ***p < 0.001 versus controls; §§p < 0.01, §§§p < 0.001 versus chow-fed, IL-6-infused rats. See also Figure S6.
In order to directly assess the role of excess IL-6 in promoting increased lipolysis, we treated HFD rats with a monoclonal neutralizing antibody to IL-6 (Figure S6M). Neutralizing IL-6 in HFD rats reduced plasma glucose, NEFA, glycerol, and insulin concentrations to normal levels without any change in plasma glucagon concentrations (Figures S6N–S6S). By lowering rates of lipolysis and reducing hepatic acetyl CoA concentrations, anti-IL-6 treatment resulted in a 50% reduction in hepatic PC activity and normalized rates of HGP in the HFD rat, without affecting macro-phage TNF-α concentrations (Figures 5C–5F and S6T–S6V).
IL-6 Infusion Induces Hepatic Insulin Resistance through Increased Adipose Tissue Lipolysis and Increased Hepatic Acetyl CoA Content, PC Activity, and HGP
In order to directly examine the role of IL-6 in mediating increased HGP through increased lipolysis, hepatic acetyl CoA content, and PC activity, we performed a 4 hr intra-arterial infusion of recombinant IL-6 in control rats (Figure S6W). We found that an infusion of IL-6 caused an increase in plasma glucose, NEFA, and insulin concentrations, which were associated with a marked increase in rates of whole-body lipolysis. These increases in rates of lipolysis were associated with increases in HGP, which could be attributed to a doubling in hepatic acetyl CoA content and an 80% increase in hepatic PC activity without any change in plasma glucagon concentrations (Figures 5G–5J and S6X–S6EE). However, these effects were fully abrogated by ATGL inhibition. The induction of lipolysis in IL-6-infused rats was associated with an increase in expression of CGI-58, a potent co-activator of ATGL, in WAT. These data suggest that IL-6 stimulation of lipolysis may be attributed in part to IL-6-induced increases in WAT CGI-58 concentrations (Figure S6FF), highlighting a potential novel role for CGI-58 in inflammation-induced increases in WAT lipolysis in insulin-resistant rats. Taken together, these data are consistent with the hypothesis that local production of IL-6 from macrophages in WAT promotes increased lipolysis leading to increased hepatic acetyl CoA content, PC activity, HGP, and hyperglycemia in high-fat-fed rodents.
Macrophage-Specific JNK Knockout Mice Are Protected from Diet-Induced Insulin Resistance
In order to examine whether local production of IL-6, from macrophages in WAT, promotes increased lipolysis, hepatic acetyl CoA content, PC activity, HGP, and hyperglycemia in high-fat-fed rodents, we next examined whether this mechanism would explain why mφJNK KO mice, which have strikingly low plasma and WAT macrophage IL-6 concentrations (Figures 6A and 6B), are protected from high-fat diet-induced hepatic insulin resistance. We found that macrophage-specific mφJNK KO mice exhibited improved suppression of HGP during the hyperinsulinemic-euglycemic clamp, which was associated with reductions in clamped glycerol and palmitate turn-over, hepatic acetyl CoA content, and hepatic PC activity (Figures 6C–6H and S7A–S7C). All of these effects were abrogated by infusion of IL-6 to match plasma IL-6 concentrations in the mφJNK knockouts to the wild-type group, demonstrating a critical role for IL-6-induced WAT lipolysis in mediating hepatic insulin resistance in high-fat-fed mice.
Figure 6. Mice Lacking JNK in Macrophages Are Protected from Diet-Induced Hepatic Insulin Resistance.

(A and B) Plasma and WAT macrophage IL-6 concentrations.
(C) Glucose infusion rate to maintain euglycemia during a hyperinsulinemic-euglycemic clamp.
(D) Liver acetyl CoA concentrations.
(E) Hepatic glucose production.
(F) Liver PC activity.
(G and H) Whole-body palmitate and glycerol turnover.
**p < 0.01, ***p < 0.001, ****p < 0.0001 versus basal mice; §p < 0.05, §§§p < 0.001, §§§§p < 0.0001 versus wild-type, clamped mice. Data are mean ± SEM of n = 10 (WT), 8 (m§JNK KO), or 10 (m§JNK KO+IL-6) per group. The groups were compared by ANOVA with Bonferroni’s multiple comparisons test. See also Figure S7.
Obese Insulin-Resistant Adolescents Display Increased Lipolysis and Increased WAT IL-6
In order to determine whether our findings in rats would translate to humans, we measured rates of HGP and lipolysis in obese insulin-resistant adolescents. Compared to weight-matched obese insulin-sensitive control subjects, insulin-resistant subjects displayed fasting hyperglycemia and hyperinsulinemia, which were associated with increased rates of HGP, impaired insulin-mediated suppression of lipolysis and impaired insulin-mediated suppression of HGP. Impaired insulin suppression of lipolysis was associated with an increased diameter of large adipocytes and increased macrophage infiltration into the subcutaneous white adipose tissue (Figures 7A–7I; Table S1). Consistent with our findings in insulin-resistant high-fat-fed rodents, insulin-resistant obese adolescents displayed increased plasma IL-6 concentrations, and an approximately 50% increase in IL-6 concentrations in WAT, which were more than 20 times higher than plasma IL-6 concentrations (Figures 7J and 7K). Similar to the HFD rats, the increased rates of lipolysis and HGP in obese insulin-resistant adolescents were associated with increased CGI-58 protein expression in WAT (Figure 7L).
Figure 7. Insulin-Resistant Obese Adolescents Have Increased Lipolysis and Impaired Suppression of HGP Associated with Increased WAT IL-6 Concentrations.

(A and B) Fasting and 2-hr post-challenge plasma glucose.
(C) Fasting plasma insulin.
(D) HOMA.
(E) Hepatic glucose production. Closed bars, basal; open bars, hyperinsulinemic-euglycemic clamp.
(F) Fasting NEFA.
(G) Suppression of glycerol turnover in the clamp.
(H) Mean diameter of large adipocytes.
(I) WAT macrophage counts.
(J and K) Plasma and WAT IL-6 concentrations.
(L) WAT CGI-58 protein.
Data are the mean ± SEM of 9–21 controls and 15–39 insulin-resistant subjects. Comparisons were made by the two-tailed unpaired Student’s t test. See also Table S1.
DISCUSSION
Suppression of HGP by insulin is critical for maintenance of normal glucose homeostasis and alterations in this process play a major role in the pathogenesis of T2D; however, the molecular mechanism by which insulin suppresses HGP has remained elusive and has been attributed to direct actions of insulin on liver (Edgerton et al., 2009; Hepp, 1977; Pilkis and Granner, 1992) and indirect effects of insulin on brain (Hill et al., 2010; Jordan et al., 2010; Lin et al., 2010; Obici et al., 2002; Schwartz et al., 2013) and adipocyte (Lewis et al., 1996; Rebrin et al., 1996). The canonical signaling pathway by which insulin has been postulated to directly inhibit hepatic gluconeogenesis is through activation of Akt, resulting in suppression of gluconeogenic protein expression by phosphorylation and exclusion of Forkhead box (Foxo1) from the nucleus of the hepatocyte, and consequent transcription-mediated reduction in hepatic gluconeogenesis (Haeusler et al., 2014). However, the finding that triple knockout mice lacking Akt 1 and Akt2 and Foxo1 in liver have normal suppression of HGP during a hyperinsulinemic-euglycemic clamp (Lu et al., 2012) poses considerable challenges to this paradigm. Furthermore, insulin suppresses HGP within minutes of administration in vivo, which can unlikely be explained by transcriptionally mediated processes.
To explain this apparent paradox, we hypothesized that insulin’s ability to suppress lipolysis in WAT may be critical for the suppression of HGP by reducing fatty acid flux to the liver resulting in decreased hepatic acetyl CoA concentrations and decreased PC activity resulting in decreased conversion of pyruvate to glucose. While hepatic acetyl CoA has been long known to modulate pyruvate carboxylase activity in vitro (Barritt et al., 1966; Cazzulo and Stoppani, 1968; Cooper and Benedict, 1966; Keech and Utter, 1963; Krebs et al., 1965), methodological limitations stemming from acetyl CoA’s low hepatocellular concentrations and rapid degradation ex vivo have prevented its measurement in vivo. Additionally, Chisholm et al. were not able to demonstrate any direct effect of insulin on pyruvate carboxylase activity in isolated hepatocytes (Chisholm et al., 1983), begging the question of whether a hepatocyte-autonomous process is primarily responsible for insulin-mediated suppression of PC activity and hepatic glucose production.
In order to examine this hypothesis, we developed a comprehensive metabolomics flux approach to simultaneously measure whole-body rates of lipolysis, glucose turnover, and intrahepatic fluxes as well as hepatic acetyl CoA content in rapidly freeze-clamped livers. Using this approach, we demonstrate that hepatic acetyl CoA content is a key regulator of HGP and that an insulin-mediated reduction of hepatic acetyl CoA concentrations, through inhibition of WAT lipolysis, is the major mechanism by which insulin suppresses HGP in vivo. While the ability of insulin to suppress HGP through an indirect mechanism was postulated by Levine and Fritz more than 50 years ago, the molecular mechanism regarding this effect has remained elusive. These are the first studies, to our knowledge, that demonstrate insulin regulation of pyruvate carboxylase activity through modulation of hepatic acetyl CoA concentrations and demonstrate that this mechanism is responsible for insulin suppression of hepatic glucose production in vivo. Furthermore, these data identify the mechanism by which mice lacking the canonical hepatic insulin signaling factors (Akt1, Akt2, Foxo1) are able to suppress HGP normally and expla in the enigmatic inability of insulin to suppress hepatic glucose production in isolated hepatocyte preparations (Lu et al., 2012).
We next examined whether increased hepatic acetyl CoA concentrations might be responsible for increased rates of hepatic glucose production in insulin resistance and might link inflammation and macrophage-induced lipolysis in WAT with fasting and postprandial hyperglycemia through a similar mechanism. While lipid-induced insulin resistance occurs early in the pathogenesis of T2D and can be dissociated from inflammation at this stage, a key question arises as to identification of the factor(s) that promotes the progression from ectopic lipid-induced insulin resistance to impaired glucose tolerance and fasting hyperglycemia (Shulman, 2014). The classic view of this process implicates impaired pancreatic β-cell and α-cell function along with inflammation in this transition where the former leads to increased hepatic gluconeogenic gene transcription and the latter inhibits insulin action through the release of cytokines and adipocytokines, which, in turn, leads to inhibition of insulin signaling and increased hepatic gluconeogenic protein expression through activation of the NF-κB/JNK/ceramide biosynthetic pathways (Olefsky and Glass, 2010). In this study, we explored an alternative hypothesis in which progression to fasting hyperglycemia occurs through macrophage-induced WAT lipolysis resulting in increased hepatic pyruvate carboxylase activity through increases in hepatic acetyl CoA content and increased conversion of glycerol to glucose. Consistent with this hypothesis, we show that high-fat-fed rats manifested a 2-fold increase in plasma and WAT IL-6 concentrations, which caused hyperglycemia by increasing lipolysis, hepatic acetyl CoA, and HGP both before and during a hyperinsulinemic-euglycemic clamp. Infusions of IL-6 and treatment of high-fat-fed rats with an IL-6-neutralizing antibody demonstrate that IL-6 is both necessary and sufficient to induce hyperglycemia in the rat. These findings were validated genetically in adipose-specific ATGL knockout mice and mφJNK knockout mice, which were protected from high-fat feeding-induced hepatic insulin resistance due to reductions in WAT lipolysis leading to decreased hepatic acetyl CoA content, decreased PC activity, and decreased rates of HGP during a hyperinsulinemic-euglycemic clamp.
Finally, we show these results translate to humans by demonstrating that WAT inflammation is associated with increased IL-6 concentrations in WAT, increased rates of lipolysis, increased rates of HGP, and hepatic insulin resistance assessed by a hyperinsulinemic-euglycemic clamp in obese insulin-resistant adolescents. These results are consistent with previous studies, which have observed that increased plasma IL-6 concentrations are strong predictors of insulin resistance in humans (Fernandez-Real et al., 2001; Glund et al., 2007; Kado et al., 1999; Mohamed-Ali et al., 1997; Petersen et al., 2006; Pickup et al., 1997; Steptoe et al., 2014; Straub et al., 2000; Yuen et al., 2009).
Taken together, these data demonstrate that allosteric regulation of pyruvate carboxylase activity by hepatic acetyl CoA, through insulin suppression of WAT lipolysis, is a critical factor in the regulation of hepatic glucose production by insulin in vivo. Furthermore, these studies demonstrate that macrophage-induced WAT lipolysis leading to increased hepatic acetyl CoA content and increased pyruvate carboxylase activity/flux is a key molecular mechanism linking WAT inflammation to both fasting and postprandial hyperglycemia in T2D. These data explain insulin’s inability to suppress hepatic glucose production in high-fat-fed rodent models of diet-induced obesity and hepatic insulin resistance independent of transcriptional regulation of gluconeogenic enzymes or alterations in hepatic glycogen metabolism and also explain recent studies that find no relationship between hepatic gluconeogenic protein expression and fasting hyperglycemia in obese humans (Kumashiro et al., 2011). These data also challenge the canonical view of inflammation-mediated hepatic insulin resistance through alterations in circulating cytokines, which, in turn, lead to inhibition of hepatic insulin signaling and increased hepatic gluconeogenic protein transcription through activation of the NF-κB/JNK/ceramide biosynthetic pathways. Finally, these results have important clinical implications for the pathogenesis of T2D by linking inflammation and macrophage-induced WAT lipolysis leading to increased hepatic acetyl CoA concentrations and increased PC flux resulting in fasting and postprandial hyperglycemia and identify macrophage-induced WAT lipolysis and hepatic acetyl CoA as a novel potential therapeutic target for T2D.
EXPERIMENTAL PROCEDURES
Animal Studies
Rodent protocols were approved by the International Animal Care and Use Committees at the institutions at which the animals were housed (Yale University, the University of Pennsylvania, and the University of Massachusetts). Additional information about the animal models is provided in Extended Experimental Procedures.
Basal and Hyperinsulinemic-Euglycemic Clamp Studies
Basal infusion and hyperinsulinemic-euglycemic clamp studies were used to assess whole-body and hepatic insulin sensitivity as described in the Extended Experimental Procedures.
Acute Suppression of Hepatic Gluconeogenesis
To assess insulin’s acute ability to suppress gluconeogenesis, chow-fed rats were infused with [3H] glucose (0.1 μCi/min) for 120 min. Blood samples were taken at 100, 110, and 120 min to assess basal glucose turnover. At 120 min, a 20-min insulin infusion was initiated (20 mU × kg−1 prime, 2 mU × kg−1 × min−1 for the duration of the study). Blood samples (100 μl) were taken every 3 min during the insulin infusion, and specific activity was measured using a scintillation counter.
Variable Glycerol and Acetate Infusions
Sodium acetate was infused intra-arterially in rats at infusion rates 0, 130, 195, 260, or 390 μmol × kg−1 × min−1. [3-3H] glucose was co-infused and blood and livers obtained as above. In a separate group of rats, [1,1,2,3,3-d5] glycerol was infused at infusion rates 0, 10, 30, 50, or 70 μmol × kg−1 × min−1 for 120 min. Glycerol turnover and concentrations were measured by gas chromatography/mass spectrometry (GC/MS) as described below. In the studies in which acetate and glycerol were co-infused during the clamp to abrogate insulin-mediated suppression of hepatic glucose production, the infusion rates selected were 195 μmol × kg−1 × min−1 acetate and 10 μmol × kg−1 × min−1 glycerol.
Measurement of Glucose, Fatty Acid, and Glycerol Turnover
Whole-body glucose turnover was calculated as the ratio of the [3-3H] glucose infusion rate to the specific activity of plasma glucose at the end of the 120 min infusion. Endogenous glucose production represents the difference between the glucose infusion rate and the rate of glucose appearance. The liver was assumed to contribute 90% of whole-body glucose production based on our prior studies (Perry et al., 2014). Hepatic flux rates were calculated as we describe in Extended Experimental Procedures. [U-13C] palmitate (Beylot et al., 1993) and [1,1,2,3,3-d5] glycerol (Previs et al., 1999) enrichment and total glycerol concentration were measured by GC/MS as previously reported, and turnover was calculated using the formula
ATGL Inhibition
Groups of overnight fasted chow and high-fat-fed rats were treated with intra-peritoneal injections of atglistatin (200 or 600 μmol/kg, as designated in the text, XcessBiosciences), a small-molecule ATGL inhibitor, or saline vehicle. They were then subjected to a basal infusion of [1,1,2,3,3-d5] glycerol, [U-13C] palmitate, and [3-3H] glucose as described above.
CPT-1 Inhibition
Overnight fasted chow and high-fat-fed rats were treated with intraperitoneal injections of etomoxir (8 mg × kg−1) and immediately began an infusion of [1,1,2,3,3-d5] glycerol, [U-13C] palmitate, and [3-3H] glucose as described above.
Adipocyte Morphology and Function
White adipose tissue glucose uptake was measured in basal and clamped rats following injection of 2-[1-14C] deoxyglucose (Cartee and Bohn, 1995). Insulin-stimulated WAT lipogenesis and adipocyte cell size were measured in chow and 4-week high-fat-fed rats as previously described (Kursawe et al., 2010). To measure IL-6-induced lipolysis, ~100-mg WAT samples were incubated in 5 mM glucose media containing 15 or 25 nM IL-6 to mimic plasma IL-6 concentrations in vivo in chow and high-fat-fed rats. After 6 hr of incubation at 37° C, NEFA concentrations in the media were measured and normalized to the total protein content of the WAT sample, measured by Bradford assay.
IL-6 Neutralization
Overnight fasted 4-week high-fat-fed rats were treated with an intraperitoneal injection of a neutralizing antibody to IL-6 (10 μg/rat, R&D Systems) in saline, or an equivalent volume of saline. Immediately following the antibody injection, [1,1,2,3,3-d5] glycerol, [U-13C] palmitate, and [3-3H] glucose were infused intra-arterially for the measurement of lipolysis and hepatic glucose production as described above.
IL-6 Infusion
A continuous intra-arterial infusion of IL-6 (10 μg/hr−1, Sigma) was performed for 4 hr. After 2 hr of IL-6 infusion, atglistatin (200 μmol/kg−1) was injected intravenously, and rates of lipolysis and hepatic glucose production were assessed as described above.
Biochemical Analyses
Plasma glucose concentrations were measured using the YSI 2700 Select Biochemistry Analyzer, and plasma lactate concentrations by COBAS. Plasma insulin concentrations were measured by ELISA (Millipore). NEFA concentrations were measured using a Wako kit. Plasma insulin was measured by radioimmunoassay by the Yale Diabetes Research Core. Plasma FGF-21, adiponectin, corticosterone, epinephrine, norepinephrine, growth hormone, and inflammatory cytokine concentrations were measured by ELISA (Millipore, Invitrogen, Abcam, IBL International, IBL International, Life Technologies, and QIAGEN, respectively).
Tissue Analyses
Liver acetyl CoA concentration and enrichment was measured by liquid chromatography/mass spectrometry/mass spectrometry (LC-MS/MS) as described in the Extended Experimental Procedures. Liver glycogen concentrations were measured in basal and clamped rats using the method of Dalrymple and Hamm (1973). Pyruvate carboxylase activity was measured as previously described (Vatner et al., 2013), with acetyl CoA concentrations adjusted to match those measured by LC-MS/MS in each group. Liver ATP, ADP, AMP, NAD, and NADH concentrations were measured by LC-MS/MS as previously described (Perry et al., 2013).
WAT Macrophage Isolation
WAT tissue was washed with HBSS and then incubated at 37°C, shaking for 60 min in HBSS with 0.5 mg/ml collagenase (Sigma). After washing three times with HBSS, cell debris was reduced by Histopaque density centrifugation. The remaining cells were stained with CD11b-PE (eBioscience), and CD11b+ WAT macrophages were enriched to >90% purity by EasySep PE positive selection kit (STEMCELL Technologies). Purity and cell number were confirmed by flow cytometry. WAT macrophage IL-6 and WAT tissue GM-CSF and TNF-α were measured by ELISA (Life Technologies, Abcam, and SABiosciences, respectively) and normalized to total protein content measured by Bradford assay.
Western Blots
Protein expression was measured in mouse and rat liver by western blot, with antibodies obtained from Cell Signaling Technology (Akt1, Akt2, Akt pSer473, Foxo1, pyruvate carboxylase, phosphoenolpyruvate carboxykinase, glucose-6-phosphatase, adipose triglyceride lipase, insulin receptor substrate-1, and glyceraldehyde 3-phosphate dehydrogenase) or from Santa Cruz Biotechnology (CGI-58, peroxisome proliferator-activated receptor gamma, glucose transporter type 4, and protein phosphatase 1).
Human Studies
The Yale Pathophysiology of Type 2 Diabetes in Obese Youth Study is a long-term project aimed at examining early alterations in glucose metabolism in relation to fat patterning in obese adolescents. Specific details of this study are described in the Extended Experimental Procedures.
Statistical Analyses
Statistical analyses were performed using GraphPad Prism. Comparisons between two groups were performed by the two-tailed unpaired Student’s t test, while three groups were compared by ANOVA with Bonferroni’s post hoc test. Differences were considered significant at p < 0.05. Data are presented as mean ± SEM.
Supplementary Material
Highlights.
Insulin inhibits gluconeogenesis by suppressing lipolysis and hepatic acetyl CoA
Hyperglycemia associated with HFD is due to increased WAT-derived hepatic acetyl CoA
ATGL KOs are protected from HFD-induced insulin resistance due to decreased lipolysis
mΦJNK KOs are protected from HFD-induced insulin resistance due to decreased lipolysis
ACKNOWLEDGMENTS
The authors thank Dr. James Dziura for assistance with the statistical analysis, Isis Pharmaceuticals and Dr. Sanjay Bhanot for providing us with the 2′-O-methoxyethyl chimeric antisense oligonucleotide for the insulin receptor kinase, and Dr. Jianying Dong, Mario Kahn, John Stack, Gina Butrico, Ali Nasiri, Maria Batsu, and Wanling Zhu for their skilled technical assistance. This study was funded by grants from the NIH (R01 DK-40936, R24 DK-085638, R01 AG-023686, P30 DK-45735, U24 DK-059635, T32 DK-101019, R01 DK-056886, R01 DK-093959, R01 NS-087568, R01 DK93928, UL1 TR-000142, R01-HD028016, R01-HD 04787, R01 DK085577, R24 DK-090963) and the Novo Nordisk Foundation Center for Basic Metabolic Research.
Footnotes
SUPPLEMENTAL INFORMATION
Supplemental Information includes Extended Experimental Procedures, seven figures, and one table and can be found with this article online at http://dx.doi.org/10.1016/j.cell.2015.01.012.
AUTHOR CONTRIBUTIONS
R.J.P. and G.I.S. designed the project and the experimental protocols. P.M.T. and M.J.B. generated the Akt1/2/Foxo1 knockout mice, and H.-B.R. and X.Y. performed adenoviral cre injections to ablate the proteins of interest. M.S.H. and R.J.D. generated the mφJNK knockout mice, and H.S.S. generated the adipose-specific ATGL-knockout mice. R.J.P. performed the in vivo rat studies, J.-P.G.C., M.J.J., and A.A. performed the in vivo mouse studies, and R.K. and S.C. performed the in vivo human studies. R.J.P., J.-P.G.C., D.Z., R.K., C.J.P., M.J.J., S.M.K., and G.W.C. contributed to plasma and tissue analysis. K.F.P. contributed to important discussions of the protocols and data. The manuscript was written by R.J.P. and G.I.S. with input from all other authors.
REFERENCES
- Barritt GJ, Keech DB, Ling AM. Apparent co-operative effect of acetyl-CoA on sheep kidney pyruvate carboxylase. Biochem. Biophys. Res. Commun. 1966;24:476–481. doi: 10.1016/0006-291x(66)90186-0. [DOI] [PubMed] [Google Scholar]
- Beylot M, David F, Brunengraber H. Determination of the 13C-labeling pattern of glutamate by gas chromatography-mass spectrometry. Anal. Biochem. 1993;212:532–536. doi: 10.1006/abio.1993.1364. [DOI] [PubMed] [Google Scholar]
- Boyle JP, Thompson TJ, Gregg EW, Barker LE, Williamson DF. Projection of the year 2050 burden of diabetes in the US adult population: dynamic modeling of incidence, mortality, and prediabetes prevalence. Popul. Health Metr. 2010;8:29. doi: 10.1186/1478-7954-8-29. [DOI] [PMC free article] [PubMed] [Google Scholar]
- Cartee GD, Bohn EE. Growth hormone reduces glucose transport but not GLUT-1 or GLUT-4 in adult and old rats. Am. J. Physiol. 1995;268:E902–E909. doi: 10.1152/ajpendo.1995.268.5.E902. [DOI] [PubMed] [Google Scholar]
- Cazzulo JJ, Stoppani AO. The regulation of yeast pyruvate carboxylase by acetyl-coenzyme A and L-aspartate. Arch. Biochem. Biophys. 1968;127:563–567. doi: 10.1016/0003-9861(68)90263-4. [DOI] [PubMed] [Google Scholar]
- Cernkovich ER, Deng J, Bond MC, Combs TP, Harp JB. Adipose-specific disruption of signal transducer and activator of transcription 3 increases body weight and adiposity. Endocrinology. 2008;149:1581–1590. doi: 10.1210/en.2007-1148. [DOI] [PMC free article] [PubMed] [Google Scholar]
- Chisholm AB, Allan EH, Titheradge MA. Regulation of mitochondrial pyruvate carboxylation in isolated hepatocytes by acute insulin treatment. Biochem. J. 1983;214:451–458. doi: 10.1042/bj2140451. [DOI] [PMC free article] [PubMed] [Google Scholar]
- Cooper TG, Benedict CR. The participation of acetyl-CoA in pyruvate carboxylase. Biochem. Biophys. Res. Commun. 1966;22:285–290. doi: 10.1016/0006-291x(66)90479-7. [DOI] [PubMed] [Google Scholar]
- Dalrymple RH, Hamm D. A method for the extraction of glycogen and metabolites from a single muscle sample. Int. J. Food Sci. Technol. 1973;8:439–444. [Google Scholar]
- Edgerton DS, Ramnanan CJ, Grueter CA, Johnson KM, Lautz M, Neal DW, Williams PE, Cherrington AD. Effects of insulin on the metabolic control of hepatic gluconeogenesis in vivo. Diabetes. 2009;58:2766–2775. doi: 10.2337/db09-0328. [DOI] [PMC free article] [PubMed] [Google Scholar]
- Fernandez-Real JM, Vayreda M, Richart C, Gutierrez C, Broch M, Vendrell J, Ricart W. Circulating interleukin 6 levels, blood pressure, and insulin sensitivity in apparently healthy men and women. J. Clin. Endocrinol. Metab. 2001;86:1154–1159. doi: 10.1210/jcem.86.3.7305. [DOI] [PubMed] [Google Scholar]
- Fonseca-Alaniz MH, Takada J, Alonso-Vale MI, Lima FB. Adipose tissue as an endocrine organ: from theory to practice. J. Pediatr. (Rio J.) 2007;83:S192–S203. doi: 10.2223/JPED.1709. [DOI] [PubMed] [Google Scholar]
- Glund S, Deshmukh A, Long YC, Moller T, Koistinen HA, Caidahl K, Zierath JR, Krook A. Interleukin-6 directly increases glucose metabolism in resting human skeletal muscle. Diabetes. 2007;56:1630–1637. doi: 10.2337/db06-1733. [DOI] [PubMed] [Google Scholar]
- Guschin D, Rogers N, Briscoe J, Witthuhn B, Watling D, Horn F, Pellegrini S, Yasukawa K, Heinrich P, Stark GR, et al. A major role for the protein tyrosine kinase JAK1 in the JAK/STAT signal transduction pathway in response to interleukin-6. EMBO J. 1995;14:1421–1429. doi: 10.1002/j.1460-2075.1995.tb07128.x. [DOI] [PMC free article] [PubMed] [Google Scholar]
- Haeusler RA, Hartil K, Vaitheesvaran B, Arrieta-Cruz I, Knight CM, Cook JR, Kammoun HL, Febbraio MA, Gutierrez-Juarez R, Kurland IJ, Accili D. Integrated control of hepatic lipogenesis versus glucose production requires FoxO transcription factors. Nat. Commun. 2014;5:5190. doi: 10.1038/ncomms6190. [DOI] [PMC free article] [PubMed] [Google Scholar]
- Han MS, Jung DY, Morel C, Lakhani SA, Kim JK, Flavell RA, Davis RJ. JNK expression by macrophages promotes obesity-induced insulin resistance and inflammation. Science. 2013;339:218–222. doi: 10.1126/science.1227568. [DOI] [PMC free article] [PubMed] [Google Scholar]
- Hepp KD. Studies on the mechanism of insulin action: basic concepts and clinical implications. Diabetologia. 1977;13:177–186. doi: 10.1007/BF01219697. [DOI] [PubMed] [Google Scholar]
- Hill JW, Elias CF, Fukuda M, Williams KW, Berglund ED, Holland WL, Cho YR, Chuang JC, Xu Y, Choi M, et al. Direct insulin and leptin action on pro-opiomelanocortin neurons is required for normal glucose homeostasis and fertility. Cell Metab. 2010;11:286–297. doi: 10.1016/j.cmet.2010.03.002. [DOI] [PMC free article] [PubMed] [Google Scholar]
- Jordan SD, Könner AC, Brüning JC. Sensing the fuels: glucose and lipid signaling in the CNS controlling energy homeostasis. Cell. Mol. Life Sci. 2010;67:3255–3273. doi: 10.1007/s00018-010-0414-7. [DOI] [PMC free article] [PubMed] [Google Scholar]
- Kado S, Nagase T, Nagata N. Circulating levels of interleukin-6, its soluble receptor and interleukin-6/interleukin-6 receptor complexes in patients with type 2 diabetes mellitus. Acta Diabetol. 1999;36:67–72. doi: 10.1007/s005920050147. [DOI] [PubMed] [Google Scholar]
- Kahn SE, Cooper ME, Del Prato S. Pathophysiology and treatment of type 2 diabetes: perspectives on the past, present, and future. Lancet. 2014;383:1068–1083. doi: 10.1016/S0140-6736(13)62154-6. [DOI] [PMC free article] [PubMed] [Google Scholar]
- Keech DB, Utter MF. Pyruvate Carboxylase. li. Properties. J. Biol. Chem. 1963;238:2609–2614. [PubMed] [Google Scholar]
- Krebs HA, Speake RN, Hems R. Acceleration of Renal Gluconeogenesis by Ketone Bodies and Fatty Acids. Biochem. J. 1965;94:712–720. doi: 10.1042/bj0940712. [DOI] [PMC free article] [PubMed] [Google Scholar]
- Kumashiro N, Erion DM, Zhang D, Kahn M, Beddow SA, Chu X, Still CD, Gerhard GS, Han X, Dziura J, et al. Cellular mechanism of insulin resistance in nonalcoholic fatty liver disease. Proc. Natl. Acad. Sci. USA. 2011;108:16381–16385. doi: 10.1073/pnas.1113359108. [DOI] [PMC free article] [PubMed] [Google Scholar]
- Kursawe R, Eszlinger M, Narayan D, Liu T, Bazuine M, Cali AM, D’Adamo E, Shaw M, Pierpont B, Shulman GI, et al. Cellularity and adipogenic profile of the abdominal subcutaneous adipose tissue from obese adolescents: association with insulin resistance and hepatic steatosis. Diabetes. 2010;59:2288–2296. doi: 10.2337/db10-0113. [DOI] [PMC free article] [PubMed] [Google Scholar]
- Lewis GF, Zinman B, Groenewoud Y, Vranic M, Giacca A. Hepatic glucose production is regulated both by direct hepatic and extrahepatic effects of insulin in humans. Diabetes. 1996;45:454–462. doi: 10.2337/diab.45.4.454. [DOI] [PubMed] [Google Scholar]
- Lin HV, Plum L, Ono H, Gutiérrez-Juaárez R, Shanabrough M, Borok E, Horvath TL, Rossetti L, Accili D. Divergent regulation of energy expenditure and hepatic glucose production by insulin receptor in agoutirelated protein and POMC neurons. Diabetes. 2010;59:337–346. doi: 10.2337/db09-1303. [DOI] [PMC free article] [PubMed] [Google Scholar]
- Lu M, Wan M, Leavens KF, Chu Q, Monks BR, Fernandez S, Ahima RS, Ueki K, Kahn CR, Birnbaum MJ. Insulin regulates liver metabolism in vivo in the absence of hepatic Akt and Foxo1. Nat. Med. 2012;18:388–395. doi: 10.1038/nm.2686. [DOI] [PMC free article] [PubMed] [Google Scholar]
- Lütticken C, Wegenka UM, Yuan J, Buschmann J, Schindler C, Ziemiecki A, Harpur AG, Wilks AF, Yasukawa K, Taga T, et al. Association of transcription factor APRF and protein kinase Jak1 with the interleukin-6 signal transducer gp130. Science. 1994;263:89–92. doi: 10.1126/science.8272872. [DOI] [PubMed] [Google Scholar]
- Manteiga S, Choi K, Jayaraman A, Lee K. Systems biology of adipose tissue metabolism: regulation of growth, signaling and inflammation. Wiley Interdiscip Rev Syst Biol Med. 2013;5:425–447. doi: 10.1002/wsbm.1213. [DOI] [PubMed] [Google Scholar]
- Mohamed-Ali V, Goodrick S, Rawesh A, Katz DR, Miles JM, Yudkin JS, Klein S, Coppack SW. Subcutaneous adipose tissue releases interleukin-6, but not tumor necrosis factor-alpha, in vivo. J. Clin. Endocrinol. Metab. 1997;82:4196–4200. doi: 10.1210/jcem.82.12.4450. [DOI] [PubMed] [Google Scholar]
- Obici S, Zhang BB, Karkanias G, Rossetti L. Hypothalamic insulin signaling is required for inhibition of glucose production. Nat. Med. 2002;8:1376–1382. doi: 10.1038/nm1202-798. [DOI] [PubMed] [Google Scholar]
- Olefsky JM, Glass CK. Macrophages, inflammation, and insulin resistance. Annu. Rev. Physiol. 2010;72:219–246. doi: 10.1146/annurev-physiol-021909-135846. [DOI] [PubMed] [Google Scholar]
- Perry RJ, Kim T, Zhang XM, Lee HY, Pesta D, Popov VB, Zhang D, Rahimi Y, Jurczak MJ, Cline GW, et al. Reversal of hypertriglyceridemia, fatty liver disease, and insulin resistance by a liver-targeted mitochondrial uncoupler. Cell Metab. 2013;18:740–748. doi: 10.1016/j.cmet.2013.10.004. [DOI] [PMC free article] [PubMed] [Google Scholar]
- Perry RJ, Zhang XM, Zhang D, Kumashiro N, Camporez JP, Cline GW, Rothman DL, Shulman GI. Leptin reverses diabetes by suppression of the hypothalamic-pituitary-adrenal axis. Nat. Med. 2014;20:759–763. doi: 10.1038/nm.3579. [DOI] [PMC free article] [PubMed] [Google Scholar]
- Petersen KF, Dufour S, Feng J, Befroy D, Dziura J, Dalla Man C, Cobelli C, Shulman GI. Increased prevalence of insulin resistance and nonalcoholic fatty liver disease in Asian-Indian men. Proc. Natl. Acad. Sci. USA. 2006;103:18273–18277. doi: 10.1073/pnas.0608537103. [DOI] [PMC free article] [PubMed] [Google Scholar]
- Pickup JC, Mattock MB, Chusney GD, Burt D. NIDDM as a disease of the innate immune system: association of acute-phase reactants and interleukin-6 with metabolic syndrome X. Diabetologia. 1997;40:1286–1292. doi: 10.1007/s001250050822. [DOI] [PubMed] [Google Scholar]
- Pilkis SJ, Granner DK. Molecular physiology of the regulation of hepatic gluconeogenesis and glycolysis. Annu. Rev. Physiol. 1992;54:885–909. doi: 10.1146/annurev.ph.54.030192.004321. [DOI] [PubMed] [Google Scholar]
- Previs SF, Cline GW, Shulman GI. A critical evaluation of mass isotopomer distribution analysis of gluconeogenesis in vivo. Am. J. Physiol. 1999;277:E154–E160. doi: 10.1152/ajpendo.1999.277.1.E154. [DOI] [PubMed] [Google Scholar]
- Rebrin K, Steil GM, Mittelman SD, Bergman RN. Causal link-age between insulin suppression of lipolysis and suppression of liver glucose output in dogs. J. Clin. Invest. 1996;98:741–749. doi: 10.1172/JCI118846. [DOI] [PMC free article] [PubMed] [Google Scholar]
- Robbins GR, Wen H, Ting JP. Inflammasomes and metabolic disorders: old genes in modern diseases. Mol. Cell. 2014;54:297–308. doi: 10.1016/j.molcel.2014.03.029. [DOI] [PMC free article] [PubMed] [Google Scholar]
- Samuel VT, Shulman GI. Mechanisms for insulin resistance: common threads and missing links. Cell. 2012;148:852–871. doi: 10.1016/j.cell.2012.02.017. [DOI] [PMC free article] [PubMed] [Google Scholar]
- Savage DB, Petersen KF, Shulman GI. Mechanisms of insulin resistance in humans and possible links with inflammation. Hypertension. 2005;45:828–833. doi: 10.1161/01.HYP.0000163475.04421.e4. [DOI] [PubMed] [Google Scholar]
- Schwartz MW, Seeley RJ, Tschöp MH, Woods SC, Morton GJ, Myers MG, D’Alessio D. Cooperation between brain and islet in glucose homeostasis and diabetes. Nature. 2013;503:59–66. doi: 10.1038/nature12709. [DOI] [PMC free article] [PubMed] [Google Scholar]
- Shulman GI. Ectopic fat in insulin resistance, dyslipidemia, and cardiometabolic disease. N. Engl. J. Med. 2014;371:1131–1141. doi: 10.1056/NEJMra1011035. [DOI] [PubMed] [Google Scholar]
- Stahl N, Boulton TG, Farruggella T, Ip NY, Davis S, Witthuhn BA, Quelle FW, Silvennoinen O, Barbieri G, Pellegrini S, et al. Association and activation of Jak-Tyk kinases by CNTF-LIF-OSM-IL-6 beta receptor components. Science. 1994;263:92–95. doi: 10.1126/science.8272873. [DOI] [PubMed] [Google Scholar]
- Steele R. Influences of glucose loading and of injected insulin on hepatic glucose output. Ann. N Y Acad. Sci. 1959;82:420–430. doi: 10.1111/j.1749-6632.1959.tb44923.x. [DOI] [PubMed] [Google Scholar]
- Steptoe A, Hackett RA, Lazzarino AI, Bostock S, La Marca R, Carvalho LA, Hamer M. Disruption of multisystem responses to stress in type 2 diabetes: investigating the dynamics of allostatic load. Proc. Natl. Acad. Sci. USA. 2014;111:15693–15698. doi: 10.1073/pnas.1410401111. [DOI] [PMC free article] [PubMed] [Google Scholar]
- Straub RH, Hense HW, Andus T, Schölmerich J, Riegger GA, Schunkert H. Hormone replacement therapy and interrelation between serum interleukin-6 and body mass index in postmenopausal women: a population-based study. J. Clin. Endocrinol. Metab. 2000;85:1340–1344. doi: 10.1210/jcem.85.3.6355. [DOI] [PubMed] [Google Scholar]
- Suganami T, Ogawa Y. Adipose tissue macrophages: their role in adipose tissue remodeling. J. Leukoc. Biol. 2010;88:33–39. doi: 10.1189/jlb.0210072. [DOI] [PubMed] [Google Scholar]
- Vatner DF, Weismann D, Beddow SA, Kumashiro N, Erion DM, Liao XH, Grover GJ, Webb P, Phillips KJ, Weiss RE, et al. Thyroid hormone receptor-b agonists prevent hepatic steatosis in fat-fed rats but impair insulin sensitivity via discrete pathways. Am. J. Physiol. Endocrinol. Metab. 2013;305:E89–E100. doi: 10.1152/ajpendo.00573.2012. [DOI] [PMC free article] [PubMed] [Google Scholar]
- Yamaguchi T, Omatsu N, Matsushita S, Osumi T. CGI-58 interacts with perilipin and is localized to lipid droplets. Possible involvement of CGI-58 mislocalization in Chanarin-Dorfman syndrome. J. Biol. Chem. 2004;279:30490–30497. doi: 10.1074/jbc.M403920200. [DOI] [PubMed] [Google Scholar]
- Yamaguchi T, Omatsu N, Morimoto E, Nakashima H, Ueno K, Tanaka T, Satouchi K, Hirose F, Osumi T. CGI-58 facilitates lipolysis on lipid droplets but is not involved in the vesiculation of lipid droplets caused by hormonal stimulation. J. Lipid Res. 2007;48:1078–1089. doi: 10.1194/jlr.M600493-JLR200. [DOI] [PubMed] [Google Scholar]
- Yuen DY, Dwyer RM, Matthews VB, Zhang L, Drew BG, Neill B, Kingwell BA, Clark MG, Rattigan S, Febbraio MA. Interleukin-6 attenuates insulin-mediated increases in endothelial cell signaling but augments skeletal muscle insulin action via differential effects on tumor necrosis factor-alpha expression. Diabetes. 2009;58:1086–1095. doi: 10.2337/db08-0775. [DOI] [PMC free article] [PubMed] [Google Scholar]
Associated Data
This section collects any data citations, data availability statements, or supplementary materials included in this article.