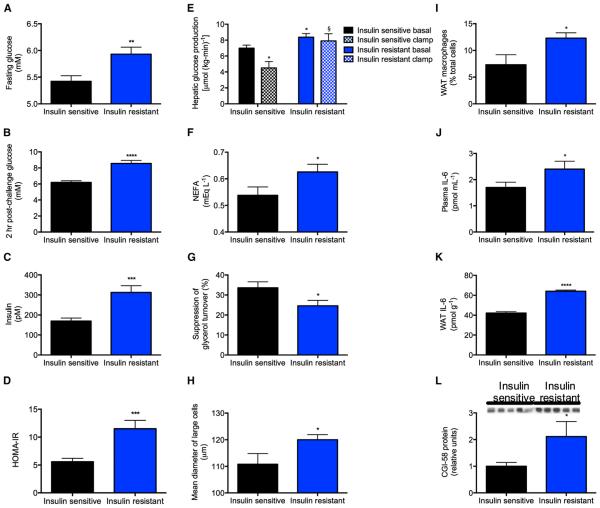
Figure 7. Insulin-Resistant Obese Adolescents Have Increased Lipolysis and Impaired Suppression of HGP Associated with Increased WAT IL-6 Concentrations.
(A and B) Fasting and 2-hr post-challenge plasma glucose.
(C) Fasting plasma insulin.
(D) HOMA.
(E) Hepatic glucose production. Closed bars, basal; open bars, hyperinsulinemic-euglycemic clamp.
(F) Fasting NEFA.
(G) Suppression of glycerol turnover in the clamp.
(H) Mean diameter of large adipocytes.
(I) WAT macrophage counts.
(J and K) Plasma and WAT IL-6 concentrations.
(L) WAT CGI-58 protein.
Data are the mean ± SEM of 9–21 controls and 15–39 insulin-resistant subjects. Comparisons were made by the two-tailed unpaired Student’s t test. See also Table S1.

