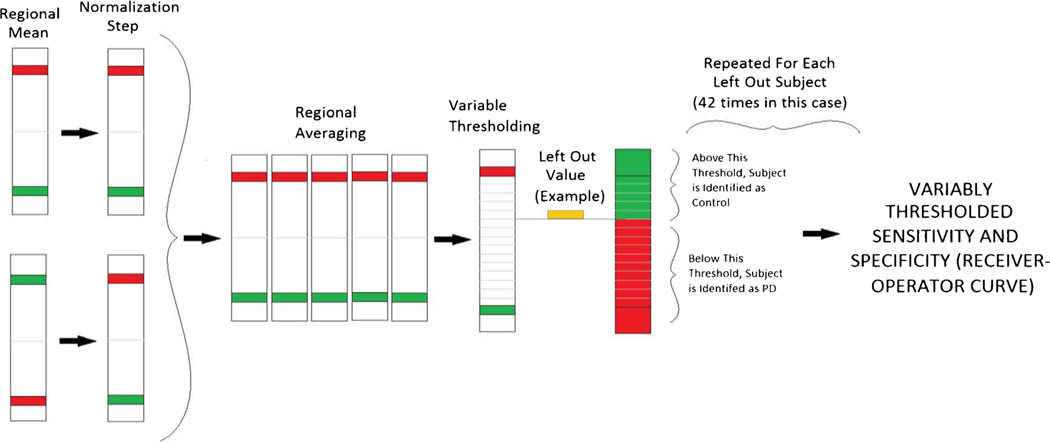
Fig. 1.
Uniform method for analyzing regions of interest. Each analysis method generates distinct regions of interest for analysis. Once regions are selected, we use an identical methods to define predictive accuracy across all methods. For the purposes of visual display, assume red band represents the PD regional mean; the green band represents the control regional mean. There is a normalization step to normalize the direction of prediction. Variable thresh-holding allows us to evaluate the capacity of the selected region to predict the identity of the subject (illustrated as an orange rectangle). In this case, the prediction favors a diagnosis of PD (red) at many thresholds but adopting a more stringent threshold results in identification as a control subject (green). Accuracy of the prediction compared to the known identification of the left out subject allows us to generate sensitivity and specificity across multiple thresholds. With multiple subjects, this allows us to generate a receiver operator characteristic curve

