Abstract
Herein we describe the chemical reactivity of the mononuclear [MnII(N4py)(OTf)](OTf) (1) complex with hydrogen peroxide and superoxide. Treatment of 1 with one equivalent superoxide at −40 °C in MeCN formed the peroxomanganese(III) adduct, [MnIII(O2)(N4py)]+ (2) in ~30% yield. Complex 2 decayed over time and the formation of the bis(μ-oxo)dimanganese(III,IV) complex, [MnIIIMnIV(μ-O)2(N4py)2]3+ (3) was observed. When 2 was formed in higher yields (~60%) using excess superoxide, the [MnIII(O2)(N4py)]+ species thermally decayed to MnII species and 3 was formed in no greater than 10% yield. Treatment of [MnIII(O2)(N4py)]+ with 1 resulted in the formation of 3 in ~90% yield, relative to the concentration of [MnIII(O2)(N4py)]+. This reaction mimics the observed chemistry of Mn-ribonucleotide reductase, as it features the conversion of two MnII species to an oxo-bridged MnIIIMnIV compound using O2− as oxidant. Complex 3 was independently prepared through treatment of 1 with H2O2 and base at −40 °C. The geometric and electronic structures of 3 were probed using electronic absorption, electron paramagnetic resonance (EPR), magnetic circular dichroism (MCD), variable-temperature, variable-field MCD (VTVH-MCD), and X-ray absorption (XAS) spectroscopies. Complex 3 was structurally characterized by X-ray diffraction (XRD), which revealed the N4py ligand bound in an unusual tetradentate fashion.
Introduction
The diverse chemistry of manganese-dependent enzymes commonly features the reaction of a redox-active manganese ion with molecular oxygen or one of its reduced derivatives (i.e., superoxide, hydrogen peroxide, and water).1–3 For example, Mn-dependent dioxygenases4,5 and oxalate oxidase6,7 react with molecular oxygen to perform substrate oxidations. Manganese superoxide dismutase3,8,9 and manganese catalase2 react with superoxide and hydrogen peroxide, respectively, as defence against reactive oxygen species. The tetramanganese cofactor in the oxygen-evolving complex of photosystem II converts water to O2.10,11 Finally, it was recently established that Mn-ribonucleotide reducatase (Mn-RNR) from Bacillus subtilis requires superoxide for the assembly of an oxo-bridged dimanganese(III,IV) species.12 The MnIIIMnIV form of Mn-RNR rapidly converts to a MnIII2-Y• cofactor that itself generates a cysteine radical to initiate the conversion of nucleotides to deoxynucleotides.13–15 The molecular mechanism by which the MnIIIMnIV form of Mn-RNR is assembled is unknown, although a (hydro)-peroxomanganese(III) species was proposed as an intermediate.12
Examination of the spectroscopic properties and reactivity of Mn-containing model complexes has played a prominent role in advancing our understanding of Mn enzymes.1,2,11,16–18 With respect to Mn-RNR, for example, there are numerous model complexes featuring bis(μ-oxo)dimanganese(III,IV) cores that serve as potential mimics of the MnIIIMnIV form of the enzyme.11,19 These model complexes, which are often observed upon treatment of manganese(II) complexes with H2O2 at room temperature,2,19 are generally very stable thermodynamically. Crystal structures of these complexes reveal typical Mn-Mn separations of ~2.7 Å.11,19–23 Some of these bis(μ-oxo)dimanganese(III,IV) complexes have been shown to oxidize substrates by a H-atom transfer mechanism, thus mimicking tyrosine oxidation by the MnIIIMnIV form of Mn-RNR.24,25
Mononculear side-on peroxomanganese(III)26–38 and end-on alkylperoxomanganese(III)39–41 intermediates have also been reported and characterized. These intermediates can be generated from their corresponding manganese(II) precursors using a variety of oxidants, including superoxide, hydrogen (or alkyl) peroxide, and molecular oxygen. They often, but not always,30–32 are thermally unstable and must be formed and characterized at low temperatures. Reactivity studies of peroxomanganese(III) adducts have shown that the peroxo group is nucleophilic and attacks aldehydes to initiate a deformylation reaction.27,30,31,34,42 Notably, although several examples of oxo-bridged dimanganese(III,IV) and (alkyl)peroxomanganese(III) species exist, there is, to the best of our knowledge, limited evidence that (alkyl)peroxomanganese(III) adducts can serve as intermediates in the generation oxo-bridged dimanganese(III,IV) complexes.39–41
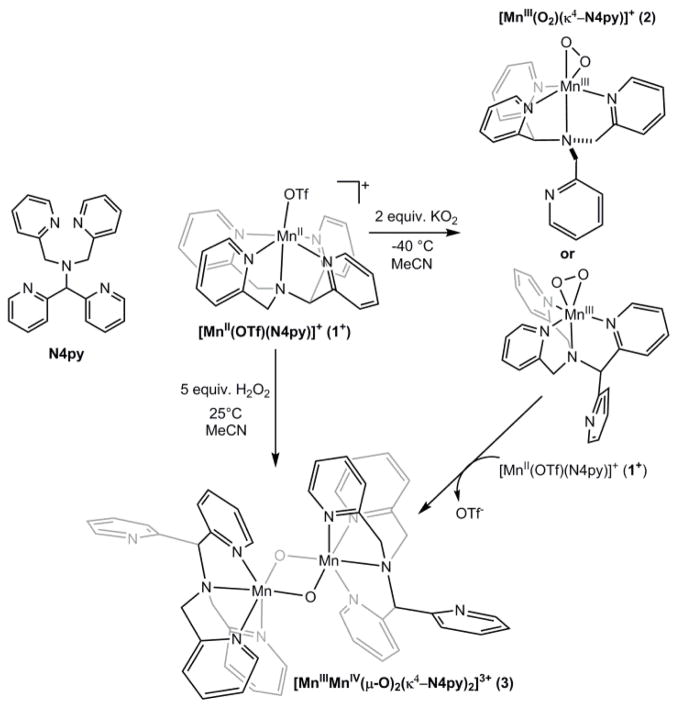
To better understand the relationship of peroxomanganese(III) and bis(μ-oxo)dimanganese(III,IV) species, we have explored the chemical reactivity of the mononuclear [MnII(N4py)(OTf)](OTf) complex with superoxide and hydrogen peroxide. In a previous, collaborative study with Dorlet and Anxolabéhère-Mallart, we established that the [MnII(N4py)(OTf)](OTf) complex converts to a MnIII-O2 adduct upon treatment with excess superoxide (Scheme 1).28 On the basis of detailed spectroscopic and computational studies of [MnIII(O2)(N4py)]+, as well as the closely related [MnIII(O2)(mL52)]+ and [MnIII(O2)(imL52)]+ complexes (mL52 = N-methyl-N,N′,N″,-tris(2-pyridylmethyl)ethane-1,2-diamine and imL52 = N-methyl-N,N′,N″,-tris((1-methyl-4-imidazolyl)methyl)ethane-1,2-diamine), we concluded that the N4py ligand in [MnIII(O2)(N4py)]+ is bound in an unusual tetradentate fashion (termed herein κ4-N4py), whereas the peroxo is coordinated in a side-on (i.e., η2-O2) mode. Because tetradentate binding of the N4py ligand could be achieved by either dissociation of a methylenepyridine or a dipyridinylmethane moiety, two isomers of [MnIII(O2)(κ4-N4py)]+ are possible. Molecular structures of these isomers, which were previously developed using density functional theory (DFT) computations, are shown in Scheme 1.28 While the DFT-optimized structures are very similar, the [MnIII(O2)(κ4-N4py)]+ isomer with a dissociated methylenepyridine arm was lower in total energy by ~6 kcal/mol, and TD-DFT-computed spectroscopic properties for this isomer were more consistent with the available spectroscopic data. Thus, we favoured this isomer, but were unable to make a definitive conclusion on the basis of the available data.¤
Scheme 1.
In this current work, we extend our understanding of the reactivity of [MnII(N4py)(OTf)](OTf) by showing that this complex converts to [MnIIIMnIV(μ-O)2(κ4-N4py)2]3+ upon treatment with H2O2 and base even at −40 °C. Intriguingly, the [MnIIIMnIV(μ-O)2(κ4-N4py)2]3+ complex can be formed in ~90% yield by reaction of the peroxomanganese(III) complex [MnIII(O2)(κ4-N4py)]+ with [MnII(N4py)(OTf)](OTf). As this reaction features the conversion of two MnII species to a MnIIIMnIV compound using O2− as oxidant, it mimics formation of the MnIIIMnIV form of Mn-RNR.
Results and analysis
Formation and decay of [MnIII(O2)(κ4-N4py)]+
The molecular structure of [MnII(OTf)(N4py)](OTf) (1) has been previously determined by X-ray crystallography.43,44 In the structure, the N4py ligand is coordinated in a pentadentate fashion, with the four pyridine nitrogen ligands defining the equatorial plane. The amino group of the N4py ligand is in an axial position trans to the monodentate triflate anion (see Scheme 1). When 1 is treated with KO2 in MeCN at −40 °C, it converts to the peroxomanganese(III) complex [MnIII(O2)(κ4-N4py)]+ (2), as previously reported.28 Figure 1 (left) shows the electronic absorption spectrum of the formation of 2 from the addition of one equiv. KO2 and four equiv. 18-crown-6 ether at −40 °C. The electronic absorption spectrum of 2 displays a prominent band at 16 200 cm−1 (617 nm) and a shoulder at 22 800 cm−1 (438 nm). Although formation of 2 is observed using one equiv. KO2, it is not maximally formed under these conditions. In recent work, Anxolabéhère-Mallart and co-workers have shown that 2 is formed in high yield using electrochemically generated O2−.45 In contrast, the chemical method employing one equiv. KO2 affords 2 in only a ~30% yield (this yield is estimated assuming 100% formation of 2 by the electrochemical method of Anxolabéhère-Mallart and co-workers).
Figure 1.
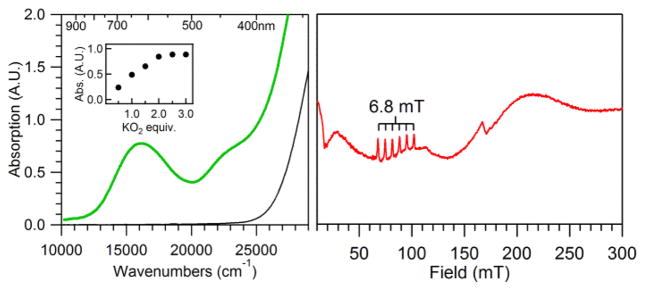
Left: Electronic absorption spectrum of 1 (black trace) and 2 (green trace), the latter of which was formed by adding 1 equiv. KO2 to 7.5 mM 1 in MeCN at −40 °C. Inset: Maximum intensity at 16 200 cm−1 as a function of KO2 equiv. added to 5 mM 1 in MeCN at −40 °C. Right: Parallel-mode X-band EPR spectrum of 2 in butyronitrile, formed using 2 equiv. KO2. Recording conditions: 5 K, 9.3918 GHz microwave frequency, 2.0 mW microwave power, 0.4 mT modulation amplitude, 100 kHz modulation frequency, 81.92 ms time constant, and 15 000 point resolution.
The conditions under which 2 is maximally formed by chemical oxidation were determined by performing a KO2 titration on a 5 mM acetonitrile solution of 1. The intensity of the band at 16 200 cm−1 maximizes at two equiv. KO2 (Figure 1, left inset). The use of three equiv. KO2 does not noticeably increase the yield. We attribute the increased formation of 2 under these conditions to the instability of KO2 and not to a two-electron oxidation of 1. MCD28 and EPR experiments45 firmly establish 2 as a high-spin MnIII complex.‡ For example, the parallel-mode X-band EPR spectrum of 2 displays a six-line signal centered at 84.5 mT with a hyperfine splitting of 6.8 mT (Figure 1, right), indicative of high-spin MnIII.37,38 The intensity of this signal decreases with increasing temperature (ESI; Figure S1), consistent with a negative axial zero-field splitting parameter (i.e., D < 0 cm−1).
Given that 2 is metastable even at low temperatures, we used electronic absorption and EPR spectroscopies to investigate the products formed upon thermal decay. Notably, the identity of the decay products depends on the amount of KO2 used to form 2. When 2 is generated in high yields (~60%) using 2 equiv. KO2, the peroxomanganese(III) complex decays over the course of 3 hours to give a solution with an ill-defined absorption spectrum (ESI; Figure S2). The perpendicular-mode EPR spectrum of the decayed solution of 2 in butyronitrile reveals the presence of MnII species. The MnIII signal at 84.5 mT, is no longer observed in the corresponding parallel-mode spectrum (ESI; Figure S3). We note that the MnII species observed under these conditions display EPR signals distinct from those of butyronitrile samples of [MnII(N4py)(OTf)](OTf) and MnII(OTf)2 (ESI; Figure S4).§
In contrast, when 2 is formed using 1 equiv. KO2, it decays to yield a new chromophore (3) with electronic absorption maxima at 15 000 and 17 700 cm−1 (667 and 565 nm; see Figure 2, left). This spectral pattern is similar to those of bis(μ-oxo)dimanganese(III,IV) complexes.46–48 Indeed, independent preparation of 3 from 1 and H2O2 (vide infra) establishes its identity as [MnIIIMnIV(μ-O2)(κ4-N4py)2]3+. The rate of formation of 3 increases linearly as the initial concentration of 1 increases, with a rate constant (k) of 2.12 × 10⁻³ M−1 min−1 at −40 °C (ESI; Figure S5). On the basis of the extinction coefficients of authentic samples of 3, the decay of 2 affords only a 33% conversion to 3 (based on total Mn concentration). With ~30% formation of 2 under these conditions, the conversion of 2 to 3 is nearly quantitative. Two lines of evidence suggest the balance of Mn is present in the MnII oxidation state. First, the perpendicular-mode EPR spectrum of the solution following the decay of 2 shows a sixteen-line signal typical of bis(μ-oxo)dimanganese(III,IV) complexes,22,48,49 but also present are broader features from MnII species (Figure 2, right). Second, we determined the average oxidation state of the manganese species in the decay solution through an iodometric analysis.50 In this procedure, the decay solution, which has a known manganese concentration, was treated with excess tetrabutylammonium iodide and glacial acetic acid. The triiodide produced upon reaction with the manganese species was quantified using the electronic absorbance bands of triiodide at 295 and 365 nm; this gave an average oxidation state of manganese in solution of 2.48 ± 0.02. This average oxidation state can be well accounted for considering 33% MnIIIMnIV from 3 and 67% MnII, which gives an average oxidation state of 2.49.
Figure 2.
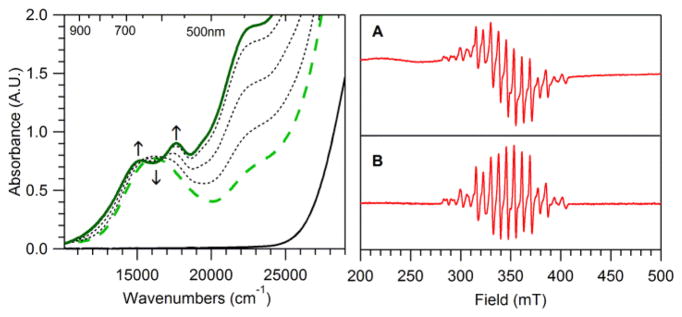
Left: Electronic absorption spectra of a 7.5 mM acetonitrile solution of 1 (solid black line) treated with 1 equiv. KO2 at −40 °C in MeCN. The black dashed traces shows the conversion of 2 (green dashed trace) to 3 (solid green trace). Right: A) Perpendicular-mode X-band EPR spectrum of a 5 mM butyronitrile solution of 1 six hours after treatment with 1 equiv. KO2 at −40 °C (complex 3). Recording conditions: 5 K, 9.6374 GHz microwave frequency, 5.02 mW microwave power, 0.4 mT modulation amplitude, 100 kHz modulation frequency, 81.92 ms time constant, and 15 000 point resolution. B) Perpendicular-mode X-band EPR spectrum of a 0.54 mM frozen solution of recrystallized 3 in butyronitrile. Recording conditions: 20 K, 9.6386 GHz microwave frequency, 5.02 mW microwave power, 0.4 mT modulation amplitude, 100 kHz modulation frequency, 81.92 ms time constant, and 15 000 point resolution.
When the peroxomanganese(III) complex 2 is formed using 2 equiv. KO2, it can be converted to 3 by treatment with the MnII starting material 1. In this reaction, 2 was initially formed in ~60% yield (0.006 mmol) by adding 2 equiv. KO2 to a 5 mM solution (0.010 mmol) of 1. When 0.010 mmol 1 were added to the solution containing 2, 0.0027(3) mmol (1.2 ± 0.1 mM) of 3 were rapidly produced (ESI; Figure S6). Thus, approximately 90% of the Mn in the form of 2 is converted to the dimeric complex 3. The same quantity of 3 is formed when 0.5 equiv. 1 was added to 2, indicating that the formation of 3 is dependent on the amount of complex 2 formed by the chemical oxidation of 1. No spectral changes were observed when five equiv. 1 were added to an acetonitrile solution of 3 at 25 °C.
Formation of 3 using H2O2
The oxo-bridged dimanganese(III,IV) complex 3 can be independently prepared in high yield by treatment of 1 with H2O2. Specifically, when 5 equiv. 30% H2O2 and 0.5 equiv. Et3N are added to an aqueous solution of 1 at 5 °C, complex 3 is formed quantitatively. Under these conditions, 3 is stable in solution at 25° C for at least 15 hours (we have not monitored the solution stability of 3 past 15 hours). The molar extinction coefficients, determined by dissolving isolated 3 in MeCN, are 830 M−1 cm−1 and 680 M−1 cm−1 for the electronic absorption bands at 17 700 and 15 000 cm−1, respectively. The perpendicular-mode EPR spectrum of isolated 3 in butyronitrile reveals the same 16-line signal as the EPR spectrum of 3 from the conversion of 2; however, no broad signals from MnII species are observed for the isolated sample of 3 (Figure 2A and 2B). Complex 3 can also be formed in an analogous reaction in MeCN, albeit with ~50% yield. Without the addition of Et3N, 3 is formed in ~30% yield in MeCN over the course of 12 hours, although a large excess of H2O2 (250 equiv.) and lower temperatures (−25 °C) are required. The average oxidation state of the manganese centres in a CH2Cl2 solution of recrystallized 3 was determined to be 3.4 ± 0.3 using an iodometric technique.50
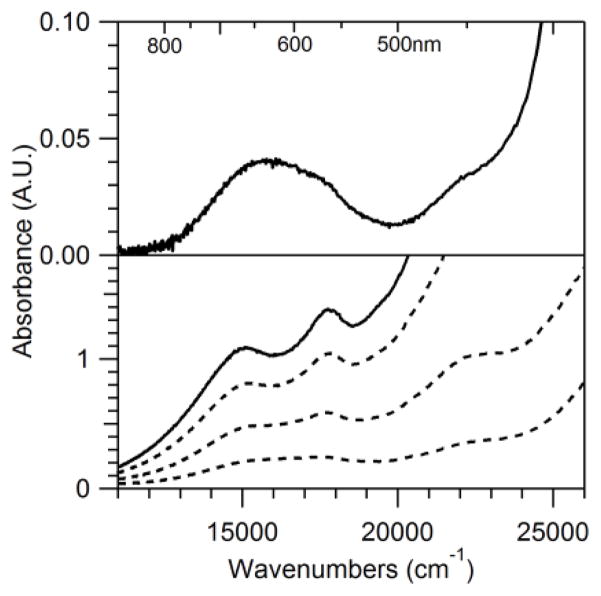
Because urea-H2O2, which serves as an anhydrous source of H2O2, was previously used to generated a peroxomanganese(III) adduct using the closely related, pentadentate mL52 ligand, 28 we investigated the reactivity of 1 with this oxidant. Treatment of a 7.5 mM acetonitrile solution of 1 at −18 °C with 50 equiv. urea-H2O2 changed the originally colorless solution to green. After the solution was filtered into a pre-cooled UV-Vis cuvette at −20 °C, electronic absorption spectroscopy was used to monitor the course of the reaction. The electronic absorption data showed an initial broad feature at ~16 200 cm−1, with a small shoulder around ~17 700 cm−1. The intensity of the band at ~16 200 cm−1 is indicative of formation of 2 in ~3% yield relative to 1. This spectrum resembled a mixture of complexes 2 and 3 (Figure 3, top). As time progressed, the visible feature at ~16 200 cm−1 lost intensity while the visible features at ~15 000 and ~17 700 cm−1 gained intensity (Figure 3, bottom). After four hours, the formation of 3 was completed, with a conversion of ~42%. To explore the effect of a stronger base on this process, 1 was incubated with 0.5 equiv Et3N and then treated with an excess of urea-H2O2. In this reaction, the formation of 3 was completed in 10 minutes, and 3 was formed in higher yield (~57%).
Figure 3.
Electronic absorption spectra showing the reaction of a 7.5 mM acetonitrile solution of 1 with 50 equiv. anhydrous H2O2-urea at −18 °C. The solution was filtered into a pre-cooled cuvette (−20 °C) prior to collecting the first absorption spectrum (top). After four hours at −20 °C, the final absorption spectrum was obtained (bottom; solid line).
The effect of water on the formation of 2 and its conversion to 3 using H2O2-urea was investigated by treating the initial solution of 1 with 50 μL H2O (55 equiv.) before the addition of solid H2O2-urea. Initially a small amount of 2 formed in ~4% yield relative to 1 with a final conversion to 3 of ~32%, relative to the total Mn concentration. The formation of a small amount of 2 with and without excess water in solution using H2O2-urea as the oxidant was surprising because the formation of 2 was not observed when aqueous H2O2 (with Et3N) was used as the oxidant.
Characterization of 3 by MCD spectroscopy
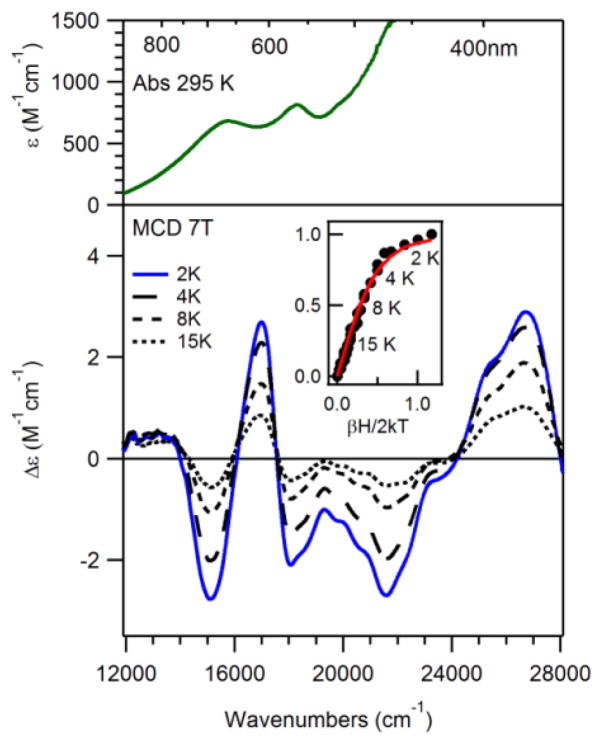
Low-temperature MCD and variable-temperature, variable-field (VTVH) MCD data were collected on a 2.5 mM frozen solution of 3 in butyronitrile. Figure 4 shows both the 295 K electronic absorption and 7 T, VT MCD spectra of 3 (top and bottom, respectively). Whereas the electronic absorption spectrum consists of two maxima at 15 000 and 17 700 cm−1, the 7 T MCD spectra display a series of five features from 11 000 – 28 000 cm−1. VTVH MCD data collected at 16 500 cm−1 (Figure 4, bottom inset) were best fit with an S = 1/2 spin state, consistent with the EPR data. Moreover, the MCD spectrum is very similar to those reported for other bis(μ-oxo)dimanganese(III,IV) complexes.47 Specifically, the MCD spectrum of complex 3 exhibits a pseudo-A term centred at 16 000 cm−1, characteristic of bis(μ-oxo)dimanganese(III,IV) complexes. A Gaussian deconvolution of the MCD spectrum of 3 revealed 10 bands below 28 000 cm−1 (ESI; Figure S7 and Table S1). In an analysis of the MCD spectra of the bis(μ-oxo)dimanganese(III,IV) complexes [Mn2O2(cyclam)2]3+ (cyclam = 1,4,8,1 l-tetraazacyclotetradecane), [Mn2O2(bipy)4]3+ (bipy = 2,2′-bipyridine), and [Mn2O2(phen)4]3+ (phen = 1,10-phenanthroline), Gamelin et al. resolved 13 Gaussian bands.47 Compared to this previous work, two of the low-energy bands (<12 000 cm−1) and one high-energy band (>28 000 cm−1) are not resolved in the MCD spectrum of 3. Nonetheless, the energies of the resolved bands are very similar to those of [Mn2O2(cyclam)2]3+, further supporting the formulation of 3 as [MnIIIMnIV(μ-O)2(N4py)2]3+.
Figure 4.
Top: 295 K electronic absorption spectrum of a 1.66 mM MeCN solution of recrystallized 3. Bottom: 7 T MCD spectra of a 2.5 mM frozen butyronitrile solution of 3 at 2, 4, 8, and 15 K (bottom). Inset: 16 500 cm−1 VTVH MCD data (dots) and fits (solid lines).
Structural characterization of 3 by X-ray diffraction
The structure of 3 was established using X-ray crystallography (Figure 5). Crystals of 3 suitable for such experiments were only obtainable through the addition of a saturated aqueous solution of NBu4PF6 to aqueous solutions of 3. Consequently, solid-state crystal structures were determined for two polymorphic salts of the mixed-oxidation state dimeric cation 3, obtained from separate batches of complex 3 that differ by the types of counter anions, [MnIIIMnIV(μ-O)2(κ4-N4py)2](OTf)2.8(PF6)0.2 (3a) and [MnIIIMnIV(μ-O)2(κ4-N4py)2](PF6)3 (3b). Only one polymorph of complex 3 has a crystallographic inversion centre (3a).
Figure 5.
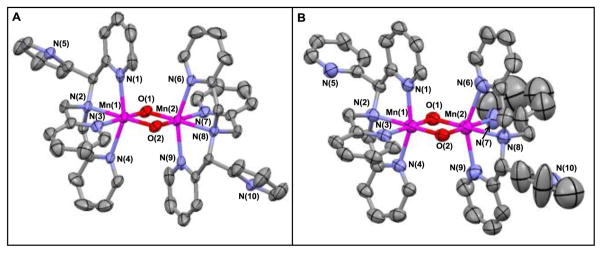
ORTEP diagrams (50% probability ellipsoids) of A) [MnIIIMnIV(μ-O)2(κ4-N4py)2](OTf)2.8(PF6)0.2 (3a) and B) [MnIIIMnIV(μ-O)2(κ4-N4py)2](PF6)3 (3b) Hydrogen atoms, counter ions, and solvents of crystallization have been omitted for clarity.
Even though complex 3 is not symmetric, the metrical differences for the two halves of the dimer are expected to be small. The fact that there are small differences in the two similar halves of a rather large molecule might preclude observing them in a crystal structure determination due to packing disorder.51–53 Both salts contain disordered anions with (heavier) P or S atoms and 3a also contains a disordered metal dimer. Nonetheless, it was possible to locate hydrogen atoms for the noncoordinating pyridine ligands of 3a, which permitted an unambiguous identification of carbon and nitrogen atoms. Even with the presence of severely disordered hexafluorophosphate anions and a water solvent molecule of crystallization, the structure of the second polymorphic form 3b clearly shows the anticipated effects of different metal oxidation states and allows one to distinguish the axially elongated Mn(III) centre Mn(2) from the Mn(IV) centre Mn(1) (Table 2). Since the dimer is disordered in 3a, the Mn(III)- and Mn(IV)-ligand bond distances and angles are essentially averaged in the crystal structure and agree well with the metrical parameters determined from the EXAFS data for 3 (vide infa), which likewise represent average Mn-ligand interatomic distances. The metrical parameters determined for 3a are also in good agreement with the average metal-to-ligand bond lengths and angles for both metals in 3b (Table 1).
Table 2.
Mn K-edge XAS Near-Edge Properties of [MnIIIMnIV(μ-O)2(N4py)2]3+(3), [MnII(N4py)(OTf)]+, [MnIV(O)(N4py)]2+ and other bis(μ-oxo)dimanganese(III,IV) complexes.
| complex | edge energy (eV) | pre-edge energy (eV) | pre-edge peak heighta | reference |
|---|---|---|---|---|
| [MnIIIMnIV(μ-O)2(N4py)2]3+ | 6550.6 | 6541.4 | 0.074 | b |
| Mn-catalase (MnIIIMnIV) | 6549.2 | ~6540 | NRc | 55 |
| [MnIIIMnIV(μ-O)2(phen)4]3+ | 6549.6 | 6539.6 | NRc | 56 |
| [MnIIIMnIV(μ-O)2(pda)2]− d | 6549.8 | 6540.4 | NRc | 21 |
| [MnIV(O)(N4py)]2+ | 6550.8 | 6541.9 | 0.077 | 44 |
| [MnII(N4py)(OTf)]+ | 6547.3 | 6540.6 | 0.042 | 44 |
To permit comparison of pre-edge peak heights, each XAS spectrum was normalized with respect to the most intense fluorescence peak.
This work.
Not reported.
pda2− = picolyldiacetic acid.21
Table 1.
Selected bond distances (Å) and angles (°) for [MnIIIMnIV(μ-O)2(N4py)2](OTf)2.8(PF6)0.2 (3a), [MnIIIMnIV(μ-O)2(N4py)2](PF6)3 (3b), averaged bond distances and angles for 3b, and from EXAFS data analysis of 3.
| 3a a | 3b b | EXAFS | |
|---|---|---|---|
| Mn(1)···Mn(2) | 2.6483(8) | 2.648(2) | 2.63 |
| Mn(1)–O(1) | 1.815(3) | 1.787(5) | |
| Mn(1)–O(2) | 1.812(3) | 1.767(6) | 1.79 |
| Mn(2)–O(1) | 1.815(3) | 1.835(6) | |
| Mn(2)–O(2) | 1.812(3) | 1.834(5) | |
| Mn(1)–N(1) | 2.116(4) | 2.012(6) | |
| Mn(1)–N(2) | 2.096(4) | 2.094(7) | |
| Mn(1)–N(3) | 2.055(4) | 2.055(5) | |
| Mn(1)–N(4) | 2.143(4) | 2.045(7) | 2.00 |
| Mn(2)–N(6) | 2.143(4) | 2.274(8) | 2.17 |
| Mn(2)–N(7) | 2.055(4) | 2.091(5) | |
| Mn(2)–N(8) | 2.096(4) | 2.129(6) | |
| Mn(2)–N(9) | 2.116(4) | 2.236(8) | |
| O(1)–Mn(1)–O(2) | 86.2(1) | 87.4(2) | |
| O(1)–Mn(2)–O(2) | 86.2(1) | 84.0(2) | |
| Mn(1)–O(1)–Mn(2) | 93.8(1) | 93.9(2) | |
| Mn(1)–O(2)–Mn(2) | 93.8(1) | 94.6(2) | |
| N(1)–Mn(1)–N(4) | 155.7(2) | 159.3(2) | |
| N(6)–Mn(2)–N(9) | 155.7(2) | 149.6(2) |
Average Mn-ligand distances for 3a are as follows: Mn-O = 1.813 Å; Mn-N = 2.102 Å.
Average Mn-ligand distances for 3a are as follows: Mn-O = 1.806 Å; Mn-N = 2.117 Å.
The XRD structure of 3 clearly establish the κ4-N4py motif, which was previously proposed for 2.28 The dissociation of a pyridine arm in a bis(μ-oxo)dimanganese complex is not unprecedented. Anderlund and co-workers recently described two bis(μ-oxo)dimanganese(IV,IV) complexes supported by the pentadentate N4O bpmg and mcbpen ligands (bpmg = 2-[[2-[bis(pyridin-2-ylmethyl)amino]ethyl](methyl)amino]acetic acid, and mcbpen = N-methyl-N′-carboxymethyl-N,N′-bis(2-pyridylmethyl)ethane-1,2-diamine) that likewise feature noncoordinating pyridine arms in the XRD structures.54
Structural characterization of 3 by Mn-K edge X-ray absorption spectroscopy
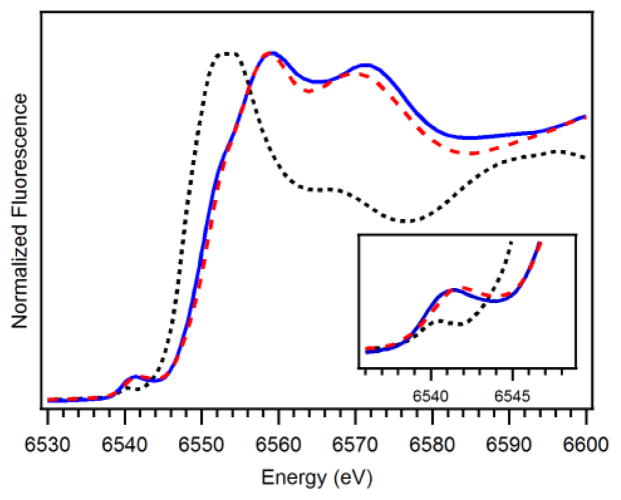
Further structural characterization of 3 was obtained by X-ray absorption studies at the Mn K-edge. The X-ray absorption near edge spectrum (XANES) of 3 exhibits a single pre-edge feature, presumably from a 1s – 3d transition, at 6541.4 eV (Figure 6). For comparison, the XANES spectra44 of [MnII(N4py)(OTf)]+ (1+) and [MnIV(O)(N4py)]2+ are included in Figure 6 and discussed below. The edge energy of 3, fit to the maximum of the first inflection point, was 6550.6 eV, which is in good agreement with the edge energies of other synthetic MnIIIMnIV complexes (~6549.7 eV; see Table 2), as well as the superoxidized (i.e., MnIIIMnIV) form of Mn-catalase (6549.2 eV).55 The Fourier transform (R′ space) of the extended X-ray absorption fine structure (EXAFS) data for 3 has two principal peaks centred at R′ = 1.3 and 2.4 Å (Figure 7, bottom). These features are well fit with six shells of scatterers (Table 3). The short shell of O scatterers at 1.79 Å corresponds to the bridging oxygen atoms observed with average Mn-O distances of 1.81 Å in the XRD structures. The EXAFS shells at 2.00 and 2.17 Å are in good agreement with the average distances of the equatorial and axial nitrogen atoms from the Mn ions in the XRD structures (Table 1). The most prominent peak in the Fourier transform at R′ = 2.4 Å is due to the strong Mn•••Mn scattering, which requires one Mn at 2.63 Å. The inclusion of two outer-sphere shells of carbon scatterers at 2.81 and 2.96 Å significantly improves the GOF; however, the number of carbon atoms in each shell does not have a large effect on the quality of the fit (ESI; Table S2).
Figure 6.
Mn K-edge XANES of [MnIIIMnIV(μ-O)2(N4py)2]3+ (blue solid trace), [MnII(N4py)(OTf)]+ (black dotted trace),44 and [MnIV(O)(N4py)]2+ (red dashed trace)44 at 20 K.
Figure 7.
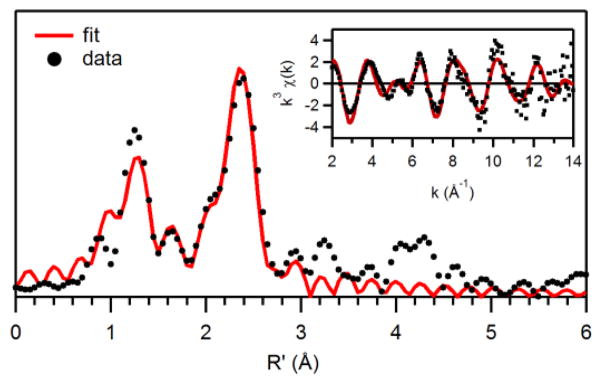
Fourier transforms of Mn K-edge EXAFS data [k3χ(k)] and raw EXAFS spectra (insets), experimental data (···) and fits (−) for [MnIIIMnIV(μ-O)2(N4py)2]3+. Details regarding the EXAFS fits are given in Tables 1 and S3.
Table 3.
EXAFS Fitting Results for [MnIIIMnIV(μ-O)2(N4py)2]3+ Complex.
| Mn–O
|
Mn––N
|
Mn···C
|
Mn···Mn
|
|||||||||
|---|---|---|---|---|---|---|---|---|---|---|---|---|
| n | r (Å) | σ2 × 10³ (Å)2 | n | r (Å) | σ2 × 10³ (Å)2 | n | r (Å) | σ2 × 10³ (Å)2 | n | r (Å) | σ2 × 10³ (Å)2 | |
| [MnIIIMnIV(μ-O)2(N4py)2]3+ | 2 | 1.79 | 4.2 | 2 | 2.00 | 3.6 | 4 | 2.81 | 4.4 | 1 | 2.63 | 1.8 |
| 1 | 2.17 | 3.7 | 5 | 2.96 | 4.2 | |||||||
Fourier transform range for [MnIIIMnIV(μ-O)2(N4py)2]3+: k = 2 – 14.3 Å−1 (resolution 0.128 Å).
Discussion
The reactivity of a mononuclear MnII complex, supported by a pentadentate aminopyridyl ligand, with superoxide and hydrogen peroxide (with base) at low temperatures revealed a reaction landscape that, to the best of our knowledge, is unique amongst synthetic MnII complexes. A MnIII-O2 species was generated from the addition of superoxide to a solution of [MnII(N4py)(OTf)]+ and this species was subsequently shown to react with additional [MnII(N4py)(OTf)]+ to form a heterovalent bis(μ-oxo)dimanganese(III,IV) complex. This oxo-bridged dimer was also generated by treating [MnII(N4py)(OTf)]+ with excess hydrogen peroxide and was characterized structurally and spectroscopically. Notably, these chemical conversions require flexibility in the denticity of the N4py ligand, which changes from pentadentate in the MnII complex to tetradentate in the MnIII-O2 and oxo-bridged MnIIIMnIV species. Such change in ligand denticity has been termed flexidentate by Stratton and Busch.57 The tetradentate binding of the N4py ligand in the peroxomanganese(III) complex [MnIII(O2)(N4py)]+ is supported by previous spectroscopic and computational studies;28 however, those studies were unable to definitively establish which type of pyridine group (i.e., methylenepyridine or pyridinylmethane) is dissociated. Given that the XRD structure of 3 shows dissociation of one of the pyridinylmethane moieties, it appears most probable that the same type of pyridine arm is noncoordinating in the corresponding peroxomanganese(III) complex.
While the peroxomanganese(III) complex 2 can be readily generated chemically from 1 using a molar excess of KO2, the reaction of 1 with either aqueous H2O2 in the presence of base or H2O2-urea generates 3 even at low temperatures. This is in contrast to a number of MnII complexes, also supported by aminopyridyl ligands, that react with either KO2 or H2O2 and base, to generate MnIII-O2 adducts at low temperatures (−20 to −40 °C).26–29,31,37,38 Indeed, the closely related complexes [MnII(mL52)]2+ and [MnII(imL52)]2+, which also feature pentadentate N5 ligands (Figure 8), react with H2O2 at −20 to −40 °C to give peroxomanganese(III) adducts.28,37,38 On the basis of detailed spectroscopic and computational studies of the [MnIII(O2)(mL52)]+ and [MnIII(O2)(imL52)]+ complexes, the mL52 and imL52 ligands are bound in a tetradentate fashion.28 For [MnII(mL52)]2+, formation of the peroxomanganese(III) complex is most effective using H2O2-urea as the oxidant.38 Electronic absorption data provides evidence for the generation of a small amount of 2 within 60 seconds of reaction of 1 with H2O2-urea, but this species is quickly overcome by the formation of 3 (Figure 3). On the basis of these limited data, it is not clear whether or not the MnIII-O2 adduct is an intermediate en route to formation of 3 when H2O2-urea is the oxidant.
Figure 8.
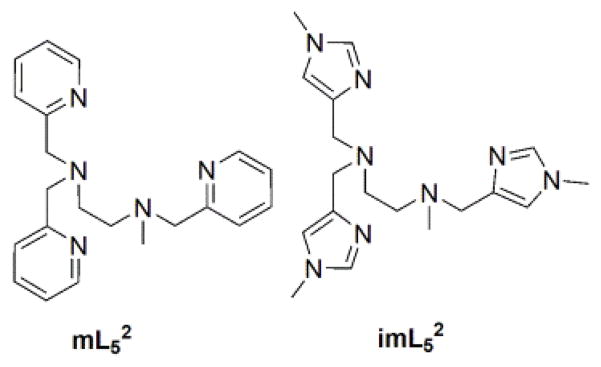
Pentadentate ligands mL52 and imL52.
While there are myriad reports on the formation of oxo-bidged dimanganese compounds by reaction of mononuclear MnII species with H2O2,1,2,11,47 the exact mechanism by which the dimeric species are formed is not well established.58–60 Given that the MnIII-O2 adducts of N4py, mL52, and imL52 all feature supporting ligands bound in a tetradentate fashion through dissociation of a pyridylmethyl or imidazolylmethyl arm, differences in the dissociation rates of these arms would be reasonably expected to impact the formation of the MnIII-O2 species and thus influence how these complexes react with different oxidants. The N4py ligand, which consists of four pyridyl arms from a central tertiary amine (Scheme 1), has a fundamentally different structure than the mL52 and imL52 ligands that feature a central ethylenediamine moiety (Figure 8). The different structures of these ligands could impact the dissociation rates of the pyridylmethyl or imidazolylmethyl arms. Any discussion of the specific elementary steps impacted by dissociation of these arms would be overly speculative, however, as the mechanism (or mechanisms) for formation of MnIII-O2 adducts by reaction of MnII precursors with H2O2 and base is not established.
XAS comparison of MnII, oxo-bridged MnIIIMnIV, and terminal MnIV=O species
For comparison of this series of complexes supported by the N4py ligand, the XANES spectra of a frozen aqueous sample of 1 and a frozen CF3CH2OH sample of [MnIV(O)(N4py)]2+ (4) (Figure 6) and the EXAFS data and fits (ESI; Table S3 and Figure S8) are considered.44 Relative to 1, the Mn K-edge energies of 3 and 4 are blue-shifted by over 3 eV, consistent with the higher oxidation state of Mn in the two latter compounds. The pre-edge feature of 4 is at a higher energy and intensity than those of 3 and 1 (Table 2). However, the variation in pre-edge position and height among this series are fairly modest, especially between the 4 and 3, which is consitent with the XANES of 3 being reflective of an average of the MnIII and MnIV properties.
Formation of [MnIIIMnIV(μ-O)2(N4py)2]3+ from [MnII(N4py)(OTf)]+ and Superoxide
In the currently proposed mechanism for cofactor assembly in Mn-RNR, a dinuclear MnII centre reacts with O2− to generate a bis(μ-oxo)dimanganese(III,IV) species.12,14,15 Our observation that 1 converts to 3 upon reaction with a limiting amount of O2− mimics this chemistry. In this process, the MnIII-O2 complex serves as an intermediate. We propose that the nucleophilic peroxo ligand on 2 reacts with the MnII centre in 1 to form 3. This proposal is consistent with the following observations: i) 2 does not decay to 3 in significant quantities when the former is generated in higher yields, ii) the addition of 1 to 2 leads to the formation of 3 in ~90% yield relative to the amount of 2 generated, and iii) equal amounts of 3 are produced when either 0.5 or 1 equiv. 1 is added to 2 (i.e., the formation of 3 is limited by the amount of 2).
The reactivity of 1 with superoxide is highly reminiscent of previous work done independently by Dismukes58 and Perrée- Fauvet60 using MnII(TPP) (TPP = tetraphenylporphyrin). In both cases, a [MnIIIMnIV(μ-O)2(TPP)]− species, formulated on the basis of EPR data, was proposed to form upon reaction of [MnII(TPP)] with O2−. Notably, the formation of the MnIIIMnIV dimer was only observed when the ratio of O2− to [MnII(TPP)(py)] was 0.5:1.60 When a 1:1 ratio was used, the [Mn(O2)(TPP)]− species was presumed to form in high yield and the MnIIIMnIV dimer was not observed. Our current work thus extends this prior base of knowledge to a non-porphyrinoid manganese system and provides further details on these transformations.
It is tempting to speculate that the reaction between 1 and 2 to produce 3 proceeds through a dinuclear peroxo-bridged intermediate [MnIIMnIII(μ-O2)(κ4-N4py)2]3+ (Scheme 2).58,60 Two electrons are required to convert the peroxo ligand to the two oxo ligands in [MnIIIMnIV(μ-O)2(κ4-N4py)2]3+. The MnII and MnIII centres of the peroxo-bridged intermediate could each provide an electron to cleave the peroxo bond, resulting in the formation of 3. Labelling experiments with K18O2 could, in principle, be used to establish the origin of the bridging oxo ligands in 3. However, in practice, these experiments were complicated due to the limited solubility of superoxide without excess 18-crown-6 ether present in solution. When 18-crown-6 ether was added to increase the solubility of K18O2, the ESI-MS data were dominated by the 18-crown-6 ether signal.
Scheme 2.
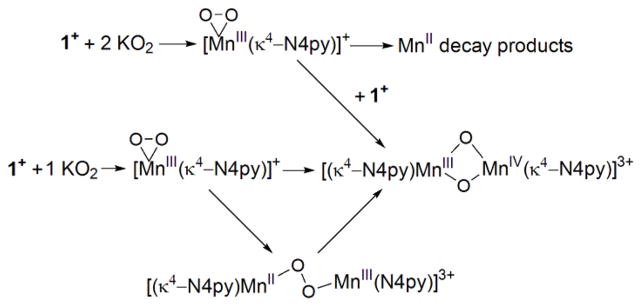
Groni et al. proposed the formation of a homovalent dinuclear peroxo-bridged intermediate, [MnIIIMnIII(μ-O2)(mL52)2]4+, en route to the formation of bis(μ-oxo)dimanganese(III,IV) product, [MnIIIMnIV(μ-O2)(mL52)2]3+.38 They suggested that this peroxo-bridged dimanganese(III,III) intermediate is formed by the reaction of [MnIII(O2)(mL52)]+ with [MnIII(OH2)(mL52)]3+ in a basic aqueous medium.38 Unsupported peroxo-bridged dimanganese complexes are rather rare. To the best of our knowledge, the only well-characterized example of an unsupported peroxo-bridged dimanganese complex was reported earlier this year by Coggins et al.40 The {[MnIII(SMe2N4(6-Me-DPEN)]2(trans-μ-1,2-O2)}2+ (6-Me-DPEN = N,N-Bis(6-methyl-2-pyridilmethyl)ethane-1,2-diamine) complex features a peroxo ligand bridged between two MnIII ions in an end-on trans-μ-1,2-fashion.40 A peroxo-bridged Mn cluster, the trinuclear Mn2III μ-peroxo complex [Mn3(dien)2(OAc)2(μ-O2)Cl](ClO4)2 (dien = diethylenetriamine),61 and a bis(μ-oxo)dimanganese(IV,IV) complex with a cis-μ-1,2-peroxo bridge, [L2Mn2(μ-O)2(μ-O2)](ClO4)2 (L = 1,4,7-trimethyl-1,4,7-triazacyclononane), 62 have also been described.
Conclusion
The reactivity of [MnII(N4py)(OTf)]+ with superoxide and hydrogen peroxide is unique among synthetic mononuclear MnII complexes as a peroxomanganese(III) intermediate was formed from the reaction of 1 with superoxide, whereas a heterovalent bis(μ-oxo)dimanganese(III,IV) complex was formed in high yields from the reaction of 1 with hydrogen peroxide and base. The MnIII-O2 intermediate was converted to the heterovalent oxo-bridged manganese(III,IV) dimer by a subsequent reaction with [MnII(N4py)(OTf)]+. This conversion of two MnII species to an oxo-bridged MnIIIMnIV compound using O2− as oxidant mimics the formation of the MnIIIMnIV form of Mn-RNR. The oxo-bridged dimer was characterized structurally and spectroscopically, which revealed a change in denticity of the N4py ligand from pentadentate in the MnII complex to tetradentate in the oxo-bridged dimer.
Experimental
Materials and methods
All chemicals and solvents were obtained from commercial vendors and were ACS reagent-grade or better and used as received. Electronic absorption spectra were obtained on either a Varian Cary 50 Bio or an Agilent 8453 spectrophotometer, both of which were interfaced with a Unisoku cryostat (USP-203-A) capable of maintaining temperatures between 150 and 373 K. Mass spectrometry experiments were performed using an LCT Primers MicroMass electrospray time-of-flight instrument.
Synthesis
The synthesis of N4py ligand was performed according to a previously described procedure.63,64 1 was synthesized by reacting N4py ligand with MnII(OTf)2 in an acetonitrile (MeCN) solution in a 1:1 molar ratio as previously reported.28
3 was synthesized as follows. Five equiv. H2O2 (30% aqueous) and 0.5 equiv. triethylamine (Et3N) were slowly added to a 36 mM aqueous solution of [MnII(N4py)(OTf)](OTf) (1) at 5 °C while stirring. The solution instantly changed from colorless to dark forest green and gas evolution was observed. After stirring for one hour, the water was removed in vacuo. The solid was redissolved in cold MeCN and a precipitate was formed from the solution by layering with cold ether. The solvent was decanted and the precipitate was washed with cold ether and dried (yield 95%). ESI-MS data were as follows: {[MnIIIMnIV(μ-O)2(N4py)2](OTf)2}+ m/z = 1174.1285 (calc 1174.1305). To grow X-ray diffraction quality crystals, an aqueous solution of 3 (25 mM) was treated with a saturated aqueous solution of tetrabutylammonium hexafluorophosphate (NBu4PF6) dropwise at 5 °C and was stirred for 30 minutes. The green precipitate that formed was isolated by filtration, rinsed with ether, and dried in vacuo. Recrystallization of the crude solid from butyronitrile (PrCN)-diethyl ether afforded dark green crystals of [MnIIIMnIV(μ-O)2(N4py)2](PF6)3. Elemental analysis [MnIIIMnIV(μ-O)2(N4py)2](PF6)3•C4H7N•C4H10O: C54H59F18Mn2N11O3P3 calc (%): C 44.58, H 4.09, N 10.59; found (%): C 44.46, H 4.07, N 10.49.
The average oxidation state of the Mn in 3 was determined using an iodometric technique.50 A 2.5 mM solution of recrystallized 3 was prepared in CH2Cl2 and a 0.25 mL aliquot of this solution was transferred to a 10 mL volumetric flask containing 0.25 mL glacial acetic acid and 4.8 mg tetrabutylammonium iodide. The volume was then adjusted to 10 mL with CH2Cl2. The bright yellow solution was mixed and the absorbance was measured in a 0.5 cm cuvette at 25 °C immediately after mixing. The triiodide produced was quantified by measuring the absorbance of the solution at 295 and 365 nm and the final oxidation state of the manganese was determined by the ratio of the triiodide liberated and the Mn consumed.50 The average oxidation state of the Mn in recrystallized 3 was 3.4 ± 0.3 (average of four separate experiments).
A similar method was followed to determine the average oxidation state of the Mn in solution following the reaction of 1 with one equiv. KO2 at −40 °C. For this reaction, a 5 mM MeCN solution of 1 was treated with one equiv. KO2 at −40 °C. The reaction was monitored by electronic absorption and after six hours, the formation of 3 was complete. A 0.25 mL aliquot was quickly transferred to a 10 mL volumetric flask containing 0.25 mL glacial acetic acid and 4.8 mg tetrabutylammonium iodide. The volume was then adjusted to 10 mL with CH2Cl2. The bright yellow solution was mixed and the absorbance was measured in a 0.5 cm cuvette at 25 °C immediately after mixing. The average oxidation state of the Mn in the reaction mixture was 2.48 ± 0.02 (average of two separate experiments).
X-Ray Diffraction Experiments for [Mn(O)(C23H21N5)]2•2.8 CF3SO3•0.2 PF6•2 CH3CN (3a)
Green single crystals of the CH3CN solvated mixed salt, [Mn(O)(C23H21N5)]2 • 2.8 CF3SO3 • 0.2 PF6 (3a), obtained from slow diffusion of diethyl ether into an acetonitrile solution of 3 at −20 °C, are at 100(2) K, triclinic, space group P 1̄ – Ci1 (No. 2) with a = 11.0548(5) Å, b = 11.7210(4) Å, c = 12.1500(4) Å, α = 96.673(2)°, β = 105.695(3)°, γ = 91.203(3)°, V = 1503.1(1) Å3 and Z = 1 formula units {dcalcd = 1.552 g/cm3; μa(CuKα) = 5.235 mm−1}. A full set of unique diffracted intensities (5685 frames with counting times of 5 to 12 seconds and an ω- or ϕ-scan width of 0.50°) was measured65 for a single-domain specimen using monochromated CuKα radiation (λ= 1.54178 Å) on a Bruker Proteum Single Crystal Diffraction System equipped with Helios multilayer optics, an APEX II CCD detector and a Bruker MicroSTAR microfocus rotating anode x-ray source operating at 45kV and 60mA. All entities appear to be disordered. The Mn(III)/Mn(IV) mixed-valence {[Mn(O)(C23H21N5)]2}3+ cationic dimer utilizes a crystallographic inversion center at (0, ½, ½) in the unit cell. The first triflate anion has two (61%/39%) different orientations in the asymmetric unit. The second triflate is disordered about a crystallographic inversion center at (0, 1,0) in the unit cell and shares this volume with a [PF6]− anion 20% of the time. The final structural model incorporated anisotropic thermal parameters for all nonhydrogen atoms of the metal dimer, CH3CN solvent molecule, both partial-occupancy orientations for the first [O3SCF3]− anion, the S and three F atoms of the second [O3SCF3]− anion and the P atom of the [PF6]− anion. Isotropic thermal parameters were utilized for the oxygen and carbon atoms of the second [O3SCF3]− anion, the F atoms of the [PF6]− anion and all hydrogen atoms of the metal dimer and CH3CN solvent molecule of crystallization.
Surprisingly, even with all of this disorder, a difference Fourier clearly revealed all of the hydrogen atoms bonded to carbon atoms in the dimer. This permitted identification of the non-coordinated nitrogen atom N(5) since it had no significant residual electron density near it but carbon atom C(20) did. The hydrogen atoms were initially included in the structural model as individual isotropic atoms whose parameters were allowed to vary in least-squares refinement cycles. They were later placed at fixed idealized positions (sp2- or sp3-hybridized geometry and C-H bond lengths of 0.95 – 1.00 Å) with variable isotropic thermal parameters. The acetonitrile methyl group was incorporated in the structural model as a rigid group (using idealized sp3-hybridized geometry and C-H bond lengths of 0.98 Å) with idealized “staggered” geometry. The methyl hydrogen atoms were assigned fixed isotropic thermal parameters with values 1.50 times the equivalent isotropic thermal parameter of the methyl carbon atom. The bond lengths and angles for the second triflate and the minor-occupancy (39%) orientation for the first triflate were restrained to have values similar to those for the major-occupancy (61%) orientation of the first triflate anion. Octahedral geometry was imposed on the [PF6]− anion by restraining the nonbonded F---F distances to be appropriate multiples of a free-variable P-F bond length that refined to a final value of 1.36(1) Å. The anisotropic thermal parameters of the second triflate sulfur atom, S(2), and the [PF6]− phosphorus atom, P, were also restrained to have identical values.
X-Ray Diffraction Experiments for [Mn(O)(C23H21N5)]2 • 3 PF6 • 0.5 H2O (3b)
Green single crystals of the hydrated salt, [Mn(O)(C23H21N5)]2 • 3 PF6 • 0.5 H2O (3b), obtained from slow diffusion of diethyl ether into butyronitrile solution of 3 at −20 °C, are at 100(2) K, monoclinic, space group P21/c – C2h5 (No. 2) with a = 25.7399(6) Å, b = 12.5771(3) Å, c = 17.9093(4) Å, β = 105.427(1)°, V = 5588.9(2) Å3 and Z = 4 formula units {dcalcd = 1.568 g/cm3; μa(CuKα) = 5.472 mm−1}. A full set of unique diffracted intensities (5575 frames with counting times of 5 to 12 seconds and an ω- or ϕ-scan width of 0.50°) was measured65 for a single-domain specimen using monochromated CuKα radiation (λ= 1.54178 Å) on a Bruker Proteum Single Crystal Diffraction System equipped with Helios multilayer optics, an APEX II CCD detector and a Bruker MicroSTAR microfocus rotating anode x-ray source operating at 45kV and 60mA. Since the second PF6− anion (containing phosphorus atom P2) in this structure is bonded to itself across a crystallographic inversion center it must be disordered. A common occupancy factor for the seven nonhydrogen atoms of this anion refined to 0.51. The occupancy factors were therefore fixed at 0.50 in subsequent refinement cycles. The P1 phosphorus atom of the first PF6− anion occupies another crystallographic inversion center. There are therefore a total of three (two half occupancy and two full occupancy) PF6− anions per Mn dimer and this is critical to the proper identification of the dinuclear cation with Mn(III) and Mn(IV) metals bridged unsymmetrically by two O2− ligands. The asymmetric unit also contains two partial-occupancy water molecules of crystallization in the vicinity of the half-occupancy PF6− anion. These water solvent molecules of crystallization are disordered equally between two closely spaced (1.87 Å) sites in the unit cell and presumably represent a half-occupancy water that occupies the same space as the disordered half-occupancy PF6− anion; each water oxygen site is occupied a fourth of the time. Whereas the various metric parameters for the anions could have been restrained to have more uniform values, this was not done because it was felt that this might bias the structural results since one must correctly identify the number and nature of the anions in this structure to properly identify the cationic dimer. Nitrogen atoms in the non-coordinated pyridine rings were identified based on the values of equivalent isotropic thermal parameters with all ring atoms modeled as carbon; these also corresponded to the ring orientations observed for compound 3a where ring hydrogens were observed in a difference Fourier.
The final structural model incorporated anisotropic thermal parameters for all nonhydrogen atoms and isotropic thermal parameters for all hydrogen atoms of the metal dimer. Hydrogen atoms were included in the structural model for the dimer at fixed idealized positions (sp2- or sp3-hybridized geometry and C-H bond lengths of 0.95 – 1.00 Å) with isotropic thermal parameters fixed at values 1.2 times the equivalent isotropic thermal parameter of the carbon atom to which they are covalently bonded. The pyridine ring containing carbon atoms C(2B)-C(6B) appears to be disordered between two closely-separated sites. The anisotropic thermal parameters for five carbon atoms [C(3B), C(4B), C(5B), C(6B) and C(22B)] were mildly restrained to have more isotropic values. Hydrogen atoms were not located or included for the disordered partial-occupancy water molecules of crystallization.
CCDC-936496 contains the supplementary crystallographic data for [Mn(O)(C23H21N5)]2 - 2.8 CF3SO3 - 0.2 PF6 (3a) and CCDC-936497 contains the supplementary crystallographic data for [Mn(O)(C23H21N5)]2 - 3 PF6 (3b). This data can be obtained free of charge from the Cambridge Crystallographic Data Centre via www.cccdc.cam.ac/data_request/cif.
EPR spectroscopy
Samples of 2 were prepared as follows. Two equiv. KO2, in the form of a solution prepared from 14.2 mg KO2 and 200 mg 18-crown-6 dissolved in 2 mL butyronitrile, were added to a 5 mM solution of [MnII(N4py)(OTf)2] (1) in butyronitrile at −40 °C. Once formation of [MnIII(O2)(N4py)]+ (2) was judged complete by electronic absorption spectroscopy, the sample was further cooled to −80 °C, and ~250 μL were transferred to a pre-cooled 4 mm quartz EPR tube maintained at −80 °C using a cold ethanol bath. The sample was then flash-frozen in liquid N2. An EPR sample of 3 was prepared by transferring 250 μL of a 0.5 mM solution of 3 in butyronitrile to a 4 mm quartz EPR tube, and flash-frozen in liquid N2. All EPR spectra were collected on an X-band (9 GHz) Bruker EMXPlus spectrometer equipped with an Oxford ESR900 continuous-flow liquid helium cryostat and an Oxford ITC503 temperature system to monitor and regulate the temperature. A dual mode cavity (Bruker ER4116DM) was used for perpendicular and parallel mode detection. Spectra were recorded under non-saturating conditions using 100 kHz field modulation. Other parameters (microwave frequency, modulation amplitude, microwave power, time constant, conversion time, sweep rate, and field resolution) are given in the captions of the appropriate figures. The baseline contribution was insignificant and so, a blank spectrum was not subtracted from the spectra.
Mn K-edge X-ray absorption spectroscopy
An XAS sample of 3 was prepared from a 30 mM aqueous solution of the complex. Approximately 150 μL of this solution were transferred to a sample holder covered with Kapton tape and the sample was flash-frozen in liquid N2.
XAS data collection
XAS spectra were recorded on beamline X3B at the National Synchrotron Light Source (NSLS), Brookhaven National Lab (storage ring conditions, 2.8 GeV, 100 – 300 mA). Mn K-edge X-ray absorption spectra were recorded on frozen solutions maintained at 25 K with a helium Displex closed-cycle cryostat over the energy range 6.4 – 7.4 keV (Si(111) monochromater). Data were obtained as fluorescence excitation spectra using either a solid-state 13-element germanium detector (Canberra). Contamination of higher harmonics radiation was minimized by using a harmonic rejection mirror. Background fluorescence signal was reduced by use of a 6 μm chromium filter. A manganese foil spectrum was recorded concomitantly for internal energy calibration and the first inflection point of the K-edge energy was assigned to 6539.0 eV. Spectra were measured with 5 eV steps below the edge, 0.3 eV steps in the edge region, and steps equivalent to 0.05 Å−1 increments above the edge (region borders were 6354, 6529, and 6554 eV). The XAS spectrum of complex 3 (30 mM in H2O) represents the average of 9 scans.
XAS data analysis
XAS data reduction and averaging were treated entirely using the program EXAFSPAK.66 Pre-edge background intensity was removed by fitting a Gaussian function to the pre-edge background and subtracting this function from the whole spectrum. The spectrum was then fit with a three-segment spline with fourth-order polynomial components to remove low-frequency background. EXAFS refinement was carried out on k3χ(k) data, using phase and amplitude functions obtained from FEFF, version 6.67 The k-space used for data analysis of 3 was k = 2 – 14.3 Å−1 (resolution 0.128 Å). For each fit, the parameters r (average distance between Mn and scattering atom) and σ2 (Debye-Waller factor) were optimized, while n, the number of atoms in the shell, was kept fixed. n was varied by integer steps systematically. The goodness-of-fit (GOF) was evaluated by the parameter F, where F = Σ(χcalcd − χexpt)2/N, and N is the number of data points. The threshold energy, E0, in electronvolts (k = 0 point) was kept at a common, variable value for every shell of a given fit.
Magnetic circular dichroism spectroscopy
The MCD sample of 3 was 2.5 mM in butyronitrile. MCD spectra were collected on a Jasco circular dichroism spectrometer (J-815) interfaced with an Oxford Instruments magnetocryostat (SM-4000-8) capable of a horizontal field up to 8 T and a temperature range of 1.5 to 300 K. Low-temperature absorption samples were prepared in acetonitrile and MCD samples were prepared in the glassy solvent butyronitrile (PrCN). VTVH MCD data were fit using software developed by Neese and Solomon.68
Supplementary Material
Acknowledgments
This work was supported by the US NSF (CHE-1056470 to T.A.J.; CHE-0946883 and CHE-0079282 supported instrument purchases). XAS experiments were supported by the Center for Synchrotron Biosciences grant, P30-EB-009998, from the National Institute of Biomedical Imaging and Bioengineering (NIBIB). We thank Dr. Erik Farquhar at NSLS for outstanding support of our XAS experiments and Dr. Pierre Dorlet at Laboratoire Stress Oxydant et Détoxication, CEA Saclay for discussions regarding EPR data.
Footnotes
Electronic Supplementary Information (ESI) available: Temperature-dependent EPR data for 2, electronic absorption spectra for the decay of 2 formed with two equiv. KO2, perpendicular- and parallel-mode EPR spectra for the decay products of 2 formed with two equiv. of KO2, perpendicular-mode EPR spectra of 1, kinetic data for the conversion of 2 to 3, deconvoluted MCD spectra for 3, EXAFS fitting table, and X-ray diffraction data and experimental. See DOI: 10.1039/b000000x/
Magnetic circular dichroism (reference 28) and electron paramagnetic resonance (this work) data collected for frozen solutions of [MnIII(O2)(N4py)]+ indicate only the presence of one peroxomanganese(III) unit, suggesting that a mixture of the two isomers is not present.
An alternative explanation for the maximum chemical formation of 2 with two equiv. KO2 is that 2 is actually formed by the reaction of 1 with peroxide generated by O2− disproportionation. According to this model, the use of 2 equiv. KO2 would result in 66% formation of 2, consistent with the experimental results. However, under this scenario, the formation of 2 would be maximized at 3 equiv. KO2, which is not observed. It is possible that an excess of KO2 is required to maximize the formation of 2 because 1 has modest O2− scavenging activity.
The electronic absorption spectrum of the decayed solution shows two weak bands at 15 000 and 17 700 cm−1, indicating that 2 decayed to 3 in no greater than 10% yield, based on the total Mn concentration (vide infra). However, the perpendicular-mode EPR spectrum of this solution reveals that the yield of 3 is likely much lower than 10%, as only a weak, broad multi-line signal is observed at 345 mT, where the 16-line signal of 3 would be expected (ESI; Figure S3).
Notes and references
- 1.Pecoraro VL, Baldwin MJ, Gelasco A. Chem Rev. 1994;94:807–826. [Google Scholar]
- 2.Wu AJ, Penner-Hahn JE, Pecoraro VL. Chem Rev. 2004;104:903–938. doi: 10.1021/cr020627v. [DOI] [PubMed] [Google Scholar]
- 3.Grove LE, Brunold TC. Comments Inorg Chem. 2008;29:134–168. [Google Scholar]
- 4.Emerson JP, Kovaleva EG, Farquhar ER, Lipscomb JD, Que L., Jr Proc Natl Acad Sci U S A. 2008;105:7347–7352. doi: 10.1073/pnas.0711179105. [DOI] [PMC free article] [PubMed] [Google Scholar]
- 5.Gunderson WA, Zatsman AI, Emerson JP, Farquhar ER, Que L, Lipscomb JD, Hendrich MP. J Am Chem Soc. 2008;130:14465–14467. doi: 10.1021/ja8052255. [DOI] [PMC free article] [PubMed] [Google Scholar]
- 6.Borowski T, Bassan A, Richards NGJ, Siegbahn PEM. J Chem Theory Comput. 2005;1:686–693. doi: 10.1021/ct050041r. [DOI] [PubMed] [Google Scholar]
- 7.Opaleye O, Rose RS, Whittaker MM, Woo EJ, Whittaker JW, Pickersgill RW. J Biol Chem. 2006;281:6428–6433. doi: 10.1074/jbc.M510256200. [DOI] [PubMed] [Google Scholar]
- 8.Jackson TA, Brunold TC. Acc Chem Res. 2004;37:461–470. doi: 10.1021/ar030272h. [DOI] [PubMed] [Google Scholar]
- 9.Miller AF. Curr Opin Chem Biol. 2004;8:162–168. doi: 10.1016/j.cbpa.2004.02.011. [DOI] [PubMed] [Google Scholar]
- 10.McEvoy JP, Brudvig GW. Chem Rev. 2006;106:4455–4483. doi: 10.1021/cr0204294. [DOI] [PubMed] [Google Scholar]
- 11.Mullins CS, Pecoraro VL. Coord Chem Rev. 2008;252:416–443. doi: 10.1016/j.ccr.2007.07.021. [DOI] [PMC free article] [PubMed] [Google Scholar]
- 12.Cotruvo JA, Stich TA, Britt RD, Stubbe J. J Am Chem Soc. 2013 doi: 10.1021/ja312457t. [DOI] [PMC free article] [PubMed] [Google Scholar]
- 13.Cotruvo JA, Stubbe J. Proc Natl Acad Sci U S A. 2008;105:14383–14388. doi: 10.1073/pnas.0807348105. [DOI] [PMC free article] [PubMed] [Google Scholar]
- 14.Cotruvo JA, Stubbe J. Biochemistry. 2010;49:1297–1309. doi: 10.1021/bi902106n. [DOI] [PMC free article] [PubMed] [Google Scholar]
- 15.Boal AK, Cotruvo JA, Stubbe J, Rosenzweig AC. Science. 2010;329:1526–1530. doi: 10.1126/science.1190187. [DOI] [PMC free article] [PubMed] [Google Scholar]
- 16.Pecoraro VL, Hsieh WY. Inorg Chem. 2008;47:1765–1778. doi: 10.1021/ic7017488. [DOI] [PubMed] [Google Scholar]
- 17.Shook RL, Borovik AS. Inorg Chem. 2010;49:3646–3660. doi: 10.1021/ic901550k. [DOI] [PMC free article] [PubMed] [Google Scholar]
- 18.Stone KL, Borovik AS. Curr Opin Chem Biol. 2009;13:114–118. doi: 10.1016/j.cbpa.2009.02.008. [DOI] [PMC free article] [PubMed] [Google Scholar]
- 19.Mukhopadhyay S, Mandal SK, Bhaduri S, Armstrong WH. Chem Rev. 2004;104:3981–4026. doi: 10.1021/cr0206014. [DOI] [PubMed] [Google Scholar]
- 20.Chen HY, Tagore R, Das S, Incarvito C, Faller JW, Crabtree RH, Brudvig GW. Inorg Chem. 2005;44:7661–7670. doi: 10.1021/ic0509940. [DOI] [PubMed] [Google Scholar]
- 21.Dubois L, Jacquamet L, Pecaut J, Latour JM. Chem Commun. 2006:4521–4523. doi: 10.1039/b609072a. [DOI] [PubMed] [Google Scholar]
- 22.Hureau C, Blondin G, Charlot MF, Philouze C, Nierlich M, Cesario M, Anxolabéhère-Mallart E. Inorg Chem. 2005;44:3669–3683. doi: 10.1021/ic050243y. [DOI] [PubMed] [Google Scholar]
- 23.Schindler S, Walter O, Pedersen JZ, Toftlund H. Inorg Chim Acta. 2000;303:215–219. [Google Scholar]
- 24.Baldwin MJ, Pecoraro VL. J Am Chem Soc. 1996;118:11325–11326. [Google Scholar]
- 25.Wang K, Mayer JM. J Am Chem Soc. 1997;119:1470–1471. [Google Scholar]
- 26.Geiger RA, Chattopadhyay S, Day VW, Jackson TA. J Am Chem Soc. 2010;132:2821–2831. doi: 10.1021/ja910235g. [DOI] [PubMed] [Google Scholar]
- 27.Geiger RA, Chattopadhyay S, Day VW, Jackson TA. Dalton Trans. 2011;40:1707–1715. doi: 10.1039/c0dt01570a. [DOI] [PubMed] [Google Scholar]
- 28.Geiger RA, Leto DF, Chattopadhyay S, Dorlet P, Anxolabéhère-Mallart E, Jackson TA. Inorg Chem. 2011;50:10190–10203. doi: 10.1021/ic201168j. [DOI] [PubMed] [Google Scholar]
- 29.Geiger RA, Wijeratne G, Day VW, Jackson TA. Eur J Inorg Chem. 2012:1598–1608. [Google Scholar]
- 30.Annaraj J, Cho J, Lee YM, Kim SY, Latifi R, de Visser SP, Nam W. Angew Chem, Int Ed. 2009;48:4150–4153. doi: 10.1002/anie.200900118. [DOI] [PubMed] [Google Scholar]
- 31.Seo MS, Kim JY, Annaraj J, Kim Y, Lee YM, Kim SJ, Kim J, Nam W. Angew Chem, Int Ed. 2007;46:377–380. doi: 10.1002/anie.200603414. [DOI] [PubMed] [Google Scholar]
- 32.Kitajima N, Komatsuzaki H, Hikichi S, Osawa M, Moro-oka Y. J Am Chem Soc. 1994;116:11596–11597. [Google Scholar]
- 33.VanAtta RB, Strouse CE, Hanson LK, Valentine JS. J Am Chem Soc. 1987;109:1425–1434. [Google Scholar]
- 34.Shook RL, Gunderson WA, Greaves J, Ziller JW, Hendrich MP, Borovik AS. J Am Chem Soc. 2008;130:8888–8889. doi: 10.1021/ja802775e. [DOI] [PMC free article] [PubMed] [Google Scholar]
- 35.Shook RL, Peterson SM, Greaves J, Moore C, Rheingold AL, Borovik AS. J Am Chem Soc. 2011;133:5810–5817. doi: 10.1021/ja106564a. [DOI] [PMC free article] [PubMed] [Google Scholar]
- 36.Singh UP, Sharma AK, Hikichi S, Komatsuzaki H, Moro-oka Y, Akita M. Inorg Chim Acta. 2006;359:4407–4411. [Google Scholar]
- 37.Groni S, Blain G, Guillot R, Policar C, Anxolabéhère-Mallart E. Inorg Chem. 2007;46:1951–1953. doi: 10.1021/ic062063+. [DOI] [PubMed] [Google Scholar]
- 38.Groni S, Dorlet P, Blain G, Bourcier S, Guillot R, Anxolabéhère-Mallart E. Inorg Chem. 2008;47:3166–3172. doi: 10.1021/ic702238z. [DOI] [PubMed] [Google Scholar]
- 39.Coggins MK, Martin-Diaconescu V, DeBeer S, Kovacs JA. J Am Chem Soc. 2013;135:4260–4272. doi: 10.1021/ja308915x. [DOI] [PMC free article] [PubMed] [Google Scholar]
- 40.Coggins MK, Sun X, Kwak Y, Solomon EI, Rybak-Akimova E, Kovacs JA. J Am Chem Soc. 2013;135:5631–5640. doi: 10.1021/ja311166u. [DOI] [PMC free article] [PubMed] [Google Scholar]
- 41.Coggins MK, Toledo S, Shaffer E, Kaminsky W, Shearer J, Kovacs JA. Inorg Chem. 2012;51:6633–6644. doi: 10.1021/ic300192q. [DOI] [PMC free article] [PubMed] [Google Scholar]
- 42.Sisemore MF, Selke M, Burstyn JN, Valentine JS. Inorg Chem. 1997;36:979–984. doi: 10.1021/ic9612616. [DOI] [PubMed] [Google Scholar]
- 43.Chen J, Lee YM, Davis KM, Wu X, Seo MS, Cho KB, Yoon H, Park YJ, Fukuzumi S, Pushkar YN, Nam W. J Am Chem Soc. 2013;135:6388–6391. doi: 10.1021/ja312113p. [DOI] [PubMed] [Google Scholar]
- 44.Leto DF, Ingram R, Day VW, Jackson TA. Chem Commun. 2013;49:5378–5380. doi: 10.1039/c3cc00244f. [DOI] [PubMed] [Google Scholar]
- 45.El Ghachtouli S, Vincent Ching HY, Lassalle-Kaiser B, Guillot R, Leto DF, Chattopadhyay S, Jackson TA, Dorlet P, Anxolabéhère-Mallart E. Chem Commun. 2013;49:5696–5698. doi: 10.1039/c3cc41300d. [DOI] [PubMed] [Google Scholar]
- 46.Goodson PA, Glerup J, Hodgson DJ, Michelsen K, Weihe H. Inorg Chem. 1991;30:4909–4914. [Google Scholar]
- 47.Gamelin DR, Kirk ML, Stemmler TL, Pal S, Armstrong WH, Pennerhahn JE, Solomon EI. J Am Chem Soc. 1994;116:2392–2399. [Google Scholar]
- 48.Brewer KJ, Calvin M, Lumpkin RS, Otvos JW, Spreer LO. Inorg Chem. 1989;28:4446–4451. [Google Scholar]
- 49.Goodson PA, Glerup J, Hodgson DJ, Michelsen K, Pedersen E. Inorg Chem. 1990;29:503–508. [Google Scholar]
- 50.Perez-Benito JF, Brillas E, Arias C. Can J Chem. 1990;68:79–81. [Google Scholar]
- 51.Lu YH, Fun HK, Chantrapromma S, Razak IA, Shen Z, Zuo JL, You XZ. Acta Crystallogr, Sect C: Cryst Struct Commun. 2001;57:911–913. doi: 10.1107/s0108270101008617. [DOI] [PubMed] [Google Scholar]
- 52.Manchanda R, Brudvig GW, de Gala S, Crabtree RH. Inorg Chem. 1994;33:5157–5160. [Google Scholar]
- 53.Stebler M, Ludi A, Buergi HB. Inorg Chem. 1986;25:4743–4750. [Google Scholar]
- 54.Berggren G, Thapper A, Huang P, Eriksson L, Styring Sr, Anderlund MF. Inorg Chem. 2011;50:3425–3430. doi: 10.1021/ic102336a. [DOI] [PubMed] [Google Scholar]
- 55.Stemmler TL, Sturgeon BE, Randall DW, Britt RD, Penner-Hahn JE. J Am Chem Soc. 1997;119:9215–9225. [Google Scholar]
- 56.Visser H, Anxolabéhère-Mallart E, Bergmann U, Glatzel P, Robblee JH, Cramer SP, Girerd JJ, Sauer K, Klein MP, Yachandra VK. J Am Chem Soc. 2001;123:7031–7039. doi: 10.1021/ja004306h. [DOI] [PMC free article] [PubMed] [Google Scholar]
- 57.Stratton WJ, Busch DH. J Am Chem Soc. 1958;80:3191–3195. [Google Scholar]
- 58.Dismukes GC, Sheats JE, Smegal JA. J Am Chem Soc. 1987;109:7202–7203. [Google Scholar]
- 59.Horwitz CP, Dailey GC. Comments Inorg Chem. 1993;14:283–319. [Google Scholar]
- 60.Perree-Fauvet M, Gaudemer A, Bonvoisin J, Girerd JJ, Boucly-Goester C, Boucly P. Inorg Chem. 1989;28:3533–3538. [Google Scholar]
- 61.Bhula R, Gainsford GJ, Weatherburn DC. J Am Chem Soc. 1988;110:7550–7552. [Google Scholar]
- 62.Bossek U, Weyhermueller T, Wieghardt K, Nuber B, Weiss J. J Am Chem Soc. 1990;112:6387–6388. [Google Scholar]
- 63.Chang J, Plummer S, Berman ESF, Striplin D, Blauch D. Inorg Chem. 2004;43:1735–1742. doi: 10.1021/ic030242a. [DOI] [PubMed] [Google Scholar]
- 64.Lubben M, Meetsma A, Wilkinson EC, Feringa B, Que L. Angew Chem, Int Ed. 1995;34:1512–1514. [Google Scholar]
- 65.Data Collection: SMART Software Reference Manual. Bruker-AXS; 5465 E. Cheryl Parkway, Madison, WI 53711–5373 USA: 1998. [Google Scholar]
- 66.George GN. EXAFSPAK. Stanford Synchrotron Radiation Laboratory; Stanford, CA: 1990. [Google Scholar]
- 67.Rehr JJ, Mustre de Leon J, Zabinsky SI, Albers RC. J Am Chem Soc. 1991;113:5135–5140. [Google Scholar]
- 68.Neese F, Solomon EI. Inorg Chem. 1999;38:1847–1865. doi: 10.1021/ic981264d. [DOI] [PubMed] [Google Scholar]
Associated Data
This section collects any data citations, data availability statements, or supplementary materials included in this article.


