

Abstract
This study has used immunohistochemical examination of tissue obtained from Alzheimer’s disease (AD) brains and rat hippocampus injected with Aβ1-42 peptide to determine effects of induced inflammatory reactivity on integrity of blood–brain barrier (BBB) and viability of neurons. Tissue from AD, but not non-demented, brains exhibited a diffuse pattern of staining for fibrinogen and immunoglobulin (IgG) indicative of BBB leakiness with considerable fibrinogen immunoreactivity (ir) appearing in association with Aβ deposits. Immunostaining for the endothelial cell specific glycoprotein, von Willebrand factor, showed morphological evidence for altered blood vessels in AD tissue. AD brains also demonstrated extensive areas of fibrinogen ir in association with microglial reactivity. In vivo, intra-hippocampal injection of Aβ1-42 caused time-dependent (1–7 days after injection) increases in double staining of fibrinogen with areas of microgliosis. Two independent pharmacological strategies were employed to examine how Aβ1-42 stimulation (7 days injection) may be linked to neurodegeneration. The defibrinogenating compound, ancrod, reduced inflammatory reactivity, levels of parenchymal fibrinogen and IgG, and was neuroprotective. These results prompted use of Aβ1-42 plus fibrinogen as a novel in vivo inflammatory stimulus and this combination significantly enhanced inflammatory reactivity, vascular perturbations and neuronal damage compared to Aβ1-42 alone. A second approach, using anti-Mac-1 (antibody for antigen CD11b) to block activation of microglia, was highly effective in attenuating effects of Aβ1-42 plus fibrinogen amplification of inflammatory and vascular responses and conferred significant neuroprotection. The overall findings from study of AD tissue and in vivo in Aβ1-42 and Aβ1-42 plus fibrinogen stimulated rat hippocampus suggest microglial responses to promote increased extravasation of blood protein as a critical component in amplifying inflammatory reactivity and causing neuronal damage in inflamed AD brain.
Keywords: Alzheimer’s disease, microglia, blood–brain barrier, fibrinogen, inflammation
Introduction
Blood proteins such as fibrinogen, plasminogen and thrombin have essential functions in the maintenance of integral vasculature homeostatic processes involved in blood clotting. However, under pathological conditions a weakened blood–brain barrier (BBB) could allow extravasation of plasma proteins into parenchymal regions of the brain. A likely consequence of increased infiltration of proteins is the exacerbation of inflammatory responses mediated by the resident immune responding cells, microglia. At present, limited experimental evidence is available to characterize the links between abnormalities in properties of BBB, increased levels of plasma proteins in parenchyma, microglial inflammatory reactivity and neuronal degeneration and their contributions to chronic brain inflammation.
Alzheimer’s disease (AD) brains are characterized by considerable abnormalities and deficiencies in properties of BBB [1–4]. Elevated levels of fibrinogen in brain parenchyma, due to extravasation of the glycoprotein through a weakened BBB, have also been reported in AD brain [5, 6]. Recent work has demonstrated fibrin deposition and damaged vasculature in three different transgenic animal models of AD [7]. In these transgenic models, enhanced levels of fibrinogen exacerbated vascular damage whereas inhibition of fibrinogen attenuated neurovascular pathology. Interestingly, reduction of parenchymal fibrinogen was not associated with any efficacy for neuroprotection.
A critical question is how inflammation could contribute to neurodegeneration in AD brains. We reasoned that previous results, showing microglial responses may be critical effectors for induced vascular and neuronal abnormalities following intra-hippocampal Aβ1-42 injection, as a possible link in this question [8, 9]. In the present study, we have used immunohistochemical analysis to investigate inflammatory reactivity and permeability of BBB to the glycoprotein fibrinogen in tissue obtained from AD patients and also in Aβ1-42-injected rat brain. The strategy was to initially examine cortical tissue obtained from AD and ND (non-demented) brains for extravasation of glycoproteins fibrinogen and immunoglobulin (IgG) into brain parenchyma and for association of specific vascular markers with activated microglia and astrocytes. Subsequently, Aβ1-42 and Aβ1-42 plus fibrinogen-injected rat brain was studied for similar vascular remodelling, gliosis and neuronal viability with two independent pharmacological interventions. The approaches used the defibrinogenating agent ancrod, to deplete plasma fibrinogen, or used the monoclonal antibody anti-Mac-1, to reduce microglial activation. The overall findings suggest microglial–vasculature interactions amplify and maintain a chronic state of inflammation which is ultimately damaging to neurons.
Materials and methods
Human brain tissue and immunohistochemical procedures
Postmortem brain tissues containing the entorhinal cortex from seven ND cases (60–80 years of age; postmortem intervals, 4–24 hrs) and eight AD cases (67–78 years of age; postmortem intervals, 4–10 hrs) were obtained from the Kinsmen Laboratory brain bank at the University of British Columbia (UBC, Vancouver, BC, Canada). All cases of AD were confirmed by the clinical criteria for AD, as defined by the National Institute of Neurological and Communicative Disorders, and the Stroke/Alzheimer’s Disease and Related Disorders Association. ND cases had no clinical or pathological history of AD. Patients with a prior history of hypertension were excluded from this study because hypertension may predispose the patient to develop abnormalities of BBB.
In this study, single/double immunohistochemical methods (visualized using 3,3’-diaminobenzidine (DAB) and nickel–ammonium sulphate as the chromogen) and double immunofluorescent staining (visualized by fluorescent secondary antibody) were applied for human tissue section staining as described below. Single immunohistochemistry was performed as described previously [10]. Free-floating sections (30 μm) from ND and AD tissues were treated for 30 min. with 0.3% hydrogen peroxide (H2O2) solution in phosphate buffered saline with Triton X-100 (PBST; 0.01 M phosphate-buffered saline, pH 7.4, containing 0.3% Triton X-100) and transferred into 5% skim milk in PBST for 1 hr. Sections were then incubated for 48 hrs at 4°C with the following primary antibodies: anti-fibrinogen (1:800; DakoCytomation, Carpinteria, CA, USA) or anti-human IgG (1:100; Serotec, Oxford, UK). Sections were washed and incubated with the appropriate biotinylated secondary antibody (1:1000; DakoCytomation) followed by incubation with avidin-biotinylated horseradish peroxidase complex (ABC Elite, Vector Labs, Burlingame, CA, USA) for 1 hr. Peroxidase labelling was visualized by incubation of the sections in 0.01% 3,3’-diaminobenzidine (Sigma-Aldrich, St. Louis, MO, USA) containing 0.6% nickel ammonium sulphate, 50 mM imidazole and 0.001% H2O2 in 0.05 M Tris-HCl buffer, pH 7.6. When a dark purple colour developed, sections were washed, mounted on glass slides, and coverslipped with Entellan (E Merck, Darmstadt, Germany).
For double immunohistochemical staining for CR3/43 (HLA-DR, a marker for microglia; DakoCytomation) and amyloid-β (Aβ, clone 6F/3D; DakoCytomation) in ND and AD tissues, pre-treatment of tissue sections with 100% formic acid (Sigma-Aldrich) was performed for 15 min, prior to primary antibody incubation [11]. Sections were incubated for 24 hrs at 4°C with anti-HLA-DR polyclonal antibody (1:1000, DakoCytomation) followed by incubation with a biotinylated secondary antibody and ABC solution. After the DAB/nickel ammonium sulphate reaction, sections were washed in PBST and incubated in blocking solution (5% skim milk) for 1 hr. Sections were then incubated for 24 hrs at 4°C with the anti-Aβ monoclonal antibody (1:200; DakoCytomation), followed by incubation with a biotinylated secondary antibody and ABC solution. The developing reaction was done in DAB solution.
For double immunofluorescent staining of ND and AD brains [11], free-floating sections were incubated with fibrinogen (1:500; DakoCytomation) and other primary antibodies: β-amyloid (Aβ, 1:100; DakoCytomation), von Willebrand factor (vWF) (1:500; Santa Cruz Biotechnology, Santa Cruz, CA, USA), HLA-DR (1:500, DakoCytomation) or GFAP (1:1000, DakoCytomation). After a rinse in PBST, the sections were then incubated with appropriate fluorescence secondary antibodies (Molecular Probes, Eugene, OR, USA) for 2 hrs.
Control sections were prepared by omission of the primary antibody. To test the specificity of the primary antibodies (anti-fibrinogen and anti-IgG), pre-incubation of the primary antibody with the epitope specific peptide was performed prior to ND and AD tissue staining. The antibody-antigen complexes were incubated in phosphate buffered saline (PBS) solution overnight at 4°C and used for immunohistochemical staining.
Immunohistochemical analysis of human ND/AD tissue
The boundaries of entorhinal cortex were defined as previously described [12]. Quantitative immunohistochemical analysis of AD and ND brain sections used a Zeiss Axioplan-2 light microscope equipped with a DVC camera (Diagnostic Instruments, Sterling Heights, MI, USA) at 400× magnification under a constant predefined light setting. Five non-overlapping image fields in the entrohinal cortex were used with a central region of layers II and III chosen as the location of the initial field. Following quantification of immunoreactivity (ir) in this area, subsequent fields were randomly located with fixed distances between each of the fields to ensure no overlapping of any of the fields. The digitized images were then analysed using Northern Eclipse software (Empix Imaging, Mississauga, ON, Canada). The areas occupied by blood proteins fibrinogen and IgG were quantified by measuring the number of pixels per image above a predetermined level over background threshold as described previously [13]. This threshold was determined as the level to remove background ir in the absence of primary antibody. Area density was used as a measure of the overall proportion of pixels having a staining intensity greater than the corresponding threshold.
In vivo studies: animals and surgical procedures
All animal procedures were carried out according to protocols approved by the UBC Animal Care Ethics Committee, adhering to guidelines of the Canadian Council on Animal Care. Male Sprague-Dawley rats (250–300 g; Charles River Laboratories, St. Constant, PQ, Canada) were anaesthetized with intra-peritoneal (i.p.) injection of ketamine (72 mg/kg; Bimeda-MTC, Cambridge, ON, Canada) and xylazine (9 mg/kg; Bayer Inc., Etobicoke, ON, Canada) and placed in a stereotaxic apparatus (David Kopf Instruments, Tujunga, CA, Canada). A midline skin incision was made in the scalp to expose the skull and stereotaxic unilateral injection of amyloid-β (Aβ) peptide was performed as previously described [14, 15]. Injection coordinates for the hippocampus were as follows: −3.3 mm anteriorposterior, −1.6 mm mediallateral and −3.2 mm dorsoventral from bregma. Peptides (2 nmol in 1 μl) were slowly injected (0.2 (l/min.) into the superior blade of the dentate gyrus of hippocampus.
Preparation and administration of Aβ peptide and fibrinogen
Amyloid-β peptide (Aβ1-42)
Procedures followed published protocols [9, 15, 16]. Peptides (full length Aβ1-42 or reverse peptide Aβ42-1; California Peptide, Napa, CA, USA) were first dissolved in 35% acetonitrile (Sigma-Aldrich) and further diluted to 500 μM with incremental additions of PBS with vortexing. The peptide solution was subsequently incubated at 37°C for 18 hrs to promote fibrilization and aggregation and stored at −20°C.
Fibrinogen
In some experiments fibrinogen was injected, in addition to Aβ1-42, as an inflammatory stimulus. These studies used fibrinogen at a concentration of 4 mg/ml (dissolved in PBS; Sigma-Aldrich). This concentration of fibrinogen employed for stereotaxic in vivo injection was selected based on a previous analysis of normal fibrinogen concentration in the blood, which ranged from 1.5–4 mg/ml [17, 18]. The injection solution used in the study is a volume of 1 μl of PBS containing 2 nmol of Aβ1-42 or 4 μg of fibrinogen. In order to maintain the original injection volume (1 μl) for combined treatment of Aβ1-42 plus fibrinogen, we have prepared injection solutions by serial dilution of high stock solution of each compound.
Administration of pharmacological modulators
In this study we have employed two different pharmacological strategies to modulate inflammatory responses using the defibrinogenating compound ancrod and a monoclonal antibody for CD11b (anti-Mac-1) expressed in monocyte-macrophage cells. In this work, we refer specifically to microglia as the cells expressing CD11b.
Ancrod
This compound is derived from the venom of the Malayan pit viper. Ancrod cleaves the A-chains of fibrinogen resulting in generation of soluble fibrin degradation products that are removed from the circulation [19]. Ancrod was obtained from the National Institute for Biological Standards and Control (NIBSC, Potters Bar, UK) and dissolved in distilled water at a concentration of 55 I.U. Animals were injected i.p. with ancrod at 10 I.U. (ml/kg) 1 day before the Aβ1-42 injection, followed by twice daily injections for 7 days. This administration regimen for ancrod has previously been reported effective in defibrination [20, 21].
Anti-Mac-1 antibody
This neutralizing monoclonal antibody against rat adhesive receptor Mac-1 was obtained from BD Pharmingen (San Diego, CA, USA). It reacts with the α-chain of rat Mac-1 (CD11b/CD18, α[M]β2 integrin) and is reported to block the binding of fibrinogen to Mac-1 on microglia [22]. Anti-Mac-1 (10 μg) was injected into the intra-cerebroventricle at 30 min. prior to Aβ1-42 treatment. Rat IgG2b was used as the isotype control antibody for Aβ1-42-injected animals.
Immunohistochemistry procedures and analysis of rat brain
The procedures follow published protocols [13, 14]. Full details of immunohistochemical methods are found in Supplementary Methods.
Statistical Analysis
Values are expressed as means ± S.E.M.. Statistical significance was assessed by Student’s t-tests or ANOVA, followed by Newman–Keuls multiple comparison test (GraphPad Prism 3.0 Graph Pad Software, San Diego, CA). Significance was set at P < 0.05; specific P-values are included in the text.
Results
Patterns of fibrinogen staining in AD and ND brain sections
An impetus for this study was the finding of a marked enhancement in expression of fibrinogen ir in AD, compared to ND, brains. Representative staining for fibrinogen in entorhinal cortical regions is presented for AD/ND brain tissue in Fig. 1A with the left and middle panels showing respective, low (4×) and high (60×), magnifications. AD tissue was characterized by a diffuse pattern of fibrinogen ir, which was generally absent in ND tissue. In ND brain, fibrinogen ir appeared restricted to the lumens of blood vessels, whereas, in AD brain tissue, the glycoprotein showed intense staining both within and external to vessels. The inset in Fig. 1A (right lower panel) shows a typical pattern of fibrinogen ir in AD tissue with most staining localized to regions in proximity to blood vessels (arrow indicates one example). In this work, the specificity of fibrinogen antibody staining was demonstrated by the findings of negligible staining with either omission of the primary antibody or with pre-incubation of antibody with fibrinogen prior to tissue incubation with antibody (Fig. 1A, right upper panel). The quantification of fibrinogen ir is presented as area density in Fig. 1B with data collated from a total of eight AD and seven ND brain entorhinal cortical samples. Overall, fibrinogen positive ir areas were increased 4.5-fold in AD, compared to ND, tissue (P= 0.003). We also investigated fibrinogen staining in other areas of brain. Moderate fibrinogen ir was evident in occipital cortex with very low levels expressed in thalamus and cerebellum (data not shown).
Figure 1.
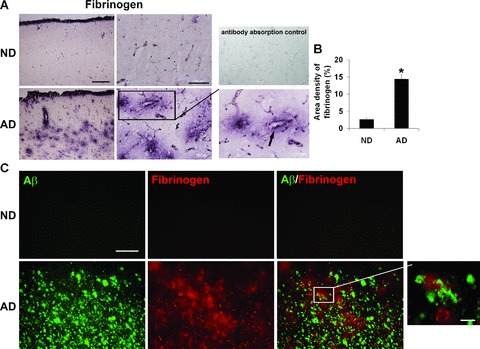
Fibrinogen immunostaining of tissues from the entorhinal cortex of non-demented (ND) and Alzheimer’s disease (AD) brain. (A) Low (left panels, scale bar = 500 μm) and high (right panels, scale bar = 100 μm) magnifications of fibrinogen immunoreactivity (ir). The lower right panel shows a detailed view of an AD section with arrow indicating fibrinogen ir in proximity to a blood vessel. The upper right panel is a representative image of an AD section stained with fibrinogen pre-absorbed with fibrinogen antibody. (B) Quantification of fibrinogen ir in ND (n= 7 cases) and AD (n= 8 cases) brain tissue; *indicates P < 0.05. (C) Representative double staining of fibrinogen with Aβ peptide deposits. Scale bar represents 200 μm. The magnified inset in the lower right panel (scale bar: 30 μm) shows a detailed view of an AD section indicating fibrinogen ir in proximity to peptide.
We also examined for fibrinogen association with deposits of Aβ. ND brain sections showed very low levels of Aβ (upper left panel, Fig. 1C) and no evidence for any double staining of fibrinogen with Aβ (upper right panel, Fig. 1C). However, AD brain tissue demonstrated considerable areas of both Aβ deposition and fibrinogen ir (lower left and middle panels, Fig. 1C). The patterns of fibrinogen ir indicated regions where the serum protein was in proximity to amyloid plaque deposits (see magnified inset in lower right panel) and regions with no evident co-localization of markers (lower right panel).
Patterns of vascular staining (vWF ir) and BBB leakiness (IgG permeability) in AD and ND brain sections
To provide a more detailed investigation of changes in vasculature, we also employed immunohistochemical staining for vWF, a glycoprotein produced by endothelial cells, in the same tissue sections used for fibrinogen expression. Additionally, integrity of BBB was examined by measuring permeability of IgG through the barrier. Representative double staining for vWF and fibrinogen in AD and ND sections are presented in Fig. 2A. The vWF staining in ND tissue was characterized by clearly delineated blood vessels (upper left panel) whereas in AD sections vWF ir showed a pattern of discontinuous and distorted vessel staining with accumulation of vWF particles outside the vessel (lower left panel). The appearance of small clusters of vWF has been interpreted as indicative of abnormalities and dysfunction of endothelium [23]. In ND brain, fibrinogen ir showed considerable areas of overlap with vWF (upper right panel) indicating well-defined blood vessels. AD tissue demonstrated diffuse regions of fibrinogen ir with considerable extents of staining located external to blood vessels and separate from vWF ir (lower right panel). The overall results point to a generalized pattern of vascular abnormalities in AD tissue including evidence for leakiness of BBB to endogenous blood proteins.
Figure 2.
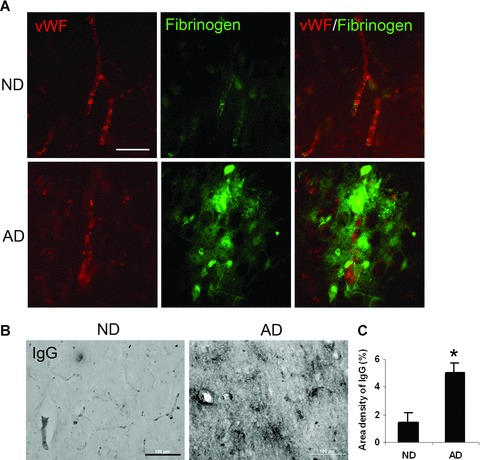
Representative fluorescent double staining for fibrinogen, von Willebrand factor (vWF) and immunoglobulin (IgG). (A) Double immunofluorescent staining for vWF (red, left panels) and fibrinogen (green, middle panels) in non-demented (ND) and Alzheimer’s disease (AD) sections; the merged image is presented in right panels. Scale bar shown is 60 μm. (B) IgG immunoreactivity (ir) for ND/AD tissue with low magnification. Scale bar = 100 μm. (C) Quantification of IgG ir in ND (n= 7 cases) and AD (n= 8 cases) sections. *Indicates P < 0.05.
The pattern of fibrinogen staining in parenchymal entorhinal cortical regions of AD brain tissue indicated leakiness and increased permeability of BBB. This point was further investigated by staining for IgG as a marker for integrity of the barrier [8]. A low magnification photomicrograph of entorhinal cortical IgG ir is presented for ND and AD sections (Fig. 2B). A considerably increased intensity of IgG staining was evident in AD, relative to ND, brain. The overall density of IgG, from analysis of eight AD and seven ND samples, is presented in Fig. 2C. AD tissue demonstrated a 2.4-fold increase in IgG ir compared with ND tissue (P= 0.003).
Association of fibrinogen expression with microgliosis and astrogliosis
We have recently demonstrated activated microglia are associated with vascular remodelling and leaky BBB in Aβ1-42 peptide-injected rodent brain [9]. We used double immunostaining to qualitatively examine association of fibrinogen ir with expression of HLA-DR+ microglia and GFAP+ astrocytes. For microglia, relatively low levels of fibrinogen and HLA-DR ir were evident in ND tissue (top panels, Fig. 3A) whereas AD tissue exhibited considerably elevated levels of both markers (lower panels, Fig. 3A). Areas of overlap between cellular and glycoprotein ir were evident in AD tissue (merged staining in lower right panel), which were absent from ND entorhinal cortical sections (upper right panel).
Figure 3.
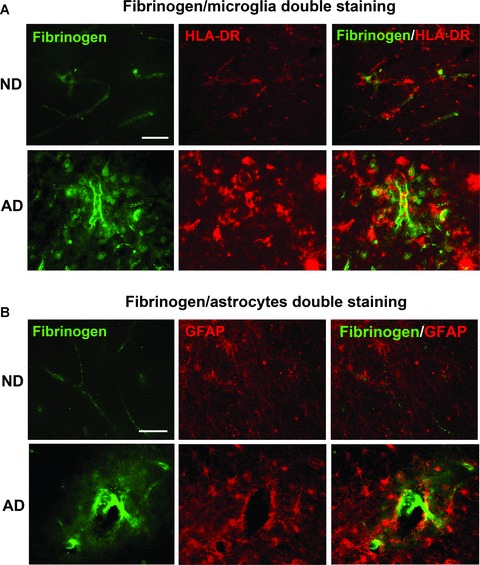
Representative double immunofluorescence staining of fibrinogen with microglia (HLA-DR marker) and astrocytes (GFAP marker) in the entorhinal cortex of non-demented (ND) and Alzheimer’s disease (AD) brain. (A) ND tissue (upper panels) showed low levels of fibrinogen immunoreactivity with microglia whereas AD tissue (lower panels) was characterized by extensive areas of diffuse fibrinogen deposition in association with microglia. Scale bar = 100 μm. (B) Representative staining for astrocytes in ND (upper panels) and AD (lower panels) sections. Double staining shows merged areas of markers. Scale bar = 100 μm.
A low level of astrocyte ir was observed in ND tissue sections (upper panels, Fig. 3B) with enhanced reactivity demonstrated in AD tissue (lower panels, Fig. 3B). In the latter case regions of overlap of fibrinogen with GFAP+ astrocytes was demonstrated. Overall, however, microglia exhibited a considerably larger extent of co-association with fibrinogen, compared with astrocytes, in AD brain tissue.
Patterns of staining for vessels, microglia and Aβ
We were interested in the question as to whether AD sections would show a composite of association between vessels, Aβ and microglia. Additionally, we examined if microglia in AD brain exhibited a morphology that was consistent with their activation. Representative high magnifications of ND and AD entorhinal cortical sections are presented in Fig. 4. The blood vessel (V) in ND brain shows only a low level of associated Aβ ir, with no evidentinteractions with HLA-DR+ microglia. Moreover the few microglia evident in the panel exhibit a ramified morphology with extensive processes (Fig. 4, upper panel). Ramified shapes have been suggested as indicative of quiescent microglia [24]. A very different profile was observed in AD sections where deposits of Aβ were localized in close apposition to vessels. Furthermore, microglia were characterized by a predominant ameboid morphology, distinguished by retracted processes and swollen cell bodies, indicating reactive cells (Fig. 4, lower panel). These patterns of immunostaining were consistent throughout entorhinal cortical regions.
Figure 4.
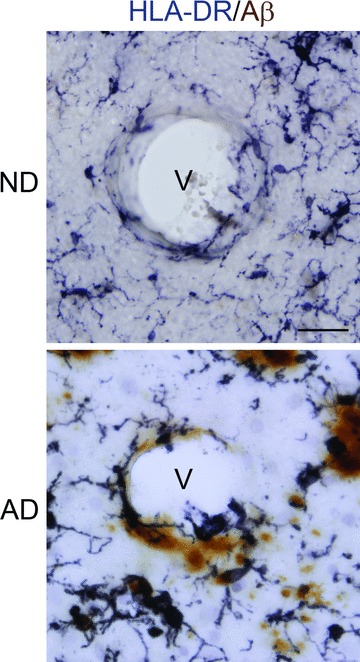
Representative double immunohistochemical staining for microglia (HLA-DR marker) and Aβ (6F/3D marker) in the entorhinal cortex of non-demented (ND) and Alzheimer’s disease (AD) tissue. Sections were incubated with HLA-DR and Aβ followed by visualization using DAB/nickel ammonium sulphate (anti-HLA-DR, dark purple colour) or DAB (anti-Aβ, brown colour). Staining shows blood vessels (v) with AD tissue demonstrating close association between Aβ, microglia and vessel. Scale bar represents 50 μm. Note the predominant ramified and ameboid morphologies of microglia in ND and AD tissue, respectively.
Effects of Aβ1-42 intra-hippocampal injection on microgliosis, astrogliosis and vasculature
The results described above indicate AD brain tissue is characterized by an inflammatory microenvironment including evidence for an increased vascular permeability to the blood protein fibrinogen and also infiltration of IgG, abnormalities in vessels indicated by patterns of vWF staining and the presence of activated and proliferating microglia. These findings prompted a detailed analysis of these factors and neuronal viability using an in vivo animal model of inflamed brain with hippocampal injection of Aβ1-42 peptide. A particular focus of these experiments was the investigation of effects of pharmacological modulations targeting reduction of levels of fibrinogen or inhibition of microglial activation.
We initially examined fibrinogen ir and microglial responses at time-points of 1, 3 and 7 days after Aβ1-42 injection. Two controls were employed in the experiments; injection of PBS or reverse peptide Aβ42-1 (for 7 days). Representative double staining for fibrinogen and OX-42+ microglia for the two controls are presented in Fig. 5A (upper two panels). A low level of ir was demonstrated for fibrinogen or microglia with either PBS or Aβ42-1 injection. Intra-hippocampal Aβ1-42 injection caused time-dependent (3–7 days after Aβ1-42 injection) increases in fibrinogen ir and numbers of microglia (lower three panels of Fig. 5A). At 7 days of Aβ1-42 injection, double staining showed considerable overlaps between areas of fibrinogen and microglial staining (lower right panel, Fig. 5A). Areas of fibrinogen ir appeared associated with Aβ as indicated in the double staining photomicrograph (Fig. 5B). Previous work from this laboratory has demonstrated co-localization of microglia with Aβ-immunoreactive plaques [25].
Figure 5.
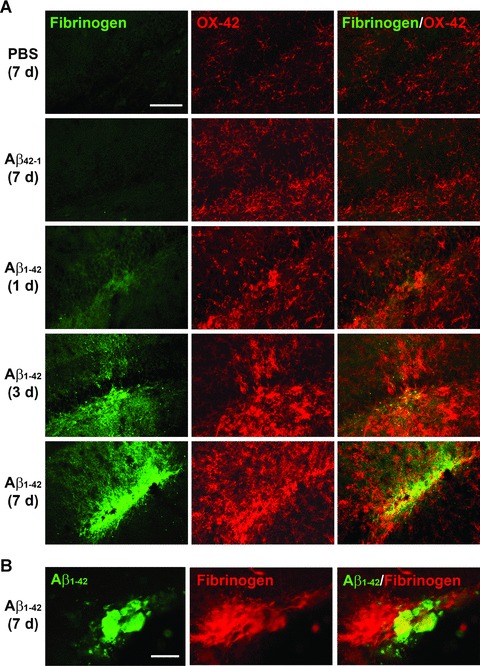
Fibrinogen and microglia (OX-42) double immunofluorescent staining in Aβ1-42-injected rat hippocampus. (A) In controls (7 days injection of PBS, upper panel or reverse peptide Aβ42-1, second panel) low levels of fibrinogen (left column) and numbers of microglia (middle column) are evident. The right column shows merged staining. Subsequent panels show progressive time-dependent changes in fibrinogen/OX-42/merged immunoreactivity for 1, 3 and 7-day durations of Aβ1-42 injection. Scale bar represents 200 μm. (B) Double staining for Aβ1-42 and fibrinogen (7 days after injection). Scale bar = 80 μm.
Astrocytic responses were also examined with fibrinogen at the single time-point of 7 days after Aβ1-42 injection. Double staining for controls (PBS or reverse peptide injection) indicated little or no association of fibrinogen ir with GFAP+ astrocytes (right panels, Fig. 6). Representative staining following Aβ1-42 injection (lower panels, Fig. 6) indicated astrocytic proliferative responses with little evidence for areas of overlap with fibrinogen staining (see insert in lower right panel, Fig. 6). Overall, regions of coincident fibrinogen staining with astrocytes were considerably less than observed with microglial–fibrinogen association.
Figure 6.
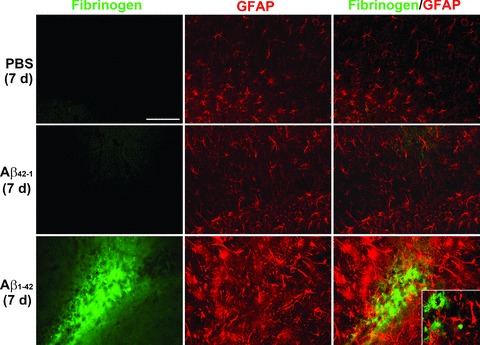
Fibrinogen and astrocyte (GFAP) double immunofluorescent staining in Aβ1-42-injected (7 days) hippocampus. GFAP immunoreactivity (ir; middle panels) was increased with Aβ1-42 compared to controls (PBS and Aβ42-1). Typical merged staining is shown in the right panels. Scale bar = 200 μm. The inset in the lower right panel presents a higher magnification showing negligible association of fibrinogen with GFAP ir astrocytes.
Effects of the defibrinogenating compound, ancrod on vascular integrity, gliosis and neuronal integrity in Aβ1-42-injected hippocampus
Ancrod and vascular integrity
The results presented above point to vascular remodelling allowing glycoprotein extravasation in AD tissue and as a component of inflammatory response in Aβ1-42-injected rat hippocampus. Evidence also suggested microgliosis was correlated with perturbations in vasculature including leakiness in BBB. We next investigated effects of pharmacological intervention on the components of inflammation. Two different approaches were employed in these experiments; use of the specific defibrinogenating compound, ancrod, to inhibit systemic circulating levels of the glycoprotein (see Methods) and anti-Mac-1 to inhibit microglial activation (see below).
Representative staining for fibrinogen and IgG, in the absence and presence of ancrod treatment with 7 days injection of Aβ1-42, are presented in Fig. 7A. Both vascular markers exhibited intense staining following Aβ1-42 injection with considerable extents of ir co-localized with vessels. Ancrod treatment reduced ir levels for both markers. Quantification for the effects of ancrod intervention on the vascular proteins are presented in Fig. 7B (overall results from n= 6 animals). Ancrod was highly effective in reduction of fibrinogen ir with a decrease of 80% compared with no drug treatment of Aβ1-42-injected hippocampus (P= 0.001). The corresponding reduction in IgG levels with ancrod was 52% also representing a significant decrease (P= 0.01).
Figure 7.
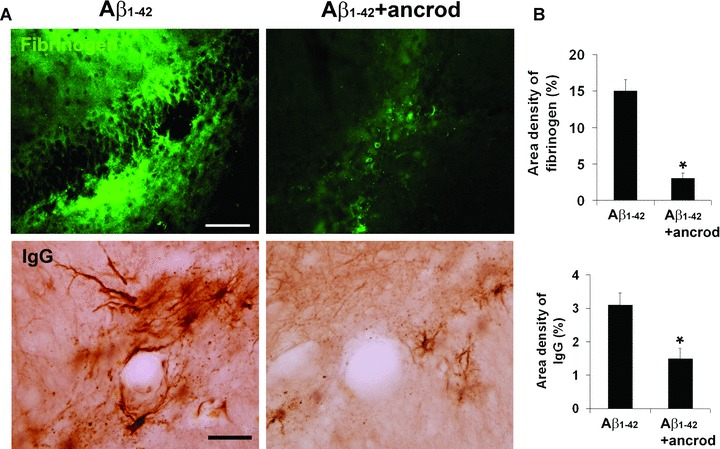
Effects of the defibrinogenating compound, ancrod, on parenchymal fibrinogen and IgG in Aβ1-42-injected hippocampus. (A) Representative immunoreactivity (ir) for fibrinogen (upper left panel) and IgG (lower left panel) in 7 days Aβ1-42-injected hippocampus. Effects of ancrod treatment with Aβ1-42 are presented in the right panels. The IgG staining pattern shows well-defined blood vessels. Scale bars are 100 μm (for fibrinogen) and 50 μm (for IgG). (B) Quantification of ancrod effects on fibrinogen ir (upper bar graph) and IgG ir (lower bar graph). Data are means ± S.E.M. from six animals. *Denotes significant difference for P < 0.05.
We also estimated the effects of ancrod treatment on plasma fibrinogen levels from ancrod and control (saline-injected) animals. Western blot assay (see Supplementary Methods) showed controls expressed intact fibrinogen with no evidence for any fibrin degradation products (data not shown). However, ancrod-treated animals demonstrated considerable evidence for fibrin degradation products with immunoblots showing fibrin fragments with only a low level of residual fibrinogen (data not shown). On the basis of band intensities, we would estimate that fibrinogen depletion in animals receiving ancrod was in excess of 65% of total levels. This estimate is consistent with previous results, with similar administrations of ancrod, which report reductions in plasma fibrinogen levels or fibrinogen-dependent processes of 60–70%[20, 21].
Ancrod effects on gliosis and neuronal integrity:
Typical patterns of microglial (Iba-1), astrocyte (GFAP) and neuronal (NeuN) staining are shown in Fig. 8A with PBS (left panels), Aβ1-42 alone (middle panels) and Aβ1-42 with ancrod treatment (right panels). Markers for microgliosis (Iba-1) and astrogliosis (GFAP) showed high intensity staining in Aβ1-42, but not PBS, injected brain. Ancrod treatment of Aβ1-42-injected animals reduced both gliotic markers. Quantification of data (n= 6 animals) showed microgliosis significantly diminished (by 44%) in the presence of ancrod (Fig. 8B) (P = 0.006). Although astrogliosis was lower in ancrod-injected animals (by 17%), this effect did not reach significance (P = 0.308).
Figure 8.
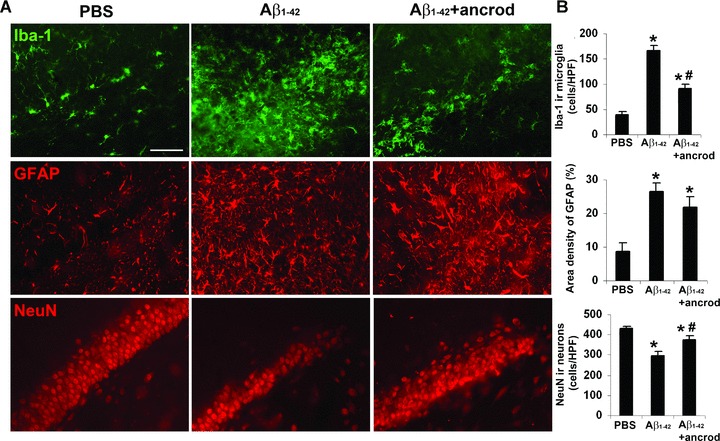
Effects of ancrod on gliosis and neuronal viability in Aβ1-42-injected hippocampus. (A) Representative microglial (Iba-1 marker, upper panels), astrocyte (GFAP marker, middle panels) and neuronal (NeuN marker, lower panels) staining at 7 days with PBS, Aβ1-42 and Aβ1-42 plus ancrod treatment. Scale bar represents 100 μm. (B) Quantification of ancrod effects on microgliosis (upper bar graph), astrogliosis (middle bar graph) and neuronal viability (lower bar graph). Results (Iba-1 and NeuN) are expressed as the number of cells per high-power (×400) field. Data are means ± S.E.M. from six animals. *Denotes significant difference for P < 0.05. #Denotes P < 0.05 between Aβ1-42 and Aβ1-42 plus ancrod.
Neuronal viability in the granule cell layer was determined by measuring NeuN ir for the three different animal groups. Representative data (lower panels, Fig 8A) show a considerable decrease in numbers of neurons in Aβ1-42-injected hippocampus compared to control PBS injection. Treatment of Aβ1-42-injected animals with ancrod was effective in increasing viability of neurons. Quantitative analysis (n= 6 animals) demonstrated the efficacy of ancrod treatment in providing a significant degree of neuroprotection with the numbers of dentate gyrus neurons increased by 26% compared with PBS-injected animals (Fig. 8B) (P= 0.043).
Effects of enhanced in vivo stimulation with Aβ1-42 combined with fibrinogen and inhibition of microglial activation using anti-Mac-1
The presence of fibrinogen ir in parenchymal regions for both AD brain and in vivo following injection of Aβ1-42 into the rat hippocampus, suggested the relevance in testing for the effects of combining Aβ1-42 plus fibrinogen as an enhanced stimulus for microgliosis, vascular remodelling and intactness of BBB and neuronal damage. We further hypothesized that inflammatory responses mediated by activated microglia could be involved in perturbations in vascular processes. Thus, we also investigated for effects of reducing microglial activation using anti-Mac-1 antibody [22], in the presence of Aβ1-42 plus fibrinogen stimulation.
Initial experiments examined the effects of combined stimulation (Aβ1-42+ fibrinogen for 7 days) and use of anti-Mac-1 on microgliosis (Iba-1 marker). Representative staining shows relatively low expression of Iba-1 in controls (PBS and reverse peptide, left panels of Fig. 9A). Microgliosis was increased with Aβ1-42 injection (upper middle panel) and further amplified in the presence of the combined stimuli (upper right panel). Anti-Mac-1 administration was effective in inhibiting Iba-1 ir for both Aβ1-42 (lower middle panel) and for Aβ1-42 plus fibrinogen (lower right panel), injections.
Figure 9.
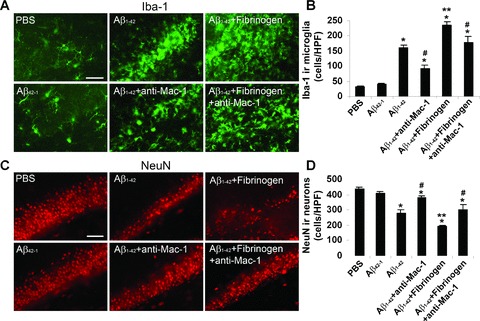
Microglial (Iba-1 marker) and neuronal (NeuN marker) staining following 7 days intra-hippocampal injection of Aβ1-42 and Aβ1-42 plus fibrinogen in the absence/presence of anti-Mac-1 treatment. (A) Controls (left panels) show that PBS and Aβ42-1 injections are associated with low numbers of microglia. Injection of Aβ1-42 (upper middle panel) or Aβ1-42 plus fibrinogen (upper right panel) progressively increases microgliosis. Effects of anti-Mac-1 on microgliosis with Aβ1-42 (lower middle panel) and Aβ1-42 plus fibrinogen (lower right panel) injections. Scale bar represents 100 μm. (B) Quantification (n= 6 animals) of Iba-1 immunoreactivity (ir) for the different treatments. Results are expressed as the number of Iba-1 ir cells per high-power (×400) field. Data are means ± S.E.M. from six animals. *P < 0.05 versus PBS; #P < 0.05 versus Aβ1-42 or Aβ1-42 plus fibrinogen; **P < 0.05 versus Aβ1-42. (C) Representative NeuN ir for controls (left panels), Aβ1-42 and Aβ1-42 plus fibrinogen (middle and right upper panels, respectively) and Aβ1-42 and Aβ1-42 plus fibrinogen with anti-Mac-1 treatment (middle and right lower panels, respectively). Scale bar represents 100 μm. (D) Quantification (n= 6 animals) of NeuN ir for the different treatments. Results are expressed as the number of NeuN ir cells per high-power field. Data are means ± S.E.M. from six animals. *P < 0.05 versus PBS; #P < 0.05 versus Aβ1- 42 or Aβ1-42 plus fibrinogen; **P < 0.05 versus Aβ1-42.
Quantification of data (n= 6 animals) is presented in Fig. 9B. Expression of Iba-1 was increased 45% with the combined stimulation compared with Aβ1-42 alone (P= 0.002) with anti-Mac-1 effective in reducing this expression (by 24%) (P= 0.034). Administration of anti-Mac-1 also significantly inhibited Iba-1 ir with Aβ1-42 injection alone (by 44%) (P= 0.005). Control injections with PBS or reverse peptide demonstrated regions of intact dentate gryrus neurons (left panels, Fig. 9C). Considerable neuronal loss accompanied Aβ1-42 injection, which was further exacerbated with inclusion of fibrinogen with Aβ1-42 (upper middle and right panels, Fig. 9C). Administration of anti-Mac-1 protected against neuronal loss for both combined stimuli (lower right panel, Fig. 9C) and Aβ1-42 alone (lower middle panel, Fig. 9C).
Quantification of data (Fig. 9D) showed Aβ1-42 plus fibrinogen injection increased neuronal loss by 45% compared to Aβ1-42 alone (P= 0.006). Treatment with anti-Mac-1 increased numbers of neurons by 35% with stimuli combined and by 26% with Aβ1-42 injection; these values represented significant degrees of neuroprotection with anti-Mac-1 (P= 0.004).
Intactness of BBB was also determined in these experiments using staining for IgG. Low levels of IgG activity were measured in PBS and reverse peptide controls (left panels of Fig. 10A) with Aβ1-42 plus fibrinogen exhibiting an enhanced IgG ir (upper right panel) compared with Aβ1-42 injection alone (upper middle panel). Anti-Mac-1 treatment reduced expression of IgG with both combined stimulation and with Aβ1-42 injected alone (right and middle lower panels).
Figure 10.

Effects of anti-Mac-1 on IgG staining in Aβ1-42 and Aβ1-42 plus fibrinogen-injected hippocampus. (A) Typical patterns of IgG immunoreactivity (ir) in controls (left panels) and with Aβ1-42 (upper middle panel) and Aβ1-42 plus fibrinogen (upper right panel). Effects of anti-Mac-1 are shown in lower middle and right panels. Scale bar represents 100 μm. (B) Quantification (n= 6 animals) of IgG ir for the different treatments. *P < 0.05 versus PBS; #P < 0.05 versus Aβ1-42 or Aβ1-42 plus fibrinogen; **P < 0.05 versus Aβ1-42.
Overall (n= 6 animals), the area density of IgG was increased by 98% with Aβ1-42 plus fibrinogen compared with Aβ1-42 alone (Fig. 10B) (P= 0.004). IgG expression was attenuated by 38% by anti-Mac-1 in the presence of the combined stimuli (P= 0.01). The corresponding value for anti-Mac-1 inhibition of IgG with Aβ1-42 injection alone was 65%. These reductions in IgG levels, induced by the inhibition of microglial activation, were significant (P= 0.006).
It can be noted that fibrinogen injection alone significantly increased markers Iba-1 and IgG and decreased NeuN. The following changes in markers, relative to PBS control, were measured after fibrinogen injection (values with Aβ1-42 stimulation are included in brackets): Iba-1 increased by 134% (395% with Aβ1-42) (P= 0.005), IgG increased by 31-fold (46-fold with Aβ1-42) (P= 0.008) and NeuN decreased by 16% (36% with Aβ1-42) (P= 0.03).
Discussion
Our results provide novel evidence for correlations between microglial ir, vascular remodelling, fibrinogen extravasation and neuronal viability in AD brain tissue and in Aβ1-42-injected hippocampus. Overall, the data support the premise that perturbations in vasculature and elevated parenchymal plasma glycoproteins are integral components of inflammatory reactivity in AD brain. The overall results suggest that intra-hippocampal injection of Aβ1-42 induces an inflammatory microenvironment in brain, which involves microglial–vascular interactions. Inhibition of microglial reactivity or vascular perturbations serve as independent strategies for neuroprotection.
Immunohistochemical analysis demonstrated AD, but not ND, brain tissue expressed areas of diffuse parenchymal fibrinogen ir indicative of a weakened BBB. Considerable extents of fibrinogen ir appeared in association with deposits of Aβ in AD brain indicating that Aβ deposits may serve as a locus for inflammatory reactivity. The patterns of extravascular fibrinogen also showed staining localized nearby vessels. Fibrinogen ir was also detected within vessels and appeared co-localized with vWF, an endothelial glycoprotein. However, the patterns of vWF staining were discontinuous and demonstrated irregularities in vessel walls which were absent in ND brain tissue. The patterns of vWF ir in AD sections closely resembled staining of vWF in cerebral cortex, which was attributed to a damaged vessel [26].
Elevated levels of fibrinogen have been reported in AD, relative to ND, brain [5, 6] and in transgenic AD mice [7] with increased plasma fibrinogen reported to increase the risk of AD and vascular dementia [27]. Abnormalities in BBB are predominant in entorhinal cortex, however, we also analysed other areas of AD brain tissue for fibrinogen ir. The results showed a moderate fibrinogen ir in occipital cortex with low values in thalamus and cerebellum (data not shown). Aβ1-42-injected rat brain also demonstrated considerable leakiness of BBB, which was absent with control injections (PBS or reverse peptide). Intense IgG ir was observed in parenchymal regions, with staining prominent near vessels, with Aβ1-42 injection (Fig. 2B).
Gliosis, both micro (Fig. 3A) and astro (Fig. 3B) were considerably higher in AD, compared with ND, brain tissue. Double staining analysis indicated areas of overlap of microgliosis with fibrinogen ir in AD brain (Fig. 3A). Interestingly, representative patterns of staining showed numerous examples where microglial–fibrinogen ir was in apparent association with blood vessels. Instances of co-localization of microglia with Aβ were also documented in AD tissue and representative double staining included examples where microglia-Aβ ir was in apposition to blood vessels (Fig 4). Although microglial ir with fibrinogen, Aβ or vessels was not quantified in AD brain tissue, such associations were relatively common. The predominant ameboid morphology of AD microglia suggested cells were in activated states [24, 28].
The findings from analysis of AD and ND tissue prompted detailed in vivo experiments using intra-hippocampal injection of Aβ1-42, alone or combined with fibrinogen and pharmacological modifications of fibrinogen levels and microglial activation. Injection of Aβ1-42 caused time-dependent (3–7 days) increases in expression of fibrinogen and microgliosis whereas controls (7 days injection of PBS or Aβ42-1) exhibited low levels of both (Fig. 5A). Double staining showed areas of association of fibrinogen with proliferating microglia, which increased with duration of Aβ1-42 injection. Merged staining also indicated evidence for fibrinogen expression coincident with Aβ1-42 ir (Fig. 5B). Overall, the in vivo patterns of gliosis were similar to those observed in AD brain tissue. The Aβ1-42-injected animal model has recently been shown to have particular utility in emphasizing inflammatory reactivity with relevance to cognitive deficits in AD brains [29, 30]. The double staining data presented in Fig. 3 indicate areas of co-localization between fibrinogen and HLA-DR+ microglia in AD, but not ND, brain tissue. Regions of co-localization were also evident for the plasma protein and OX-42, a marker for microglia, at 7 days after injection of Aβ1-42 (Fig. 5). These results suggest that patterns of immunostaining indicate fibrinogen binding to the Mac-1 receptor site in activated microglia. This interpretation would be consistent with effects of anti-Mac-1 antibody acting at the receptor site to attenuate microglial-mediated inflammatory responses (Fig. 9A). It is possible that some fibrinogen could also be internalized in cells a point requiring confocal microscopy for resolution.
Administration of the protease, ancrod, was effective in reducing plasma fibrinogen (‘Methods’) and significantly attenuated parenchymal fibrinogen and IgG ir consistent with a common effect of the compound to diminish leakiness of BBB to these proteins. Ancrod was also highly effective in reducing microgliosis, but not astrogliosis, in Aβ1-42-injected hippocampus (Fig. 8). Importantly, ancrod also demonstrated an efficacy for protection of hippocampal neurons. One possibility consistent with these data, is that reduced levels of fibrinogen diminished microglial inflammatory responses resulting in an increased viability of bystander neurons. A recent analysis of several mouse models of AD [7] has demonstrated fibrin deposition as a mediator of neurovascular pathology with increased levels of Aβ peptide and microgliosis implicated in vascular damage. Increased fibrin was associated with enhanced vascular, but not neuronal, damage with inhibition of plasma fibrinogen diminishing neurovascular pathology. It is noteworthy that our present study measured significant loss of granule cell neurons, with ancrod conferring neuroprotection, in Aβ1-42-injected rat brain. A possible explanation is that Aβ1-42-injection causes an enhanced inflammatory reactivity, and consequent neuronal damage, compared to transgenic animals.
It was hypothesized that if microglial responses to Aβ1-42 contributed to vascular remodelling and neuronal damage, then pharmacological inhibition of microglial activation could confer neuroprotection and also reduce vascular abnormalities. Furthermore, we postulated that injection of fibrinogen with Aβ1-42 could enhance inflammatory reactivity and neuronal damage relative to that measured with Aβ1-42 injection alone. Both premises were examined using anti-Mac-1 antibody, which binds to the same microglial CD11b/CD18 integrin as does fibrinogen [22, 31]. Microgliosis was markedly increased with Aβ1-42, compared with PBS, injection (Fig. 9B) and increased further with the combination of fibrinogen plus Aβ1-42. Anti-Mac-1 was effective in reducing microglial activity for both stimuli combined and for Aβ1-42-injection alone. Neuronal viability was significantly lower, relative to controls, with Aβ1-42 injection alone and further diminished with fibrinogen plus Aβ1-42 (Fig. 9D). In both cases anti-Mac-1 provided significant neuroprotection.
We considered that if microglial reactivity underlined changes in neuronal damage, then decreasing the severity of brain insult using Aβ1-42 alone (compared with Aβ1-42 plus fibrinogen) and inhibiting cell activation (with anti-Mac-1) could have effects to increase the integrity of BBB. In these experiments permeability of BBB was determined by extents of IgG infiltration. IgG ir was minimal in controls but markedly increased following Aβ1-42 injection and enhanced further in the presence of both stimuli (Fig. 10). Inclusion of anti-Mac-1 was highly effective in diminishing IgG for both combined stimuli and Aβ1-42 alone. These results are consistent with reduced microglial reactivity linked to an increased intactness of BBB.
Our data provide evidence that microglial responses to Aβ1-42 can lead to extensive vascular remodelling, which induces BBB leakage and subsequent plasma protein infiltration. Thus, microglia may not only initiate an inflammatory response to Aβ1-42 but also amplify and sustain inflammation in response to fibrinogen extravasation. In this case a chronic inflammatory environment could be maintained by reciprocal signalling between activated microglia and perturbed vasculature. It is noteworthy that our study showed considerable consistency between results obtained in vivo and from analysis of AD brain tissue. Clearly, injection of Aβ1-42 combined with fibrinogen, or for that matter Aβ1-42 alone, represents a simplified model of AD brain. Nevertheless, the model could have particular utility in emphasizing a localized inflammatory microenvironment in AD brain [32, 33]. This point is demonstrated by the utility of anti-Mac-1 to not only inhibit microglial reactivity but also to decrease BBB permeability and provide neuroprotection.
Overall, our results are consistent with deposits of Aβ1-42 initiating a localized microglial reactivity, which subsequently induces vascular perturbations manifest in a leaky BBB and extravasation of fibrinogen. Infiltration of fibrinogen into parenchymal regions acts to amplify and sustain chronic inflammatory microenvironments, which are proposed as toxic to bystander neurons. At present, our data provide correlations between inflammatory responses, intactness of BBB, infiltration of glycoproteins and neuronal viability. However, correlative relationships between these processes compose an integral framework for future investigation into the underlying mechanisms and factors, which link microglial inflammatory responses to perturbations in vasculature and neuronal damage and loss of cognitive function in AD brain.
Acknowledgments
We thank Dr. Pat McGeer and Kinsmen Laboratory at UBC for providing human brain sections. We also thank Dr. Ed Pryzdial and Kim Talbot, members of the Blood Research Unit at UBC, for carrying out the Western blot analysis for plasma fibrinogen. This work was supported by grants from the Pacific Alzheimer Research Foundation and Alzheimer’s Association USA (to J.G.M) and a Michael Smith Memorial Fellowship (to J.K.R).
References
- 1.Kalaria RN. The blood-brain barrier and cerebrovascular pathology in Alzheimer’s disease. Ann N Y Acad Sci. 1999;893:113–25. doi: 10.1111/j.1749-6632.1999.tb07821.x. [DOI] [PubMed] [Google Scholar]
- 2.Kalaria RN. Small vessel disease and Alzheimer’s dementia: pathological considerations. Cerebrovasc Dis. 2002;13:48–52. doi: 10.1159/000049150. [DOI] [PubMed] [Google Scholar]
- 3.De La Torre JC. Is Alzheimer’s disease a neurodegenerative or a vascular disorder? Data, dogma, and dialectics. Lancet Neurol. 2004;3:184–90. doi: 10.1016/S1474-4422(04)00683-0. [DOI] [PubMed] [Google Scholar]
- 4.Zipser BD, Johanson CE, Gonzalez L, et al. Microvascular injury and blood-brain barrier leakage in Alzheimer’s disease. Neurobiol Aging. 2007;28:977–86. doi: 10.1016/j.neurobiolaging.2006.05.016. [DOI] [PubMed] [Google Scholar]
- 5.Tomimoto H, Akiguchi I, Suenaga T, et al. Alterations of the blood-brain barrier and glial cells in white-matter lesions in cerebrovascular and Alzheimer’s disease patients. Stroke. 1996;27:2069–74. doi: 10.1161/01.str.27.11.2069. [DOI] [PubMed] [Google Scholar]
- 6.Fiala M, Liu QN, Sayre J, et al. Cyclooxygenase-2-positive macrophages infiltrate the Alzheimer’s disease brain and damage the blood-brain barrier. Eur J Clin Invest. 2002;32:360–71. doi: 10.1046/j.1365-2362.2002.00994.x. [DOI] [PubMed] [Google Scholar]
- 7.Paul J, Strickland S, Melchor JP. Fibrin deposition accelerates neurovascular damage and neuroinflammation in mouse models of Alzheimer’s disease. J Exp Med. 2007;204:1999–2008. doi: 10.1084/jem.20070304. [DOI] [PMC free article] [PubMed] [Google Scholar]
- 8.Ryu JK, McLarnon JG. Minocycline or iNOS inhibition block 3-nitrotyrosine increases and blood-brain barrier leakiness in amyloid beta-peptide-injected rat hippocampus. Exp Neurol. 2006;198:552–7. doi: 10.1016/j.expneurol.2005.12.016. [DOI] [PubMed] [Google Scholar]
- 9.Ryu JK, McLarnon JG. Thalidomide inhibition of perturbed vasculature and glial-derived tumor necrosis factor-_ in an animal model of inflamed Alzheimer’s disease brain. Neurobiol Dis. 2008;29:254–66. doi: 10.1016/j.nbd.2007.08.019. [DOI] [PubMed] [Google Scholar]
- 10.Arai T, Miklossy J, Klegeris A, et al. Thrombin and prothrombin are expressed by neurons and glial cells and accumulate in neurofibrillary tangles in Alzheimer disease brain. J Neuropathol Exp Neurol. 2006;65:19–25. doi: 10.1097/01.jnen.0000196133.74087.cb. [DOI] [PubMed] [Google Scholar]
- 11.Guo JP, Arai T, Miklossy J, et al. Abeta and tau form soluble complexes that may promote self aggregation of both into the insoluble forms observed in Alzheimer’s disease. Proc Natl Acad Sci USA. 2006;103:1953–8. doi: 10.1073/pnas.0509386103. [DOI] [PMC free article] [PubMed] [Google Scholar]
- 12.Insausti R, Tuñón T, Sobreviela T, et al. The human entorhinal cortex: a cytoarchitectonic analysis. J Comp Neurol. 1995;355:171–98. doi: 10.1002/cne.903550203. [DOI] [PubMed] [Google Scholar]
- 13.Ryu JK, Tran KC, McLarnon JG. Depletion of neutrophils reduces neuronal degeneration and inflammatory responses induced by quinolinic acid in vivo. Glia. 2007;55:439–51. doi: 10.1002/glia.20479. [DOI] [PubMed] [Google Scholar]
- 14.Ryu JK, Franciosi S, Sattayaprasert P, et al. Minocycline inhibits neuronal death and glial activation induced by beta-amyloid peptide in rat hippocampus. Glia. 2004;48:85–90. doi: 10.1002/glia.20051. [DOI] [PubMed] [Google Scholar]
- 15.Franciosi S, Ryu JK, Choi HB, et al. Broad-spectrum effects of 4-aminopyridine to modulate amyloid beta1-42-induced cell signaling and functional responses in human microglia. J Neurosci. 2006;26:11652–64. doi: 10.1523/JNEUROSCI.2490-06.2006. [DOI] [PMC free article] [PubMed] [Google Scholar]
- 16.Lue LF, Rydel R, Brigham EF, et al. Inflammatory repertoire of Alzheimer’s disease and nondemented elderly microglia in vitro. Glia. 2001;35:72–9. doi: 10.1002/glia.1072. [DOI] [PubMed] [Google Scholar]
- 17.Lip GY. Fibrinogen and cardiovascular disorders. QJM. 1995;88:155–65. [PubMed] [Google Scholar]
- 18.Adams RA, Passino M, Sachs BD, et al. Fibrin mechanisms and functions in nervous system pathology. Mol Interv. 2004;4:163–76. doi: 10.1124/mi.4.3.6. [DOI] [PubMed] [Google Scholar]
- 19.Dempfle CE, Argiriou S, Kucher K, et al. Analysis of fibrin formation and proteolysis during intravenous administration of ancrod. Blood. 2000;96:2793–802. [PubMed] [Google Scholar]
- 20.Chowdhury SM, Hubbell JA. Adhesion prevention with ancrod released via a tissue-adherent hydrogel. J Surg Res. 1996;61:58–64. doi: 10.1006/jsre.1996.0081. [DOI] [PubMed] [Google Scholar]
- 21.Sun H, Ringdahl U, Homeister JW, et al. Plasminogen is a critical host pathogenicity factor for group A streptococcal infection. Science. 2004;305:1283–6. doi: 10.1126/science.1101245. [DOI] [PubMed] [Google Scholar]
- 22.Flick MJ, Du X, Witte DP, et al. Leukocyte engagement of fibrin(ogen) via the integrin receptor alphaMbeta2/Mac-1 is critical for host inflammatory response in vivo. J Clin Invest. 2004;113:1596–606. doi: 10.1172/JCI20741. [DOI] [PMC free article] [PubMed] [Google Scholar]
- 23.Lip GY, Blann A. von Willebrand factor: a marker of endothelial dysfunction in vascular disorders. Cardiovasc Res. 1997;34:255–65. doi: 10.1016/s0008-6363(97)00039-4. [DOI] [PubMed] [Google Scholar]
- 24.Conde JR, Streit WJ. Microglia in the aging brain. J Neuropathol Exp Neurol. 2006;65:199–203. doi: 10.1097/01.jnen.0000202887.22082.63. [DOI] [PubMed] [Google Scholar]
- 25.McLarnon JG, Ryu JK, Walker DG, et al. Upregulated expression of purinergic P2X(7) receptor in Alzheimer disease and amyloid-beta peptide-treated microglia and in peptide-injected rat hippocampus. J Neuropathol Exp Neurol. 2006;65:1090–7. doi: 10.1097/01.jnen.0000240470.97295.d3. [DOI] [PubMed] [Google Scholar]
- 26.Cullen KM, Kócsi Z, Stone J. Microvascular pathology in the aging human brain: evidence that senile plaques are sites of microhaemorrhages. Neurobiol Aging. 2006;27:1786–96. doi: 10.1016/j.neurobiolaging.2005.10.016. [DOI] [PubMed] [Google Scholar]
- 27.Van Oijen M, Witteman JC, Hofman A, et al. Fibrinogen is associated with an increased risk of Alzheimer disease and vascular dementia. Stroke. 2005;36:2637–41. doi: 10.1161/01.STR.0000189721.31432.26. [DOI] [PubMed] [Google Scholar]
- 28.Walker DG, Lue LF, Beach TG. Gene expression profiling of amyloid beta peptide-stimulated human post-mortem brain microglia. Neurobiol Aging. 2001;22:957–66. doi: 10.1016/s0197-4580(01)00306-2. [DOI] [PubMed] [Google Scholar]
- 29.Sipos E, Kurunczi A, Kasza A, et al. Beta-amyloid pathology in the entorhinal cortex of rats induces memory deficits: implications for Alzheimer’s disease. Neuroscience. 2007;147:28–36. doi: 10.1016/j.neuroscience.2007.04.011. [DOI] [PubMed] [Google Scholar]
- 30.Liu RY, Gu R, Qi XL, et al. Decreased nicotinic receptors and cognitive deficit in rats intracerebroventricularly injected with beta-amyloid peptide(1-42) and fed a high-cholesterol diet. J Neurosci Res. 2008;86:183–93. doi: 10.1002/jnr.21463. [DOI] [PubMed] [Google Scholar]
- 31.Adams RA, Bauer J, Flick MJ, et al. The fibrin-derived gamma377-395 peptide inhibits microglia activation and suppresses relapsing paralysis in central nervous system autoimmune disease. J Exp Med. 2007;204:571–82. doi: 10.1084/jem.20061931. [DOI] [PMC free article] [PubMed] [Google Scholar]
- 32.Akiyama H, Barger S, Barnum S, et al. Inflammation and Alzheimer’s disease. Neurobiol Aging. 2000;21:383–421. doi: 10.1016/s0197-4580(00)00124-x. [DOI] [PMC free article] [PubMed] [Google Scholar]
- 33.Combs CK, Karlo JC, Kao SC, et al. Beta-amyloid stimulation of microglia and monocytes results in TNFalpha-dependent expression of inducible nitric oxide synthase and neuronal apoptosis. J Neurosci. 2001;21:1179–88. doi: 10.1523/JNEUROSCI.21-04-01179.2001. [DOI] [PMC free article] [PubMed] [Google Scholar]