

Abstract
One important goal in cardiology is to prevent necrotic cell death in the heart. Necrotic cell death attracts neutrophils and monocytes into the injured myocardium. The consequences are fibrosis, remodelling and cardiac failure. The renin-angiotensin system promotes the development of cardiac failure. Recently, alternative renin transcripts have been identified lacking the signal sequence for a cotranslational transport to the endoplasmatic reticulum. These transcripts encode for a cytosolic renin with unknown functions. The expression of this alternative transcript increases after myocardial infarction. We hypothesized that cytosolic renin plays a role in survival and death of cardiomyocytes. To test this hypothesis, we overexpressed secretory or cytosolic renin in H9c2 cardiomyblasts and determined the rate of proliferation, necrosis and apoptosis. Proliferation rate, as indicated by BrdU incorporation into DNA, was reduced by secretory and cytosolic renin (cells transfected with control vector: 0.33 ± 0.06; secretory renin: 0.12 ± 0.02; P < 0.05; cytosolic renin: 0.15 ± 0.03; P < 0.05). Necrosis was increased by secretory renin but decreased by cytosolic renin (LDH release after 10 days from cells transfected with control vector: 68.5 ± 14.9; secretory renin: 100.0 ± 0; cytosolic renin: 25.5 ± 5.3% of content, each P < 0.05). Mitochondrial apoptosis, as indicated by phosphatidylserin translocation to the outer membrane, was unaffected by secretory renin but increased by cytosolic renin (controls: 23.8 ± 3.9%; secretory renin: 22.1 ± 4.7%; cytoplasmatic renin: 41.2 ± 3.8%; P < 0.05). The data demonstrate that a cytosolic renin exists in cardiomyocytes, which in contradiction to secretory renin protects from necrosis but increases apoptosis. Non-secretory cytosolic renin can be considered as a new target for cardiac failure.
Keywords: cytosolic renin, exon1Arenin, mitochondrial apoptosis
Introduction
The renin-angiotensin system (RAS) system plays a central role in the regulation of blood pressure, water as well as electrolyte balance. The system also modulates inflammatory and growth processes, proliferation and apoptosis [1–6]. In the heart the RAS induces hypertrophy and fibrosis. Many effects of the RAS are detrimental, promoting the progression of cardiac failure. Accordingly, inhibitors of the system such as angiotensin-converting enzyme inhibitors reduce mortality rates in patients with congestive heart failure [7].
Renin is the key enzyme of the RAS. It cleaves angiotensin (ANG) I from its only known substrate, angiotensinogen. ANGI is then cleaved by angiotensin-converting enzyme to the effector peptide ANGII. Until recently, renin was exclusively known as a secretory glycoprotein predominantly expressed in the kidney [8]. Other tissues also express and secrete renin, albeit to a much lesser extend than the kidney [9].
The targeting of proteins to secretory pathways requires the cotranslational transport to the endoplasmatic reticulum (ER). The transport signal for renin is encoded by a sequence derived from exon 1 of the renin gene. We have isolated and characterized a second renin transcript in the rat, termed exon(1A-9)renin, which codes for a non-secretory cytosolic protein [10]. This transcript lacks the signal for the co-translational transport to the ER. Similar transcripts have been found in other species as well, including human beings [11, 12]. In human beings, one of the renin transcripts directly starts with exon 2 [12]. In rats, exon 2 of the exon(1A-9)renin transcript is preceded by a short sequence of about 80 base pairs derived from intron A [10]. This sequence is non-coding and therefore can only have regulatory functions. The exon(1A-9)renin transcript is translated into a truncated prorenin starting at the first in-frame ATG in exon 2. The resulting exon(2–9)renin protein lacks the prefragment of secretory renin as well as the first 10 amino acids of the conventional prorenin.
The functions of cytosolic renin are currently unknown. In the adrenal cortex renin proteins are found not only within secretory vesicles but also within mitochondria [13, 14]. Mitochondria play an important role in cell metabolism, steroid biosynthesis, growth and apoptosis. Mitochondrial renin must be derived from the exon(1A-9)renin transcript, because only this transcript renders a protein that is located in the cytosol and therefore available for mitochondrial import. In support of this view, we have demonstrated that cytosolic renin but not secretory prorenin or active renin is actively imported into isolated adrenal mitochondria in vitro[10]. We have also observed that transgenic rats overexpressing exclusively cytosolic renin exhibit increased aldosterone production plasma renin independently [15].
In the rat, most tissues express both renin transcripts, whereas the kidney expresses exclusively the exon(1–9)renin transcript and the heart expresses exclusively the exon(1A-9)renin transcript [16]. In the heart, exon(1A-9)renin transcript levels were markedly increased after myocardial infarction [16], indicating that cytosolic renin may play a role in post-ischaemic repair processes and cardiac failure.
The aims of the present study were to investigate the sorting and function of the rat equivalent of human exon(2–9)renin in the embryonic cardiac muscle-derived H9c2 cell line. Specifically, we tested the hypothesis that (1) the exon(1A-9)renin derived protein is sorted to the cytosol and mitochondria, (2) cytosolic renin is not secreted but remains within the cytoplasm and (3) cytosolic renin specifically modulates growth processes such as proliferation, necrosis and apoptosis.
Material and methods
Plasmids
Exon(1–9)renin and exon(2–9)renin cDNAs were derived as previously described [10] and subcloned into pIRES/Neo (BD Biosciences Clontech, Heidelberg, Germany).
Cell culture and transfection
H9c2 cells (a rat embryonal cardiac muscle-derived cell line from ATCC, CRL 1446) were grown at 37°C in a humidified atmosphere with 5% CO2 in Dulbecco’s modified Eagles medium (GIBCO BRL, Karlsruhe, Germany) containing 25 mM glucose supplemented with 10% heat-inactivated foetal calf serum, 100 U/ml penicillin and 100 μg/ml streptomycin. In the transfected cell lines [pIRES, exon(1–9)renin and exon(2–9)renin] a selection with 430 μg/ml G418 sulfate was performed to achieve a sustained overexpression of renin. All cell lines were passaged by trypsination and subcultured in 25 ml tissue culture flasks (Greiner Bio-One, Frickenhausen, Germany) for 7 days. Transfections of the cells were performed by the calcium-precipitate method [17].
Determination of renin transcripts
H9c2 cells were harvested and stored at –70°C. RNA was prepared using the Absolutely RNA RT-PCR Miniprep Kit (Stratagene, La Jolla, USA). cDNA was generated from each 5 μg of RNA as described [16]. RT-PCR was performed for renin transcripts using the reverse primer 5′-CGG TGA CCT CTC CAA AGG TCT G -3′ (position 722–743 of the renin cDNA) together with the following forward primers:
(1) for any renin transcripts: 5′– TGT TAC CTC CCC CGT GGT CCT C -3′ (position 421–442 of the renin cDNA), (2) specific for exon(1A-9)renin: 5′– CGA GGC AGG CTG GGT GCA CGT GGG – 3′ (position 3996–4019 of Intron A of the renin gene) and (3) specific for exon(1–9)renin: 5′– ACC AGA TGG GCG GGA GGA GGA TG – 3′ (position 211–233 of the renin cDNA). As an internal control, GAPDH was used as described [16].
Confocal immunofluorescence microscopy
H9c2 cells were double stained for renin and the mitochondrial marker ‘MitoTracker Red’ (Molecular Probes, Invitrogen Karlsruhe, Germany). Cells were cultured on glass slides for three days. They were incubated with 250 nM MitoTracker Red CMXRos solution in culture medium at 37°C, 5% CO2 for 30 min. After removing the excess of the mitochondrial specific dye by washing twice with PBS, cells were fixed for 10 min. in 2% PFA at room temperature and permeabilized with 0.3% Triton X-100 for 5 min. Incubation with primary anti-renin antibody [14, 18] at a dilution of 1:500 was performed for 60 min. at room temperature. The secondary chicken anti-rabbit antibody was coupled to Alexa Fluor 488 (1:500 diluted, Molecular Probes, Invitrogen). After washing with PBS, the slides were embedded in Mowiol and stored at 4°C. Images were acquired on the LSM Leica SP5 confocal microscope (Leica Microsystems, Wetzlar, Germany).
Subcellular fractionation
Subcellular fractionation was performed with 2–5 × 10⁶ cells at 4°C. Cells were trypsinated, washed twice with PBS and gently dispersed using a glass potter in 10 mM Tris/HCl buffer containing 0.25 mM sucrose and 2 mM EDTA. The resulting homogenate was subjected to differential centrifugation as described [14], with successive centrifugation speeds of 70 ×g, 200 ×g, 1000 ×g, 3000 ×g and 15,000 ×g. Pellets were gently resuspended in 100 μl of 0.1 M TES buffer containing 0.01 mM EDTA and 0.01% neomycin. Samples were then sonificated and centrifuged at 50,000 ×g to separate soluble contents of the organelles from their membranes. Fractions were stored at −70°C until further determinations of RAS components, protein concentrations and the mitochondrial marker malate dehydrogenase (MDH) [14].
Determination of prorenin and renin
Renin concentrations were determined by measuring the capability of the sample to generate ANGI from excess renin substrate as described [14, 19]. ANGI concentrations were determined using a radioimmunoassay (RIA) [20, 21] with the following modifications: high-binding RIA tubes (Greiner Bio-One, Frickenhausen, Germany) were coated with 300 μl of 1:60,000 diluted anti-ANGI antibodies for 20 hrs at 4°C. After washing with TRIS buffer, tubes were incubated with 400 μl blocking buffer containing 0.5% BSA for 2 hrs at room temperature to prevent unspecific binding. Tubes were washed again and stored at –20°C. For the RIA, 3 × 50 μl of the pre-treated samples and 200 μl I125-labelled ANGI with an activity of 5000 cpm (Amersham Biosciences, Freiburg, Germany) were added to the coated tubes und incubated for 20 hrs at room temperature. After 3 times washing with 1 ml washing buffer, the ANGI concentration was measured using a γ-counter (Berthold LD 2111, Bad Wildbach, Germay). The concentration was determined according to the standard curve.
Growth rates
For the determination of growth rates, 2 × 10⁵ living cells were seeded per flask and the increase in cell number was expressed as number of cells harvested per number of cells seeded.
Cell proliferation and protein content
The effect of renin overexpression on proliferation was studied using the Cell Proliferation ELISA (Roche Applied Science, Mannheim, Germany). Cells were seeded in 96-well plates at a concentration of 4 × 10³ living cells per well in a volume of 100 μl culture medium and cultured for 4 hrs at 37°C, 95%O2/5%CO2. Proliferating cells were detected by the incorporation of BrdU into their DNA according to the manufacturer’s protocol.
For determination of protein content, cells were trypsinated, washed twice with PBS and minced by sonification. After centrifugation at 104g for 2 min., protein concentration of the supernatant was determined using the Roti-Quant Protein Assay Kit (Carl Roth GmbH & Co, Karlsruhe, Germany) with bovine serum albumin as standard.
Cell viability and cell death measurements
For measurements of cell viability and cell death, 4 × 10³ living cells per well were seeded in 96-well plates in a volume of 100 μl culture medium and incubated for 1–10 days at 37°C, 95%O2/5%CO2. Cell viability was determined by the CellTiter-Glo® Luminescent Cell Viability Assay (Promega, Mannheim, Germany), which is based on the conversion of luciferin to oxiluciferin, pyrophosphate and light in the presence of ATP. The quantity of light was measured using a microplate luminometer (Berthold, Bad Wildbach, Germany).
Necrotic cell damage was measured by the Cytotoxicity Detection Kit (Roche Applied Science, Mannheim, Germany). This assay is based on the detection of lactate dehydrogenase (LDH) activity released from the cytosol of damaged cells into the medium. LDH activities within the cells were determined after exposure of each sample to 1% triton X-100 for 1 hr. LDH released was measured by collecting the cell-free medium of the cultured cells. Necrotic cell death was estimated by normalizing the amount of LDH released to the LDH content of the cells.
Immunofluorescence
For immunofluorescence, 1 × 10⁵ cells were grown in 24-well plates (Greiner Bio-One, Frickenhausen, Germany) in culture medium for a period of 1–10 days. Cells were stained with each 0.01% of the fluorescence dyes acridine orange and ethidium bromide. Acridine orange was used to stain viable cells green. Ethidium bromide is taken up only from damaged cells and thus indicates a disturbed membrane integrity by staining the cells red. Cells were visualized at a magnification of 60× using the fluorescence microscope Axiovert 200 (Zeiss, Jena, Germany) and the Nicon CoolPix 4500 camera. The figures were prepared with the Adobe Photoshop 4.0 program.
Flow cytometry analysis for determination of necrosis and apoptosis
For cytometric analysis, 1 × 10⁵ cells of the different cell lines were grown in 24-well plates (Greiner Bio-One, Frickenhausen, Germany) in 1.5 ml medium for 1, 3 and 7 days at 37°C, 95%O2/5%CO2. At the end of the experiment, floating cells were collected and added to the adherent cells detached from the culture dishes by trypsin/EDTA solution. After centrifugation, cell pellets were resuspended in phosphate-buffered saline. Apoptotic cells were identified by their morphological alteration, i.e. cell shrinkage, and by the expression of apoptosis-specific biochemical markers, such as phosphatidyl serine translocation, Fas receptor expression and caspase activation. The phosphatidylserin translocation from the inner to the outer membrane was measured with the Annexin V-FITC antibody (BD Pharmingen, Heidelberg, Germany). Cells were incubated with 5 μl Annexin V antibody in 100 μl Annexin binding buffer for 15 min. at room temperature in the dark. The unbound antibody was removed by washing the cells with 3 ml binding buffer. Fas receptor expression was measured with the rabbit polyclonal anti-Fas antibody (Stressgen Bioreagents, Hamburg, Germany). Cells were incubated with 1.5 μl anti-Fas antibody in 100 μl FACS buffer for 15 min. at 4°C. The unbound antibodies were removed by washing the cells with 3 ml FACS buffer. In a second incubation, the bound anti-Fas antibodies were labelled by 10 μl of 1:10 diluted anti-rabbit IgG-FITC antibodies for 15 min. at 4°C. Again, the unbound antibodies were washed out with 3 ml FACS buffer. Caspase-activity was determined by incubation cells with 5 μl of the 1:100 diluted CaspACE FITC-VAD-FMK dye (Promega, Mannheim, Germany) for 20 min. at 37°C. The excess of dye was removed by washing the cells with 3 ml FACS buffer.
After labelling with the different apoptosis markers, cells were further incubated with 500 ng/ml propidium iodide for 5 min. to discriminate between apoptotic and necrotic cells.
Data from 5000 cells were analysed on a FACS Calibur flow cytometer (Beckton-Dickinson, Heidelberg, Germany). Cell debris was excluded from the measurement by setting a specific gate for the living cells. Because of morphological changes such as cell shrinkage, a second gate was set to record the apoptotic cells. The data were analysed by Cell Quest software from BD Biosiences (Heidelberg, Germany).
Statistical analysis
Data are expressed as the mean ± S.E.M. For comparisons betweenmultiple groups, the significant differences were determined by one-way ANOVA followed by Bonferrony comparison test. Differences were considered statistically significant at P < 0.05.
Results
Expression of renin transcripts in H9c2 cardiomyoblasts
First, models to investigate the difference in sorting, secretion and function of prorenin and cytosolic renin were generated using H9c2 embryonic cardiomyoblasts. H9c2 cells endogenously express only the exon(1A-9)renin transcript at low level, but not the exon(1–9)renin transcript (Fig. 1). In control vector (pIRES)-transfected cells treated with the selection marker G418, renin expression was even lower than in non-transfected H9c2 cells. Exon(1–9)renin-transfected cells treated with G418 selectively overexpressed preprorenin transcripts. Like pIRES-transfected cells, they did not express exon(1A-9)renin. Exon(2–9)renin-transfected cells, treated with G418, overexpressed exon(2–9)renin lacking exon1 as well as exon1A.
Figure 1.
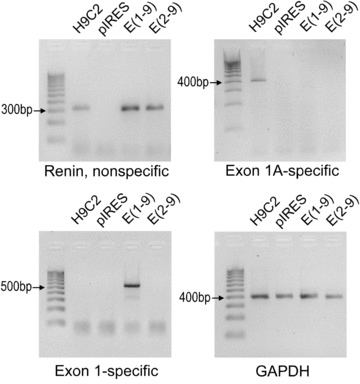
Renin transcript expression in H9c2 cells: Renin, non-specific: forward primer 3′ of exon 1 and exon1A; Renin, Exon1A specific: forward primer in exon1A; Renin, Exon1 specific: forward primer in exon1; GAPDH: Expression of housekeeping gene GAPDH. H9c2 cells were transfected with: control vector (pIRES); Exon(1–9)renin [Exon(1–9)]; Exon(2–9)renin [Exon(2–9)], respectively.
Intracellular location of renin encoded by exon(1A-9)renin transcripts in H9c2 cells
To confirm previous findings that exon(1A-9)renin transcripts encode for a protein that is located within mitochondria [10, 14] colocalization of renin immunoreactivity with a mitochondrial marker was studied by confocal microscopy. In H9c2 cells expressing exon(1A-9)renin but not secretory renin, renin immunoreactivity was found exclusively within mitochondria (Fig. 2).
Figure 2.
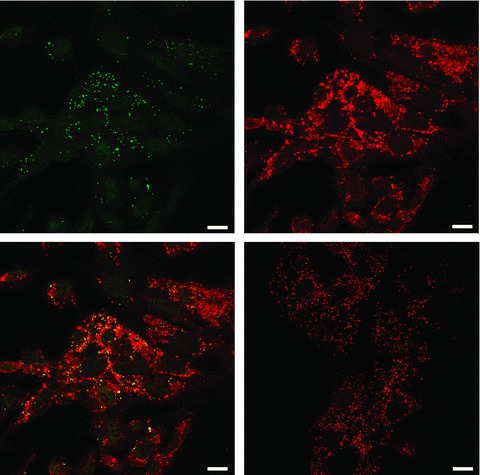
Immunhistochemical localization of renin in H9c2 cells. Renin was detected with anti-renin antibody (upper left panel, green) and mitochondria were stained with Mitotracker Red CMXRos (upper right panel, red). Merged confocal image demonstrates that renin localizes to the mitochondria (lower-left panel, colocalization: yellow). Negative control: Merged confocal image of non-specific rabbit antiserum and Mitotracker Red CMXRos (lower-right panel). Bar = 15 μm.
Differences in sorting and secretion between cytosolic and secretory renin
To investigate the effect of the transfection with vectors encoding for cytosolic and secretory renin, respectively, we compared renin concentrations in subcellular fractions of the different H9c2 cell lines. In non-transfected H9c2 cells, trypsin-activated inactive renin was enriched in the 200 ×g fraction (5.6 ± 2.0 ng AngI/hr/mg protein versus 0.8 ± 0.3 ng AngI/hr/mg protein of total extract; Fig. 3A). In this fraction, also the mitochondrial marker malate dehydrogenase (MDH) is enriched (15.4 ± 4.3-fold versus total extract). Since in addition renin was localized exclusively to mitochondria by confocal microscopy (Fig. 2), this fraction is recognized as the mitochondrial fraction.
Figure 3.
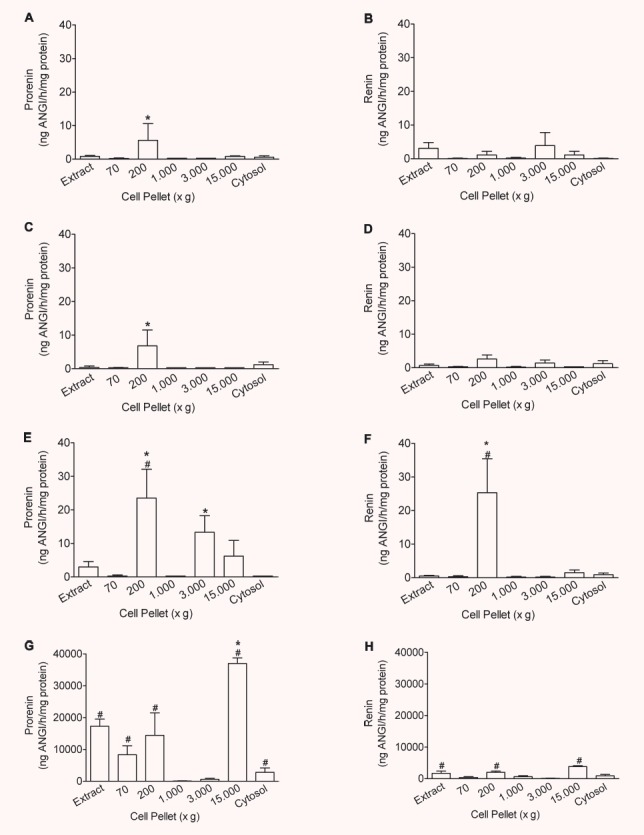
Intracellular distribution of prorenin and renin in transfected H9c2 cells: Enrichment of prorenin (A, C, E, G) and renin (B, D, F, H) in organelles of H9c2 (A, B), control vector- (pIRES) (C, D), exon(1–9)renin- (E, F) and exon(2–9)renin-transfected cells (G, H) compared to the whole cell extracts (Extract). Organelles were precipitated at 70, 200, 1000, 3000 and 15,000 ×g, respectively; n= 4 experiments. *: P < 0.05 versus extract; #: P < 0.05 versus control vector-transfected cells.
In pIRES-transfected H9c2 cells, inactive renin was as well enriched in the 200 ×g fraction (6.8 ± 3.7 ng AngI/hr/mg protein versus 0.4 ± 0.4 ng AngI/hr/mg protein of total extract; Fig. 3C). Only minute amounts of active renin were found in any of the fractions of H9c2 and pIRES transfected control cells (Fig. 3B and D).
In accordance with our hypothesis, overexpression of exon(2–9)renin led to an increase of inactive renin (H9c2-pIRES: 6.8 ± 3.7 ng AngI/hr/mg protein; H9c2-exon(2–9)renin: 23.5 ± 7.6; P < 0.05) and active renin concentrations (H9c2-pIRES: 2.6 ± 1.2 ng AngI/hr/mg protein; H9c2-exon(2–9)renin: 25.3 ± 8.1; P < 0.05) specifically in the mitochondrial (200 ×g) fractions (Fig. 3E and F). A second light mitochondrial fraction was identified (3000 ×g; 8.2 ± 3.2-fold increase of MDH activity versus total extract). In this fraction, also inactive renin but not active renin was enriched and increased in exon(2–9)renin-transfected cells when compared with pIRES control cells (13.3 ± 5.0 versus 0.3 ± 0.1 ng AngI/hr/mg protein).
In contrast, in exon(1–9)renin cells inactive renin was enriched in a light vesicular fraction only (15,000 ×g fraction: 36,989.5 ± 1725.6 versus 17,280.0 ± 1725.6 ng AngI/hr/mg protein in total extracts), where constitutive secretory vesicles are expected, but not in mitochondrial fractions (Fig. 3G and H).
We further hypothesized that secretory prorenin but not cytosolic renin is secreted. Supporting this hypothesis inactive renin concentrations and to a lesser degree also active renin concentrations were increased only in the medium of exon(1–9)renin cells, when compared with control cells, but not in exon(2–9)renin-transfected cells (inactive renin: H9c2-pIRES: 1.0 ± 0.8 ng AngI/hr/106 cells; H9c2-exon(1–9)renin: 5981.2 ± 931.7 ng AngI/hr/106 cells; H9c2-exon(2–9)renin: 1.0 ± 0.5 ng AngI/hr/106 cells; active renin: H9c2-pIRES: 1.1 ± 0.5 ng AngI/hr/106 cells; H9c2-exon(1–9)renin: 32.6 ± 5.4 ng AngI/hr/106 cells; H9c2-exon(2–9)renin: 1.6 ± 0.9 ng AngI/hr/106 cells; Fig. 4).
Figure 4.
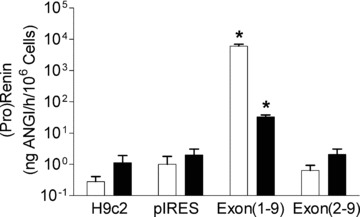
Effect of renin gene transfection into H9c2 cells on renin secretion: 24-hr release of prorenin (white bars) and active renin (black bars) is shown in non-transfected H9c2, control vector-transfected (pIRES), exon(1–9)renin-transfected or exon(2–9)renin-transfected cells. *P < 0.001 versus H9c2, pIRES and exon(2–9) cells, respectively; n= 8 experiments.
Functional differences between cytosolic renin and prorenin
After having established that cytosolic and secretory prorenin are differently sorted intracellularly, we next examined the effects of the different transcripts on cell functions.
Protein content, growth rate and proliferation
First, exon(1–9)renin and exon(2–9)renin-transfected cells exhibited marked differences in cell growth. The transfection with exon(1–9)renin but not with exon(2–9)renin induced cellular hypertrophy. Cellular protein content was also increased exclusively in exon(1–9)renin transfected cells (H9c2 cells: 2.16 ± 0.26 mg/106 cells, H9c2-pIRES cells: 2.21 ± 0.18 mg/106 cells; H9c2-exon(1–9)renin: 3.71 ± 0.54 mg/106 cells; P < 0.01; H9c2-exon(2–9)renin cells: 2.81 ± 0.40 mg/106 cells; n.s.; Fig. 5A). Furthermore, exon(1–9)renin-transfected cells were considerably larger than control-transfected or exon(2–9)renin-transfected cells, as visualized by using the fluorescent dyes acridine orange and ethidium bromide (5 B-E). Additionally, an increased number of apparently dead cells was found in both exon(1–9)- and exon(2–9)renin-transfected cells, as indicated by ethidium bromide staining.
Figure 5.
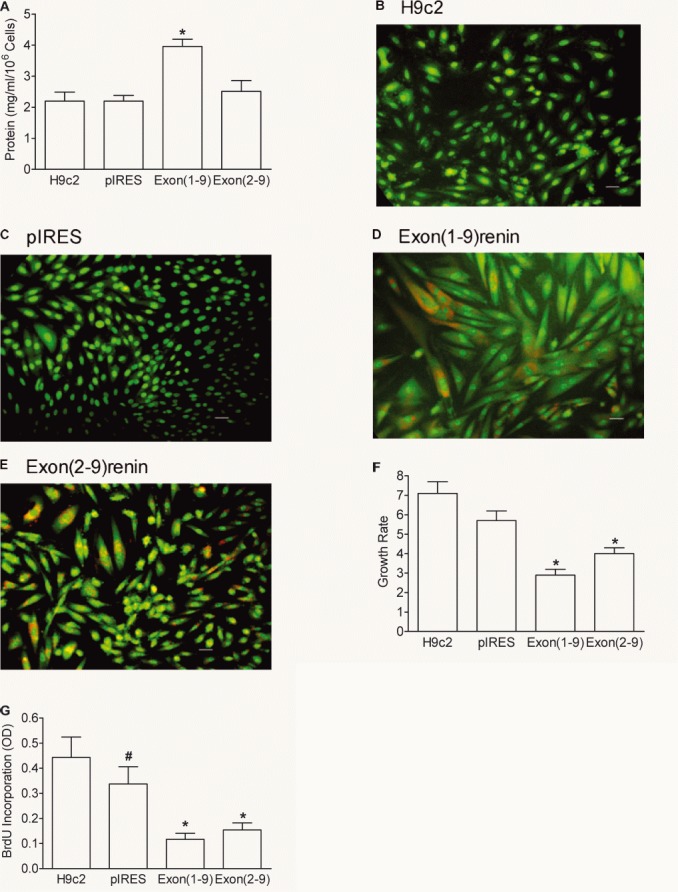
Protein content, fluorescence images, growth rate and proliferation of renin-transfected H9c2 cells. (A) Protein content; (B–E) fluorescence microscopy using the dyes acridine orange (green colour) and ethidium bromide (red colour) of renin-transfected H9c2 cells. Scale bar: 20 μm. Growth rate (F) was expressed as number of cells harvested after 7 days versus number of cells seeded. Proliferation rate (G) measured by the incorporation of BrdU into the DNA during a culture time of 1 day. n= 7 experiments. *P < 0.05 versus H9c2 and pIRES cells, #: P < 0.05 versus H9c2 cells.
Second, growth rates were reduced in both renin transfected cell lines (H9c2: 7.1 ± 0.6; H9c2-pIRES cells: 5.7 ± 0.5; n.s.; H9c2-exon(1–9)renin cells: 2.9 ± 0.3; P < 0.05; H9c2-exon(2–9)renin: 4.0 ± 0.3 mg/106 cells; P < 0.05; Fig. 5F). Also, proliferation rate was significantly decreased in the renin-transfected cell lines, when compared with pIRES-transfected control cells (H9c2-pIRES: 0.33 ± 0.06; H9c2-exon(1–9)renin: 0.12 ± 0.02; P < 0.05; H9c2-exon(2–9)renin: 0.15 ± 0.03; P < 0.05) (Fig. 5G).
Exon(1–9)renin increases the rate of necrosis in H9c2 cells
A major difference with functional consequences between exon(1–9)renin- and exon(2–9)renin-transfected cells was the fact that exon(1–9)renin-derived secretory prorenin markedly increased the rate of necrosis as indicated by an increased LDH release/content ratio. Cytosolic renin even protected cells from necrotic death, as indicated by a decreased LDH ratio (Fig. 6). These data point to a destructive effect of the exon(1–9)renin derived prorenin and a protective, anti-necrotic effect of the exon(2–9)renin derived cytosolic renin.
Figure 6.
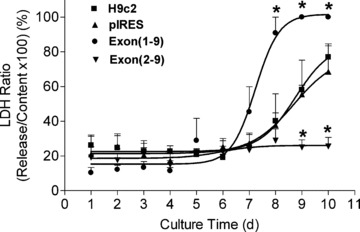
Necrosis in renin-transfected H9c2 cell lines. The LDH release was measured from the cell-free medium and the LDH content was measured from triton X-100 lysed cells. Necrosis was estimated by normalizing the amount of LDH released to the LDH content of the cells. Culture time: 1–10 days. n= 7 experiments. *: P < 0.05 versus control vector-transfected cells.
Exon(1A-9)renin increases the rate of apoptosis in H9c2 cells
Another major functional difference between cytosolic and secretory renin was that only exon(2–9)renin- but not exon(1–9)renin-transfected cells exhibited an increased rate of apoptosis (Fig. 7).
Figure 7.
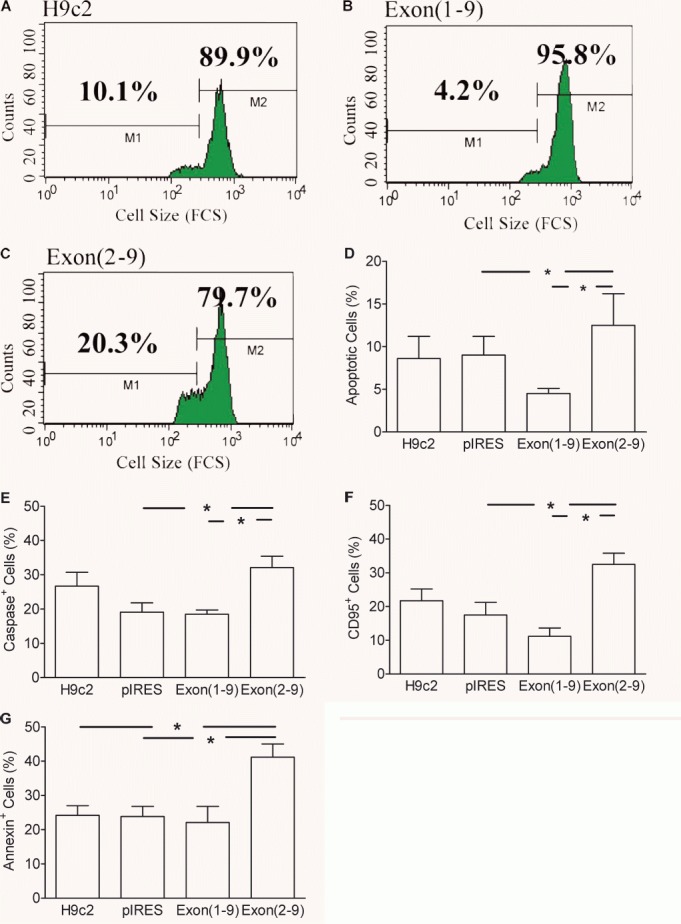
Apoptosis in (pro)renin transfected H9c2 cell lines. (A–D): Determination of apoptosis by means of cell shrinkage. A whole gate containing living and dead cells was evaluated using the FSC data as parameter of cell size. Culture time: 1 day. (A–C): One parameter histograms of the forward scatter (FSC) of one experiment. (D): mean ± S.E.M. of n= 7 experiments. (E): caspase activity; (F): expression of Fas antigen; (G): translocation of phosphatidyl serine to the outer membrane. (E–G): mean ± S.E.M. of n= 6 experiments. *: P < 0.05 versus pIRES control vector-transfected cells.
Compared to H9c2-, pIRES- and exon(1–9)renin-transfected cells, exon(2–9)renin-transfected cells showed a significantly enhanced number of shrunken cells, which represent apoptotic cells (H9c2: 8.6 ± 2.6%, H9c2-pIRES: 9.0 ± 2.2%, H9c2-exon(2–9)renin: 12.5 ± 3.7%; H9c2-exon(1–9)renin: 4.5 ± 0.6%) (P < 0.05; Fig. 7 A–D). The increase in number of apoptotic cells was confirmed by biochemical markers of apoptosis such as phosphatidylserin translocation, Fas receptor expression and caspase activation (Fig. 7E–G). After a culture time of 1 day, the number of caspase positive cells was significantly increased in exon(2–9)renin-transfected cells (32.1 ± 3.3%) compared to H9c2, pIRES and exon(1–9)-transfected cells (24.7 ± 4.0%, 19.1 ± 2.7% and 18.5 ± 1.2%; P < 0.05). Similarly, the number of exon(2–9)renin-transfected cells that expressed the Fas receptor was significantly enhanced (32.5 ± 3.3%) compared to control H9c2, pIRES- and exon(1–9)renin-transfected cells (21.7 ± 3.5%, 17.5 ± 3.7% and 11.2 ± 2.4%; P < 0.05).
In agreement with the hypothesis that the apoptosis induced by exon(2–9)renin is primary mitochondrial-derived, the translocation of phosphatidyl serine to the outer membrane in exon(2–9)renin-transfected cells was increased (41.2 ± 3.8%;P < 0.05; Fig. 7G) compared to the other cell lines (H9c2 cells: 24.2 ± 2.8%; H9c2-pIRES cells: 23.8 ± 3.9%; H9c2-exon(1–9)renin cells: 22.1 ± 4.7%).
Discussion
The present study demonstrates that (pro)renin is sorted to different intracellular compartments dependent on the presence or absence of exon 1. H9c2 cells overexpressing exon(1–9)renin transport the encoded prorenin to the low density (15,000 ×g) fraction and than release prorenin and active renin into the medium. In contrast, H9c2 cells overexpressing exon(2–9)renin transport the encoded cytosolic renin to high-density intracellular compartments and do not release renin into the medium. These compartments are represented most likely by the mitochondria. In support of this notion, the presence of renin within mitochondria has been demonstrated by means of immuncytochemistry/electron microscopy [14] and in the present study, the localization of renin protein in mitochondria was confirmed by confocal microscopy in H9c2 cells expressing exclusively exon(1A-9)renin. Furthermore, specifically exon(2–9)renin-derived cytosolic renin, but not secretory prorenin, is imported into mitochondria in vitro[10].
Cytosolic/mitochondrial renin encoded by exon(1A-9)renin transcripts represents a truncated prorenin [10]. It lacks 10 out of 43 amino acids of the profragment of secretory prorenin. Secretory prorenin exhibits less than 2% of the enzymatic activity of active renin. It is thus expected that cytosolic/mitochondrial renin has somewhat higher activity than intact prorenin but still less than active renin with the prefragment cleaved off. Our data indicate that the activity of cytosolic/mitochondrial renin is about 20–50% that of active renin. Similarly to secretory prorenin, it may well be subject to reversible activation as a result of conformational changes dependent on pH, temperature or membrane binding [22].
The question of how renin enters mitochondria is not completely answered yet. In previous studies, we identified a putative mitochondrial target sequence in the region between amino acid 1 and 15 of the cytosolic renin (i.e. amino acids 36–50 of the preprorenin). This region, although apparently indispensable for import, differs from mitochondrial targeting sequences in that it contains negatively charged amino acids, besides three arginine residues. Interestingly, targeting sequences of some typical nuclear-encoded mitochondrial proteins, such as CYP11B1 or Cyp11B2 also include such negatively charged residues (detailed discussion see: [10]). Besides this, internal targeting signals may still be taken into account.
The present study demonstrates that non-secretory cytosolic renin has its own unique functions, preventing necrotic and promoting apoptotic cell death. The apoptosis was likely primarily mitochondrial-derived. In support of this, translocation of phosphatidyl serine to the outer membrane was demonstrated, which is a consequence of cytochrom c release by mitochondria. Since the exon(2–9)renin-derived protein is specifically located within and imported into mitochondria [10, 14], these organelles are considered a direct target for cytosolic renin. The exact mechanism of how mitochondrial renin induces apoptosis, and which apoptotic cascades are activated needs further investigations.
Since in the rat expression of exon(1A-9)renin is selectively up-regulated after myocardial infarction [16], we hypothesized that the encoded cytosolic renin plays a role in the pathophysiology of ischaemia-related processes such as necrosis and apoptosis. The present study shows that this is indeed the case. Cytosolic renin reduces the rate of necrosis and increases the rate of apoptosis in vitro in cardiomyoblasts. Whereas necrotic cell death results in the release of subcellular membrane constituents that are capable of triggering the complement cascade [23] and this in turn recruits neutrophils and monocytes into the injured myocardium [24], apoptosis protects from these effects. The consequences of immigration and activation of leukocytes is the promotion of the unfavourable processes of fibrosis and cardiac remodelling (for review, see refs [25, 26]. This tendency to fibrosis and cardiac remodelling is prevented, if damaged cardiomyocytes undergo apoptosis instead of necrosis. In this respect, the induced apoptosis by cytosolic renin may be considered a protective mechanism under those conditions where it prevents necrotic cell death, as observed after myocardial infarction or post-ischaemic reperfusion injury.
To date, little information is available on the potential mechanisms of action of cytosolic renin. Like conventional renin, cytosolic renin may generate ANGI from angiotensinogen. Intracellular actions of ANGII have been proposed as early as 1971 by Robertson and Khairallah [27] and later by Re and others [28, 29]. In these studies, nuclear [27] or mitochondrial [27, 28] localizations of angiotensins was demonstrated. Furthermore, intra-cytoplasmatically applied ANGII-produced effects without the need to bind ANG receptors from the extracellular space [29–32]. In addition, overexpression of cytoplasmatic angiotensinogen in a hepatoma cell line expressing cytosolic but not secretory renin increased mitosis and proliferation rates [33]. In H9c2 cells, however, we observed a reduction of growth and proliferation rates in cells transfected with either secretory or cytoplasmatic renin. Since H9c2 cells express neither ACE nor angiotensinogen we assume that decreased growth and proliferation in H9c2 cells is an angiotensin-independent function of cytoplasmatic renin, whereas increased proliferation in hepatoma cells is a function of cytoplasmatic angiotensinogen.
There are other known angiotensin-independent targets for intracellular renin, which differ in their location to different cell compartments. A renin receptor has been found, which exerts angiotensin-dependent and -independent mechanisms [34, 35]. (Pro)renin binds to this receptor and activates signal transduction cascades (Erk1/2) independently of angiotensin generation [34]. Furthermore, secretory prorenin induces intracellular signalling in cardiomyocytes (p38 MAPK, HSP27 and TIMP1) again angiotensin-independently [36]. These factors are known to promote hypertrophy. The present study supports these findings because H9c2 cells, transfected with secretory prorenin, became hypertrophic. So far, however, we could not detect a prohypertrophic effect of cytosolic renin and do not yet have any evidence that cytosolic renin interacts with the (pro)renin receptor.
A possible intracellular target for exon(1A-9)renin-derived cytosolic renin is the renin binding protein [37]. Renin binding protein is identical to the enzyme N-acetyl-D-glucosamine 2-epimerase [38]. The epimerase inhibits renin activity [39] and is itself inhibited by renin [40]. Renin binding protein does not have access to secretory prorenin, because it is located within the cytosol, whereas secretory prorenin is not. On the other hand, renin-binding protein may well interact with exon(2–9)renin-derived cytosolic renin because both share the same location.
In summary, we show that a newly discovered cytosolic renin protects from necrosis by promoting apoptosis. This is in contrast to the known functions of secretory renin, which, through ANG generation, exerts pro-inflammatory and profibrotic effects on the heart [2, 41, 42]. ACE inhibitors reduce mortality rates in patients with congestive heart failure by preventing the effects of secretory renin [7], but cytosolic renin is unlikely a target for those inhibitors. Cytoplasmatic renin encoded by the alternative renin transcript from the same renin gene can therefore be considered as a new target in modulating the process of cardiac remodelling and hence cardiac failure.
Acknowledgments
We thank Brigitte Sturm for excellent technical assistance. We thank Dr. Tadashi Inagami for kindly providing the anti-renin antibody. This work was supported by grants from the Federal Ministry of Education and Research (BMBF/NBL3; FKZ: 01 ZZ 0304) and from the ‘Deutsche Stiftung für Herzforschung’ (F/07/04).
References
- 1.Stoll M, Steckelings UM, Paul M, et al. The angiotensin AT2-receptor mediates inhibition of cell proliferation in coronary endothelial cells. J Clin Invest. 1995;95:651–7. doi: 10.1172/JCI117710. [DOI] [PMC free article] [PubMed] [Google Scholar]
- 2.Sadoshima J. Cytokine actions of angiotensin II. Circ Res. 2000;86:1187–9. doi: 10.1161/01.res.86.12.1187. [DOI] [PubMed] [Google Scholar]
- 3.Pierzchalski P, Reiss K, Cheng W, et al. p53 induces myocyte apoptosis via the activation of the renin-angiotensin system. Exp Cell Res. 1997;234:57–65. doi: 10.1006/excr.1997.3604. [DOI] [PubMed] [Google Scholar]
- 4.Fortuno MA, Ravassa S, Etayo JC, et al. Overexpression of Bax protein and enhanced apoptosis in the left ventricle of spontaneously hypertensive rats: effects of AT1 blockade with losartan. Hypertension. 1998;32:280–6. doi: 10.1161/01.hyp.32.2.280. [DOI] [PubMed] [Google Scholar]
- 5.Cigola E, Kajstura J, Li B, et al. Angiotensin II activates programmed myocyte cell death in vitro. Exp Cell Res. 1997;231:363–71. doi: 10.1006/excr.1997.3477. [DOI] [PubMed] [Google Scholar]
- 6.Kajstura J, Cigola E, Malhotra A, et al. Angiotensin II induces apoptosis of adult ventricular myocytes in vitro. J Mol Cell Cardiol. 1997;29:859–70. doi: 10.1006/jmcc.1996.0333. [DOI] [PubMed] [Google Scholar]
- 7.Falkenhahn M, Gohlke P, Paul M, et al. The renin-angiotensin system in the heart and vascular wall: new therapeutic aspects. J Cardiovasc Pharmacol. 1994;24:S6–13. [PubMed] [Google Scholar]
- 8.Hackenthal E, Paul M, Ganten D, et al. Morphology, physiology and molecular biology of renin secretion. Physiol Rev. 1990;70:1067–116. doi: 10.1152/physrev.1990.70.4.1067. [DOI] [PubMed] [Google Scholar]
- 9.Bader M, Peters J, Baltatu O, et al. Tissue renin-angiotensin systems: new insights from experimental animal models in hypertension research. J Mol Med. 2001;79:76–102. doi: 10.1007/s001090100210. [DOI] [PubMed] [Google Scholar]
- 10.Clausmeyer S, Stürzebecher R, Peters J. An alternative transcript of the rat renin gene can result in a truncated prorenin that is transported into adrenal mitochondria. Circ Res. 1999;84:337–44. doi: 10.1161/01.res.84.3.337. [DOI] [PubMed] [Google Scholar]
- 11.Lee-Kirsch MA, Gaudet F, Cardoso MC, et al. Distinct renin isoforms generated by tissue-specific transcription initiation and alternative splicing. Circ Res. 1999;84:240–6. doi: 10.1161/01.res.84.2.240. [DOI] [PubMed] [Google Scholar]
- 12.Sinn PL, Sigmund CD. Identification of three human renin mRNA isoforms from alternative tissue-specific transcriptional initiation. Physiol Genomics. 2000;3:25–31. doi: 10.1152/physiolgenomics.2000.3.1.25. [DOI] [PubMed] [Google Scholar]
- 13.Rong P, Berka JL, Kelly DJ, et al. Renin processing and secretion in adrenal and retina of transgenic (mREN-2)27 rats. Kidney Int. 1994;46:1583–7. doi: 10.1038/ki.1994.453. [DOI] [PubMed] [Google Scholar]
- 14.Peters J, Kranzlin B, Schaeffer S, et al. Presence of renin within intramitochondrial dense bodies of the rat adrenal cortex. Am J Physiol. 1996;271:E439–50. doi: 10.1152/ajpendo.1996.271.3.E439. [DOI] [PubMed] [Google Scholar]
- 15.Peters J, Wanka H, Peters B, et al. A renin transcript lacking exon 1 encodes tor a non-secretory intracellular renin that increases aldosterone production in transgenic rats. J Cell Mol Med. 2008 doi: 10.1111/j.1582-4934.2008.00132.x. ; doi 10.1111/j.1582--4934.2007.00132.X. [DOI] [PMC free article] [PubMed] [Google Scholar]
- 16.Clausmeyer S, Reinecke A, Farrenkopf R, et al. Tissue-specific expression of a rat renin transcript lacking the coding sequence for the prefragment and its stimulation by myocardial infarction. Endocrinology. 2000;141:2963–70. doi: 10.1210/endo.141.8.7623. [DOI] [PubMed] [Google Scholar]
- 17.Wilson SP, Liu F, Wilson RE, et al. Optimization of calcium phosphate transfection for bovine chromaffin cells: relationship to calcium phosphate precipitate formation. Anal Biochem. 1995;226:212–20. doi: 10.1006/abio.1995.1216. [DOI] [PubMed] [Google Scholar]
- 18.Inagami T, Celia MR, Clemens DL, et al. Renin in rat and mouse brain: immunohistochemical identification and localization. Clin Sci. 1980;59:49s–51s. doi: 10.1042/cs059049s. [DOI] [PubMed] [Google Scholar]
- 19.Peters J, Münter K, Bader M, et al. Increased adrenal renin in transgenic hypertensive rats, TGR(mREN2)27, and its regulation by cAMP, angiotensin II, and calcium. J Clin Invest. 1993;91:742–7. doi: 10.1172/JCI116292. [DOI] [PMC free article] [PubMed] [Google Scholar]
- 20.Schelling P, Ganten U, Sponer G, et al. Components of the renin-angiotensin system in the cerebrospinal fluid of rats and dogs with special consideration of the origin and the fate of angiotensin II. Neuroendocrinology. 1980;31:297–308. doi: 10.1159/000123092. [DOI] [PubMed] [Google Scholar]
- 21.Hermann K, Ganten D, Unger T, et al. Measurement and characterization of angiotensin peptides in plasma. Clin Chem. 1988;34:1046–51. [PubMed] [Google Scholar]
- 22.Danser AHJ, Batenburg WW, Van Esch JHM, et al. Prorenin anno 2008. J Mol Med. 2008;86:655–8. doi: 10.1007/s00109-008-0318-2. [DOI] [PMC free article] [PubMed] [Google Scholar]
- 23.Pinckard RN, Olson MS, Giclas PC, et al. Consumption of classical complement components by heart subcellular membranes in vitro and in patients after acute myocardial infarction. J Clin Invest. 1975;56:740–50. doi: 10.1172/JCI108145. [DOI] [PMC free article] [PubMed] [Google Scholar]
- 24.Dreyer WJ, Michael LH, Nguyen T, et al. Kinetics of C5a release in cardiac lymph of dogs experiencing coronary artery ischemia-reperfusion injury. Circ Res. 1992;71:1518–24. doi: 10.1161/01.res.71.6.1518. [DOI] [PubMed] [Google Scholar]
- 25.Frangogiannis NG, Smith CW, Entman ML. The inflammatory response in myocardial infarction. Cardiovasc Res. 2002;53:31–47. doi: 10.1016/s0008-6363(01)00434-5. [DOI] [PubMed] [Google Scholar]
- 26.Swynghedauw B. Molecular mechanisms of myocardial remodeling. Physiol Rev. 1999;79:215–62. doi: 10.1152/physrev.1999.79.1.215. [DOI] [PubMed] [Google Scholar]
- 27.Robertson AL, Jr, Khairallah PA. Angiotensin II: rapid localization in nuclei of smooth and cardiac muscle. Science. 1971;172:1138–9. doi: 10.1126/science.172.3988.1138. [DOI] [PubMed] [Google Scholar]
- 28.Re RN. Intracellular renin and the nature of intracrine enzymes. Hypertension. 2003;42:117–22. doi: 10.1161/01.HYP.0000082495.93495.5B. [DOI] [PubMed] [Google Scholar]
- 29.De Mello WC, Danser AH. Angiotensin II and the heart: on the intracrine renin-angiotensin system. Hypertension. 2000;35:1183–8. doi: 10.1161/01.hyp.35.6.1183. [DOI] [PubMed] [Google Scholar]
- 30.De Mello W. Effect of extracellular and intracellular angiotensins on heart cell function; on the cardiac renin-angiotensin system. Regul Pept. 2003;114:87–90. doi: 10.1016/s0167-0115(03)00121-6. [DOI] [PubMed] [Google Scholar]
- 31.Haller H, Lindschau C, Quass P, et al. Intracellular actions of angiotensin II in vascular smooth muscle cells. J Am Soc Nephrol. 1999;(10 Suppl 11):S75–83. [PubMed] [Google Scholar]
- 32.Eto K, Ohya Y, Nakamura Y, et al. Intracellular angiotensin II stimulates voltage-operated Ca(2+) channels in arterial myocytes. Hypertension. 2002;39:474–8. doi: 10.1161/hy02t2.102961. [DOI] [PubMed] [Google Scholar]
- 33.Cook JL, Zhang Z, Re RN. In vitro evidence for an intracellular site of angiotensin action. Circ Res. 2001;89:1138–46. doi: 10.1161/hh2401.101270. [DOI] [PubMed] [Google Scholar]
- 34.Nguyen G, Delarue F, Burckle C, et al. Pivotal role of the renin/prorenin receptor in angiotensin II production and cellular responses to renin. J Clin Invest. 2002;109:1417–27. doi: 10.1172/JCI14276. [DOI] [PMC free article] [PubMed] [Google Scholar]
- 35.Schefe JH, Menk M, Reinemund J, et al. A novel signal transduction cascade involving direct physical interaction of the renin/prorenin receptor with the transcription factor promyelocytic zinc finger protein. Circ Res. 2006;99:1355–66. doi: 10.1161/01.RES.0000251700.00994.0d. [DOI] [PubMed] [Google Scholar]
- 36.Saris JJ, ‘t Hoen PA, Garrelds IM, et al. Prorenin induces intracellular signaling in cardiomyocytes independently of angiotensin II. Hypertension. 2006;48:564–71. doi: 10.1161/01.HYP.0000240064.19301.1b. [DOI] [PubMed] [Google Scholar]
- 37.Inoue H, Fukui K, Takahashi S, et al. Molecular cloning and sequence analysis of a cDNA encoding a porcine kidney renin-binding protein. J Biol Chem. 1990;265:6556–61. [PubMed] [Google Scholar]
- 38.Takahashi S, Takahashi K, Kaneko T, et al. Human renin-binding protein is the enzyme N-acetyl-D-glucosamine 2-epimerase. J Biochem. 1999;125:348–53. doi: 10.1093/oxfordjournals.jbchem.a022293. [DOI] [PubMed] [Google Scholar]
- 39.Schmitz C, Gotthardt M, Hinderlich S, et al. Normal blood pressure and plasma renin activity in mice lacking the renin-binding protein, a cellular renin inhibitor. J Biol Chem. 2000;275:15357–62. doi: 10.1074/jbc.275.20.15357. [DOI] [PubMed] [Google Scholar]
- 40.Takahashi S, Kumagai M, Shindo S, et al. Renin inhibits N-acetyl-D-glucosamine 2-epimerase (renin-binding protein) J Biochem. 2000;128:951–6. doi: 10.1093/oxfordjournals.jbchem.a022846. [DOI] [PubMed] [Google Scholar]
- 41.Mehta PK, Griendling KK. Angiotensin II cell signaling: physiological and pathological effects in the cardiovascular system. Am J Physiol Cell Physiol. 2007;292:C82–97. doi: 10.1152/ajpcell.00287.2006. [DOI] [PubMed] [Google Scholar]
- 42.Aoki H, Richmond M, Izumo S, et al. Specific role of the extracellular signal-regulated kinase pathway in angiotensin II-induced cardiac hypertrophy in vitro. Biochem J. 2000;347:275–84. [PMC free article] [PubMed] [Google Scholar]