INTRODUCTION
The chemical interaction of nitrite with hemoglobin (Hb) has attracted considerable, recent attention because of its potential significance in the mechanism of NO-related vasoactivity regulated by Hb, namely, hypoxic vasodilation. While the specific nature of nitrite's possible roles in this physiological process has been debated, the critical assessment of all of the available data, recently published by Allen et al.1, consolidates the view that the central signaling entity in hypoxic vasodilation is the S-nitroso-derivative of Hb, SNO-Hb, which has the unique capacity to effect a prompt NO-dependent modulation of blood flow in response to hemoglobin oxygen-saturation over physiological oxygen gradients, as RBCs pass from arterial to venous circulation. This assessment allows only an indirect, albeit potentially important, role for nitrite, which, for example, could, through slower biochemical pathways, raise stores of SNO-Hb.
Luchsinger et al.2, 3, had already in 2003, used the well known reaction of nitrite with deoxyHb to produce SNO-Hb, and thus to exemplify one of several routes of SNO-Hb synthesis that involve redox coupling of heme-iron and NO to support nitrosative chemistry. This work brought increased attention to the role of Fe(III)-containing, met-hemes, and their complexes with nitrogen oxides in such transformations4-6, and prompted renewed interest in the spectroscopic characterization of such complexes to facilitate analysis of this chemistry.
This interest was further piqued recently by the report of Basu et al.6 who measured the affinity of metHb for nitrite by an indirect EPR technique. Specifically, they monitored the progressive loss of the high-spin metHb EPR signal with successive additions of nitrite, and, assuming a simple equilibrium, determined a substantially higher affinity than previously determined by UV-VIS spectroscopy7. Intriguingly, they did not detect the EPR spectrum of the complex – an outcome that was surprising, inasmuch as EPR spectra have been previously reported both for low-spin nitrite complexes with metmyoglobin8, and for RBCs treated with nitrite9. We therefore undertook a re-investigation of the EPR spectroscopy of the nitrite:metHb complex. We were able to elicit the expected the nitrite:metHb spectrum, to demonstrate, through mass balance, that it was essentially the sole reaction product, and, by quantitative analysis of both the protein reactant and product, to determine an affinity in agreement with the previous studies that had been questioned by Basu et al. These findings were reported in a brief account published elsewhere10.
The observed EPR spectra exhibited a distinctive structure – a doubling of certain spectral features – that motivated further study. This motivation is enhanced by recent X-ray crystallographic studies that have demonstrated structural and linkage isomerization in nitrite coordination to metHb11, and thus raised the possibility that the spectral features might arise from structurally distinct coordination complexes. Here we report a comprehensive EPR study of the nitrite:metHb complex, in which we test different possible origins of the spectral structure. We also elaborate our previous, brief remarks10, on evidence for the weak affinity between metHb and the nitrite ligand.
MATERIALS AND METHODS
Hemoglobin
Hb was purified from human red blood cells obtained from Innovative Research (Novi, Michigan), following the procedure of Geraci et al.12 Hb was stored in aqueous solution at −80 °C for later usage. Prior to use, Hb was passed through Sephadex G-25 (GE Healthcare) chromatography gel, equilibrated with the appropriate buffer, either 100mM HEPES or PBS. All buffered solutions also contained 0.1M KCl and 0.1mM DTPA (diethylene triamine pentaacetic acid). In light of the well known pH artifacts associated with the freezing of sodium phosphate buffer13, we utilize HEPES buffer primarily, and, to illuminate buffer-effects, potassium PBS.
MetHb was prepared by treatment of Hb with potassium ferricyanide followed by G-25 filtration to remove excess oxidant. To prepare metHb:NO2−, aliquots of buffered (HEPES or PBS) aqueous solutions of NaNO2 were added to metHb solutions with nitrite at twenty-fold excess over heme.
Fe(II)NO/Fe(III)NO2−-Hb hybrids
To probe for subunit specificity of the nitrite:metHb complexes, reactions were carried out with metHb/nitrosyl Hb hybrids, which were prepared in two distinct ways. First, to obtain Hb with preferentially oxidized β-subunits (and nitrosylated α-subunits), Hb was initially incubated with sodium nitrite and sodium dithionite under anaerobic conditions to generate Hb(NO)4; the solution was then subjected to gel filtration to remove any excess reagents. The resulting Hb(NO)4 solution was then exposed to room air for approximately 7 hours at 20°C. This procedures results in preferential oxidation of β-Fe(II)NO to Fe(III)2. The concentration of metHb present was assayed by UV-VIS spectroscopy, while subunit specificity was determined by EPR spectroscopy2. Concentrated NaNO2 solution was then added to form the α-Fe(II)NO/β-Fe(III)NO2− hybrid complexes.
Complementary Hb hybrids, with oxidized α-subunits and nitrosylated β-subunits, were prepared by reductive nitrosylation of metHb with a [NO]:[heme] ratio of 0.9 to 1 using DEANO (diethyamine NONOate (Cayman Chemical)) as the NO donor2. Reaction progress was monitored using UV-VIS spectroscopy. Following reductive nitrosylation, concentrated NaNO2 was added in molar excess over the remaining Fe(III), to furnish α-Fe(III)NO2−/β-Fe(II)NO hybrid complexes.
SNO-Hbs
SNO-Hb was prepared by reacting oxygenated Hb in pH 9.2 borate buffer with acidified nitrite. Following incubation, the SNO-Hb solution was passed through a G-25 column equilibrated with pH 7.4 HEPES buffer. SNO-Hb yield was determined by Greiss and Saville assays, as describe previously14. SNO-Hb was then oxidized with potassium ferricyanide with subsequent G-25 filtration. Concentrated NaNO2 was added in molar excess, as determined by UV-VIS spectroscopy to furnish SNO-metHb:nitrite.
D2O solutions
To prepare solution of metHb:NO2− in D2O, hemoglobin was first treated with potassium ferrricyanide followed by G-25 filtration, then concentrated using a Microcon 30 centrifugal filter (Millipore, Billerica, MA). The protein was reconstituted in 1:10 (vol:vol) HEPES buffered deuterium oxide (Cambridge Isotope Laboratories Inc, Cambridge, MA). pD of the solution set to 7.4, as determined with a glass electrode using pH+0.415.
EPR spectroscopy
X-Band EPR data were collected on a Varian E-109 spectrometer modified with a National Instruments computer interface for data collection and field control. For spectra obtained at liquid helium temperatures, a Heli-Tran LTD-3-110 (Air Products and Chemicals Inc, Allentown, PA) liquid helium transfer system and dewar was employed. For X-Band spectra obtained at 100K and above, sample cooling was provided by a flow thru set-up utilizing a constant stream of liquid nitrogen cooled gas. S-Band EPR data collection was conducted on a Bruker EMX spectrometer with an ER061ST microwave bridge, and a flexline cavity assembly. Liquid helium temperatures were achieved through the use of an Oxford Instruments CF-905 cryostat. Detailed simulation of experimental EPR data was conducted using the program EasySpin16. Observed alterations in the quality of the fit, with changes in parameter values were used as a guide to the precision of the determination of the values. Simulated spectra were then used as basis spectra for least-squares decomposition of multi-component EPR spectra, using a fitting program similar to that described by us previously2.
UV-VIS spectroscopy
UV-VIS spectra were collected using a Cary 300 spectrometer. Least squares fitting of spectra2 was used to determine the concentration of UV-VIS detectable of heme species.
RESULTS
Doublet Structure
Low-temperature EPR spectra of our neutral pH, neat metHb preparations consist, generally, of spectral contributions from three distinct chemical species: 1) high spin aquo metHb; 2) low spin hydroxy metHb; and 3) an additional low spin species that has been proposed to result from the coordination of a nitrogen atom of the distal histidine as the sixth heme iron ligand17. Detailed simulations of our experimental metHb spectra (not shown) agree well with the results of Svistunenko and co-workers, both in regard to the spectral properties and the relative amounts of each of the three species17.
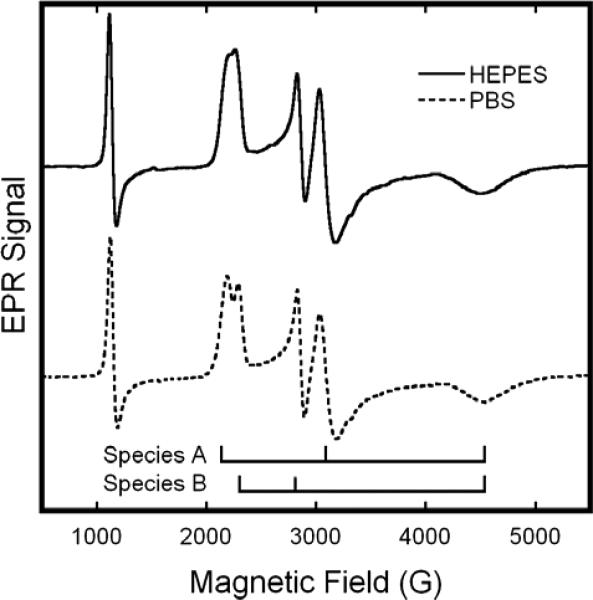
Addition of excess sodium nitrite to neutral pH metHb solutions results in the substantial replacement of the metHb EPR signals with new features in the region associated with low-spin Fe(III) hemichromes. In the X-Band EPR spectra shown in Fig. 1, these new features entail a broad, high-field feature at ~4500 G; a closely spaced doublet, low-field feature at ~2200 G; and a well resolved doublet, intermediate field feature at ~3000 G. The sharp feature at ~1100 G is from remaining aquo-metHb. As evidenced in Fig.1, the resolution of the low-field doublet exhibits some sensitivity to the nature of the buffer. It is better resolved, with sharper component lines and minor changes in line position in PBS (Fig. 1, bottom). Nevertheless the fundamental features are the same; intrinsic buffer effects represent a modest perturbation, in contrast to suggestions made by others18.
Figure 1.
X-Band EPR spectra of solutions of metHb:NO2− in HEPES (—) or PBS (− − −) buffers at 20 K. The samples included metHb at 0.5M and twenty-fold molar excess (per heme) of NaNO2; the buffer concentration was 0.1M and the pH 7.4. EPR spectra were obtained with the following spectrometer parameter values: 0.5 s time constant, 5 G modulation amplitude, 16.67 G/s sweep rate, 5 mW microwave power, and 9.24 GHz microwave frequency.
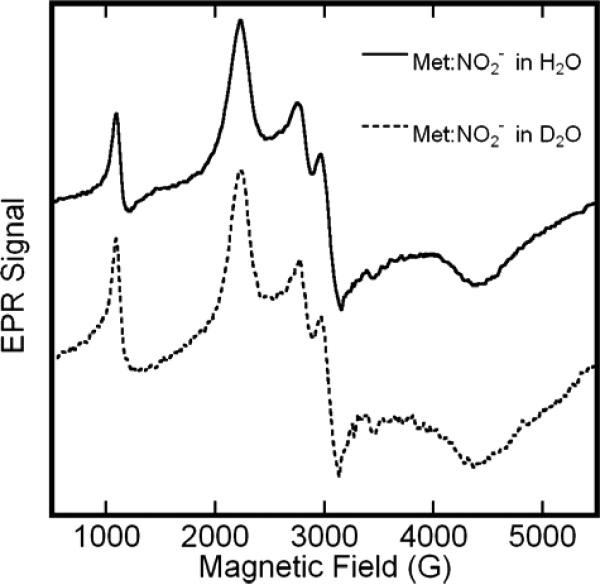
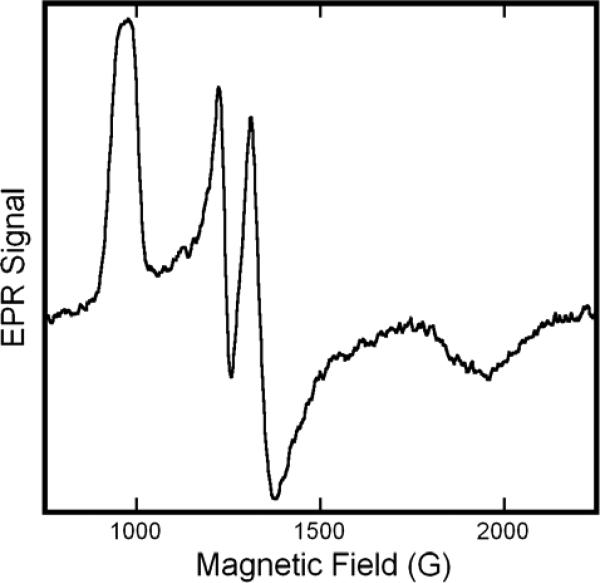
We considered two alternative hypotheses for the origin of this structure: 1) the splittings reflect hyperfine structure; or 2) they reflect the overlap of the unstructured spectra of two low-spin hemichromes with slight difference in their high and intermediate g-values. To distinguish between these possibilities we undertook two experiments. First, we obtained the EPR spectrum of isotopically labeled metHb:NO2− samples. Given the size of the splittings, the coupling would most likely involve an H-atom whose 1s orbital has substantial overlap with iron t2g orbitals— perhaps a proton associated with the nitrite ligand. To test this possibility we obtained the EPR spectrum of the metHb:nitrite complex in HEPES buffer in D2O (Fig. 2). The spectra are essentially identical to ones obtained in H2O; in particular, the splitting of the two central features is unchanged. (Analogous results were obtained in complexes formed with 15N-nitrite (data not shown)). To validate this result, we compared EPR spectra obtained at X-Band, with spectra obtained at S-Band (3.9 GHz). The S-Band spectrum (Fig. 3) exhibits splittings in both the low-field and intermediate-field features that scale in proportion to the reduction in microwave frequency from X-Band to S-Band. If the observed splitting had originated from a hyperfine interaction, then the splitting would be expected to remain constant over this microwave frequency range. Collectively, the multi-frequency EPR and the isotopic labeling experiments indicate that the EPR spectrum of metHb:NO2 is caused by the presence of two distinct species. Accordingly, returning to the upper spectrum of Fig. 1, we determine the metHb:nitrite EPR spectra to have principal g-values of: (3.006, 2.887), (2.299, 2.129), and 1.45 (HEPES, 20K). The assignment of the pairs of values in parentheses to unique species is not obvious from the spectra, but can be made on the basis of observations of the differential effects of pH on the size of the components of each doublet (vide infra).
Figure 2.
EPR spectra of solutions of metHb:NO2− in H2O and D2O in boiling nitrogen (76K). The protein concentration was 0.5M in the H2O sample and 0.4M in the D2O sample. Both samples contained a twenty-fold molar excess (per heme) of NaNO2 m, and buffered at an effective pH of 7.4 in HEPES. Spectral amplitudes were corrected for difference in concentration. Both EPR spectra were recorded at 9.12 GHz with a 16.67 G/s sweep rate, a 0.5 s time constant, 5 G modulation amplitude, and 10 mW of microwave power.
Figure 3.
S-Band EPR spectrum of solutions of metHb:NO2−. The sample was prepared in pH 7.4 HEPES buffer with a protein concentration of 0.75M and a twenty-fold molar excess (per heme) of NaNO2. The spectrum was obtained with the sample at ~40K , and at a frequency of 3.98 GHz , with a a sweep rate of 17.88 G/s , a time constant of 0.328 s, 5 G modulation amplitude, and 9.7 mW microwave power.
pH Dependence
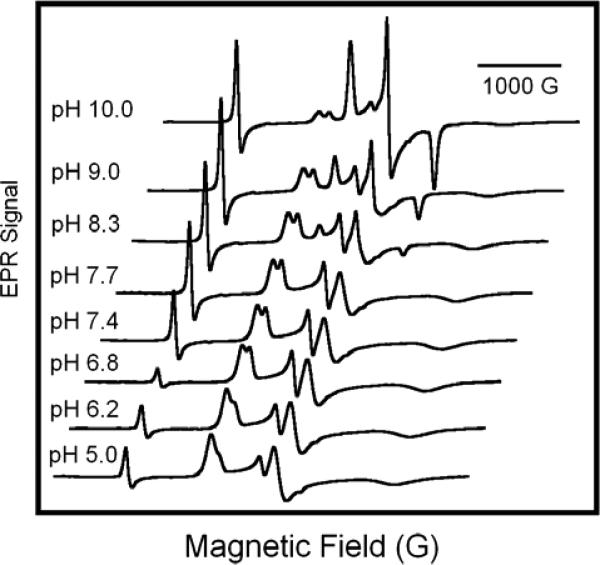
As illustrated in Fig. 8, the relative intensity of the sub-components of each doublet feature in the EPR spectra of metHb:NO2− exhibit notable variations with pH over the range pH 5 to pH 10. As the pH increases, the intensity of the feature at g≈2.9 increases relative to that at g≈3.0. This change in intensity is mirrored by the increase in intensity of the g≈2.3 feature relative to the g≈2.1 feature. This concerted variation allows for the assignment of features to two species, metHb:NO2− A and B, with g-values of (gx, gy, gz) of (3.018, 2.122, 1.45); and (2.870, 2.304,1.45) (PBS, 20K), and thus of (3.006, 2.129, 1.45) and (2.887, 2.299, 1.45) (HEPES, 20K). This assignment balances the sizes of the g-values, consistent with the general rule for hemichrome principal g-values that the sum of their squares be ~16 19.
Figure 8.
pH dependence of EPR spectrum of metHb:NO2−. Solutions of metHb in PBS poised at pH values as indicated in figure, 0.5mM in protein and 40mM in NaNO2 for all samples. The EPR spectra were recorded at 20 K with a microwave frequency of 9.24 GHz, a 16.67 G/s sweep rate, 0.5 s time constant, 5 G modulation amplitude, and 5 mW of microwave power.
With increases in pH above 8.3, the relative intensity of the metHb:NO2− signals decrease, as OH− becomes competitive with NO2− as a ligand. In the series depicted in Fig. 4, for a sample with a twenty fold molar excess NaNO2− over heme, metHb:OH− becomes apparent at a pH of ~8.3. At pH 10.0, metHb:OH− accounts for approximately 60% of the detected species.
Figure 4.
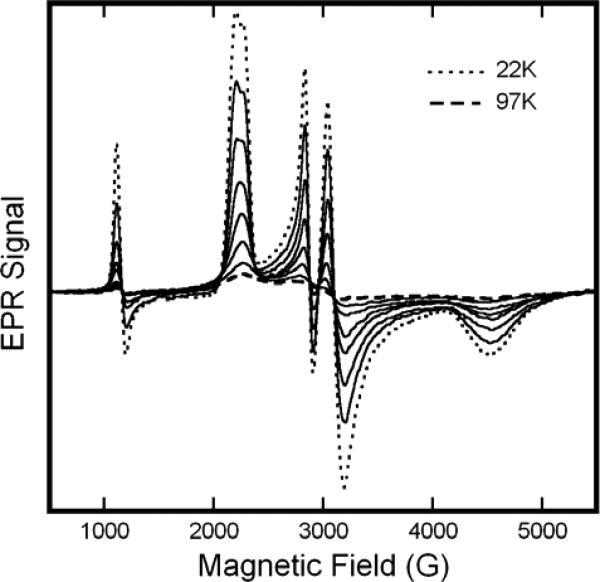
Variable Temperature EPR spectra of solutions of metHb:NO2− in HEPES buffer at pH 7.4. The sample included metHb at 0.65M and a twenty-fold molar excess (per heme) of NaNO2−. Spectra were obtained at 22, 32, 43, 54, 65, 76, 86, and 97 K. The EPR spectra were recorded at 9.24 GHz with a 16.67 G/s sweep rate, a 0.5 s time constant, 5 G modulation amplitude, and 5 mW of microwave power.
In addition to changes in complexation, this series of EPR spectra also reveal changes in the positions of certain features in the metHb:NO2− spectra with pH. The greatest change is sustained by the low field feature of metHb:NO2− species A: it appears at g≈3.00 at pH 5.0; g≈3.02 at pH 7.4, and g≈3.04 at pH 10.0. The central feature of species A (g=2.12) also shifts as a function of pH, although its exact position is difficulty to follow because it is masked at higher pH by the metHb:OH− spectrum. Nevertheless, the parallel trend lends further support to our assignment of this feature and the g=3.02 feature to the same species. Changes to metHb:NO2− B features are more subtle; the low field feature of species B varies from g=2.86 at pH 5.0 to g=2.87 at pH 10.0. The broad high field features of both species A and B do not show discernible, pH dependent changes in position.
Variable Temperature EPR
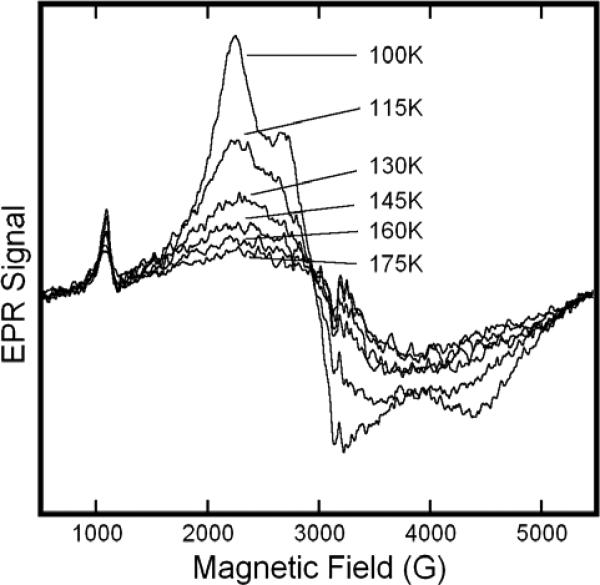
The presence of multiple species that are distinguished by EPR in samples of metHb:NO2− is reminiscent of the behavior of Fe(II)NO in Hb(NO)4. EPR spectra in Hb(NO)4 show two different species (axial and rhombic) with, moreover, subunit distinctions that are most clearly illuminated in variable temperature EPR studies20, 21. In light of this precedent, we undertook variable temperature EPR studies of metHb:NO2−. Exemplary spectra are shown in Figs. 5 and 6.
Figure 5.
Variable Temperature EPR spectra of solutions of metHb:NO2− in HEPES buffer at pH 7.4. The sample included metHb at 0.65M and a twenty-fold molar excess (per heme) of NaNO2−. Spectra were obtained at the indicated temperatures in the range 100K to 175K. EPR spectra were recorded at 9.1 GHz with a 16.67 G/s sweep rate, a 0.5 s time constant, 5 G modulation amplitude, and 10 mW of microwave power.
Figure 6.
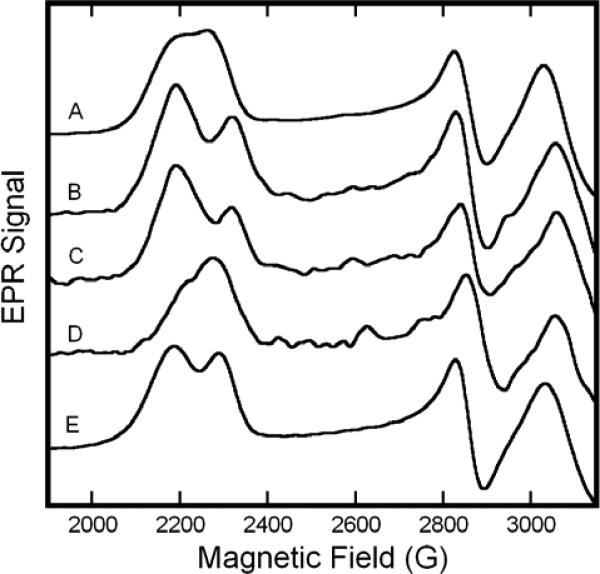
EPR spectra of Fe(II)NO/Fe(III)NO2−hybrids and related hemoglobins. For detail, only the variable, low-field portion of the spectrum is shown. (A) metHb:NO2− in HEPES, pH 7.4; (B) β-Fe(II)NO/α-Fe(III)NO2− in HEPES, pH 7.4; (C) SNO-metHb:NO2− in HEPES pH 7.4; (D) α-Fe(II)NO/β-Fe(III)NO2− hybrid in HEPES pH 7.4; (E) metHb:NO2− in PBS pH 7.4. All spectra were recorded at 20 K with a frequency of 9.24 GHz, 0.5 s time constant and sweep rate of 16.67 G/s. For spectra A and E the modulation amplitude was 5 G and the microwave power was 5 mW. Spectra B-D were recorded with 1 G modulation amplitude and 10 mW microwave power.
At temperatures below 20K, the metHb:NO2− spectrum is readily saturated and, absent sufficient care, subject to lineshape and intensity distortion, as has been recently realized by others18. Spectra are obtained with facility in the temperature range of 20 to 100K, and display only very subtle changes in the position and shape of spectral features. The separate components of the low-field feature remain resolved until the temperature is raised to ~54K, while the central doublet remains resolved until the temperature exceeds ~100K. There appears to be little, if any, net interconversion between the two species, in contrast to the spectrum of Hb(NO)4, which over a similar temperature range, shows striking changes reflective of a temperature-dependent equilibrium between the axial and rhombic species21. This effect was first noted in the EPR spectrum of Fe(II)NO myoglobin by Morse and Chan22. As illustrated in Fig. 6, once the sample temperature exceeds115K, there appears to be sufficiently rapid and unrestricted motion of the nitrite ligand that the spectra of both of the metHb:NO2− species no longer exhibit g-anisotropy.
In light of the motional averaging that ensues at cryogenic temperatures, the apparent lack of a temperature dependent interconversion between the metHb:NO2− A and B species at the lower temperatures is intriguing. It is possible that the temperature dependence of an equilibrium constant between the A and B species is small enough (e.g., if A and B were isoenthalpic) that no temperature dependence of the partitioning into A and B spectra is observed. Alternatively, it may be the case that the motion that the ligand undergoes cannot support species interconversion. This possibility is very difficult to reconcile with a conjecture that species A and B entail structural or linkage isomers; rather, it strongly suggests that the A and B reflect differences in nitrite binding between α and β subunits of hemoglobin, in which case motion leading to spectral averaging could occur entirely within a given subunit's heme pocket, without inter-subunit ligand exchange. However, if species A and B are each associated with a particular subunit, equal populations of each are expected in the presence of putatively saturating nitrite. Detailed simulation of the spectra revealed that the A:B ratio is not 1:1, and thus suggest that binding modes that entail greater complexity than simple subunit inequalities.
Hb Hybrids
In an effort to further illuminate possible subunit differences in nitrite binding to hemoglobin, we prepared hybrids of the form: α-Fe(II)NO/ β-Fe(III) Hb, and β-Fe(II)NO/ α-Fe(III) Hb and examined the EPR spectra of their nitrite complexes. In these experiments, the balance between ferrous nitrosyl and metHb species was assayed by UV-VIS spectroscopy, while the subunit populations were monitored by examination of their Fe(II)NO EPR spectra2.
A first class of samples was prepared by reductive nitrosylation with limiting NO2. An exemplary preparation, spectra of which are shown in Fig. 7B, was analyzed as 30% Fe(II)NO and 70% Fe(III), with the Fe(III) distributed as >66% α and <33% β. A second class of samples (Fig. 7D) was created through partial autoxidation of Hb(NO)4, which resulted in 56% Fe(II)NO and 44% Fe(III), 2% of which was α-Fe(III) and the remaining 98% β-Fe(III). To each hybrid, NaNO2 was then added to twenty fold molar excess over the ferric heme present.
Figure 7.
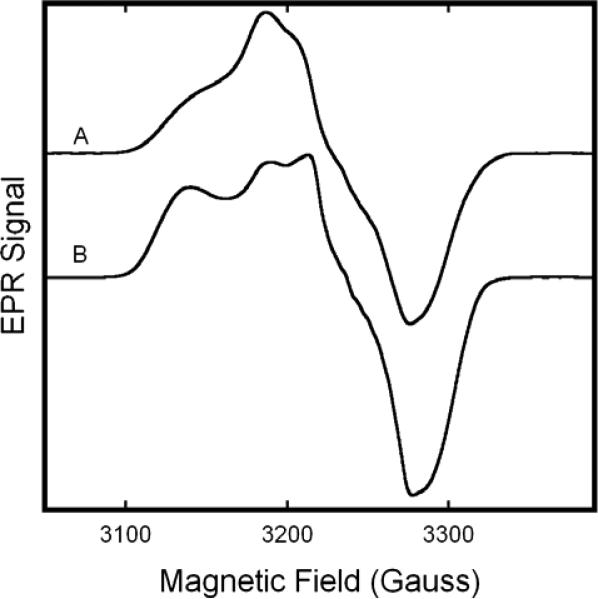
EPR spectra of Fe(II)NO of Fe(II)NO/Fe(III)NO2− hybrid hemoglobins Only the central region of the spectrum, featuring the the ferrous nitrosyl EPR signal is shown. (A) β-Fe(II)NO/α-Fe(III)NO2−, as in fig. 6B. (B) α-Fe(II)NO/β-Fe(III)NO2− hybrid as in fig.6D. Spectra were obtained with the sample in boiling nitrogen (76 K), at a microwave frequency of 9.12 GHz, 10mW microwave power, 5 G modulation amplitude, a sweep rate of 3.33 G/s, and a time constant of 0.128 s.
As compared to the spectrum of the nitrite complex of the standard metHb (Fig. 7A), the spectrum of the hybrid with excess α-Fe(III) (Fig. 7B), exhibited a reduction in intensity of the B component of the low-field feature (g≈2.89), as well as a shift of that component to a slightly higher field (g≈2.85). The ratio of species A to B was 3.2:1. In the hybrid with excess β-Fe(III) (Fig. 7D), the position of the two low field features remains constant, but the g=3.006 feature displays a reduction in intensity compared to normal metHb:NO2−. The A/B ratio was determined to be 0.8:1. Comparison of the central features is impeded by the much more intense Fe(II)NO signal (which begins to exhibit appreciable intensity ~3150G).
The spectroscopic results on these hybrids experiments are intriguing on multiple levels. First, since the shift of the g≈2.89 feature to g≈2.85 was only observed in hybrids prepared though reductive nitrosylation, we hypothesized that the shift might be caused by S-nitrosylation of the β-Cys93 thiol, a known product of this reaction2. To test this notion, we prepared an authentic SNO-metHb:NO2− complex. The EPR spectrum of this species, shown in Fig. 7C, manifests a similar perturbation of the g≈2.89 feature as does the hybrid prepared by reductive nitrosylation. Since S-nitrosylation occurs solely on the β subunit, species B must be associated with the β-Fe(III):NO2−. However, the A:B ratios of the two hybrids reveals the simple α=A and β=B assignment to be inadequate. (In the oxidized Hb(NO)4 hybrid, the α:β Fe(III) ratio was 1:49, yet the A:B ratio was 0.8:1; the hybrid prepared through reductive nitrosylation had an α:β Fe(III) ratio 2:1 and an A:B ratio of 3.2:1). The simplest explanations consistent with our results is that the α-Fe(III)NO2− is found as species A only, while β-Fe(III)NO2− can assume a conformation/linkage consistent with either spectrum A or B.
Affinity
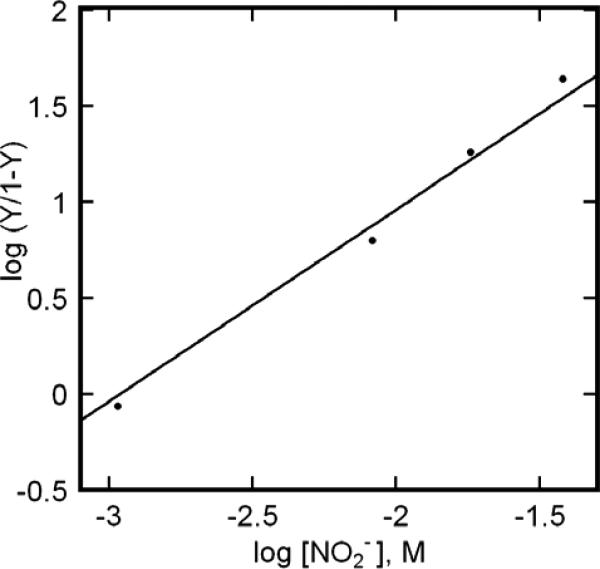
Dissociation constants (Kd) of metHb:NO2− were determined by means of the Hill analysis23 detailed in Fig. 9. In these experiments, we examined samples in both PBS and HEPES, and added nitrite at molar equivalence and in five-, ten- and twenty- fold excess over met-heme. The analysis utilized concentrations determined by UV-VIS, with differentiation of the Fe(III) products and reactants being determined by EPR spectroscopy. The assayed concentrations confirmed mass balance of protein before and after the addition of nitrite; no evidence for formation of EPR silent products was observed. The concentration of nitrite in solution was calculated as original nitrite added less metHb:NO2− formed, as done by others6, 18, 24. The absence of change in the metHb:NO2− EPR spectrum over several hours suggests that there is no or limited consumption of nitrite under our reaction conditions, supporting the method employed to estimate nitrite concentration. The slope of the Hill plot reflects the absence of cooperativity in ligand binding and affords values for Kd of metHb:NO2− of 1.24±0.5 mM in HEPES pH 7.4, and 1.68±0.4 mM in KPBS pH 7.4.
Figure 9.
Exemplary Hill plot summarizing the titration of metHb with NaNO2. The species concentrations used in the plot were obtained from detailed simulation of experimental EPR spectra. For the particular trial depicted in this plot, the protein concentration was 0.5 mM (pH 7.4 HEPES), with NaNO2 at, alternatively, one-, five-, ten- and twenty-fold excess over heme. Supporting data are provided in supplementary figures.
A cursory examination of the peak heights of aquo-Met-Hb versus Met-Hb:NO2− reveals a pH dependence of the affinity of Met-Hb for nitrite. The affinity of Met-Hb for nitrite is greatest at pH 6.8, though the change in affinity with pH is less dramatic than the sharp nature of the g=6 aquo-Met-Hb would lead one to believe. Additionally, having obtained the relative concentrations of the various components in experimental spectra (Figure 2-5), we determined the pKa (Ka= KAB in Figure 2-11) of the water ligand to be 8.15 at pH 8.3, which is in good agreement with the values determined previously 25, 26.
DISCUSSION
The EPR measurements of metHb:NO2− presented here indicate that addition of NaNO2 to metHb results in the formation of two distinct heme Fe(III):NO2− species. EPR measurements at multiple frequencies and measurements in D2O rule out assignment of this splitting as hyperfine structure. Systematic changes in the EPR spectra with pH enable the assignment of each component of the doublet features to the spectra of two species. Thus, we conclude that the EPR spectrum of metHb:NO2− is a composite of two species with g-values of 3.018, 2.122, 1.45 and 2.870, 2.304, 1.45 at pH 7.4 in PBS and 3.006, 2.129, 1.45 and 2.887, 2.299, 1.45 at pH 7.4 in HEPES buffer. On the basis of EPR studies of Fe(III)NO2−/Fe(II)NO hybrids, we conjecture that one of the species is present in both the α-and β-subunit, while the other is exclusive to β-subunit. EPR experiments on hybrids also led to the discovery of an effect of S nitrosylation on the β-subunit Fe(III)NO2− EPR spectrum.
In their pioneering EPR studies of hemichromes, Peisach and Blumberg27 used g-values to categorize low-spin Fe(III) heme proteins and model complexes according to the relative sizes of the tetragonal and rhombic ligand field components that they imply. Complexes with different types of axial ligands lie in distinct neighborhoods, when mapped with their ligand field parameters as coordinates. Both sets of g-values reported here for metHb:NO2− fall into the region associated with B-type hemichromes (since termed Type II hemichromes19). This type of hemichrome typically has an Fe(III)-N bond, such as the imidazole nitrogen of the eponymous cytochrome B. Characterization as a B-type hemichrome naturally suggests that nitrite coordination to metHb assumes N-nitro, rather than O-nitrito, binding mode, or binds through an atom with electronegativity similar to an imidizole nitrogen. The recent crystallographic studies of Richter-Addo and co-workers11, however, reveal O- rather than N-nitro coordination, and, moreover, revealed the presence of distinct nitrito conformers in the α vs. β subunits of metHb:NO2−. The crystallographic and EPR results seem difficult to reconcile. Such discrepancies between solution and crystallographic studies, however, are not without precedent in Hb. In particular, EPR studies of Hb(NO)4 show marked differences in g-values obtained in single crystal versus frozen solution EPR samples28, 29. DFT calculations presented by Basu and co-worker found N-nitro coordination to be about 7 kcal/mol more stable than O-nitrito coordination; calculations of g-values for the different species may be very illuminating6.
Combining the information gained from the variable pH and the hybrid data, assignment of the two Met-Hb:NO2− species can be proposed. At pH 5, the ratio of species A:B is 7:1 and the two Met-Hb:NO2− species account for >98% of the Met-Hb species detected, ruling out the assignment of one species to the α-subunit and the other species to the β-subunit. The spectrum of the SNO-Met-Hb:NO2− hybrid does link the species B spectrum to the β-subunit. Yet, the spectrum of the α-Fe(II)NO/β-Fe(III)-hybrid Hb demonstrates that the β-subunit can assume the conformation of both species A and B, while the α-Fe(III)/ β-Fe(II)NO-hybrid Hb seems to indicate that the α-subunit is only found in the species A form.
The pH dependence of the ratio of the two species suggests a possible origin of the two species. The distal pocket, the site of ligand binding, is larger in the α-subunit than in the β-subunit 21. Moreover, the distal histidine of the β-subunit (βHis63) has been shown to swing out of the distal pocket 30, creating more space in the distal pocket and alleviating steric interference with ligands, as originally suggested by Perutz 31, 32. This distal histidine rotation is pH dependent 30 and has been reported in a variety of heme proteins 33,37. Furthermore, these conformational changes of the distal histidine and pocket are limited to the β-subunit 30, 38, consistent with our results that indicate that only the β-subunit can interconvert between species A and B.
In Figure 8, the relative percentage of species A increases as pH decreases. Concomitant with this increase is the decrease in the relative percentage of species B, while all other species remain constant, demonstrating the conversion of species B to species A as pH decreases. The pH dependent conversion between Met-Hb:NO2− species is consistent with the pH dependent rotation of the distal histidine of the β-subunit. The movement of the distal histidine opens the distal pocket, allowing nitrite to assume the same conformation as in the larger α-heme distal pocket, species A.
Movement of the distal histidine would also affect the affinity of Met-Hb for nitrite. At higher pH, the position of the distal histidine of the β-heme sterically hinders ligand binding 30, 32. Additionally, at high pH, nitrite must compete with hydroxide for Met-Hb, the more compact hydroxide having easier access to the heme pocket. As the pH is lowered and the distal histidine swings out of the heme pocket, ligand binding is enhanced by the additional space created, allowing the β-subunits to assume the most energetically favorable conformation. The modest decrease in affinity below pH 6.8 could possibly results from continued rotation of distal histidine, especially if species A is stabilized by a hydrogen bond from the imidazole nitrogen. Additionally, the pKa of nitrite (3.16 at 298K 39), in conjunction with the reduction of pH that occurs upon freezing PBS buffer 13, 40, could result in a substantial portion of nitrite being protonated in the pH 5.0 and 6.2 Met-Hb:NO2− samples, causing an apparent reduction in Met-Hb affinity for nitrite.
Hemoglobin is known to be a robust protein, resisting denaturation over a wide pH range. Hollecher and Buckley demonstrated the efficacy of EPR spectroscopy in measurements of Met-Hb over the range from pH 3 to pH 12 41. Others have shown acid induced denaturation to occur below pH 4 42 and alkaline denaturation to occur above pH 11 43. Using a pH range similar to ours, Svistunenko et al. conducted an EPR investigation of the pH dependence of Met-Hb hemichrome species, noting that all species detected were also present in whole blood 17. Moreover, the modest changes we observe in the Met-Hb:NO2− EPR spectrum (Figure 8) over the pH range employed demonstrate the absence of any protein unfolding that would abrogate the conclusions drawn.
Additionally, we reiterate the weak binding of nitrite to metHb, with the Kd of metHb:NO2− in the mM range in both HEPES and PBS buffers. The dissociation constants of metHb:NO2− presented here are calculated from direct EPR measurements of the various Hb species: aquo-metHb, hydroxy-metHb, and metHb:NO2−, in contrast to the work of Basu et al., in which only aquo-metHb was measured. Our approach allows a check for mass balance and clear demonstration that the metHb:NO2− species detected by EPR account for all heme products formed during the reaction. With this check on the sufficiency of the analysis, we obtain dissociation constants that are more reliable that those obtained indirectly6, and which are in good agreement to previously reported optical data7, 44.
We also note, that the UV-VIS data of Basu et al.6, that were obtained to monitor the progress of the reaction of deoxyHb with nitrite, provide an alternative means to estimate the nitrite dissociation constant. In experiments with excess nitrite (for example, Fig. 1e of Basu et al.6) the reaction reaches an endpoint in which the metHb formed is in equilibrium with the excess nitrite. From the observed concentrations of metHb, metHb:NO2−, and the reported nitrite exposure, dissociations constants can be inferred that are two orders of magnitude larger than those determined by their EPR measurements.
The discrepancy provokes one additional comment. In their experimental design, the metHb:NO2− complex was often formed, as noted above, as a reaction product. As such, a metHb:NO2− basis spectrum must certainly be included in the least squares decomposition of composite UV-VIS spectra, and will obviously improve the least squares fit. This situation, however, does not justify a claim that metHb:NO2− is a reaction intermediate. Indeed, their reported data make a better case for the intermediacy of Fe(III)NO, as it is observed to improve the least squares fit only during the reaction, not at its endpoint (Basu et al.6 Fig. 1f).
In closing, it is worth noting some pitfalls that can occur in quantitative analyses of EPR spectra in multi-component systems. First, care must obviously be taken to ensure that the microwave power applied is appropriate to avoid saturation of all spin components to avoid errors in the interpretation of relative intensities. Second, it is of clear importance, when measuring species with broad spectra, that data be collected over the full magnetic field range; broad high-field features are regularly encountered in low-spin Fe(III)-heme species. If the full spectrum is not measured, substantial errors in quantitation are possible8. Finally, since transition moments differ for spin systems with different spin multiplicities – even for transitions between nominal ms ±1/2 spins states, detailed simulation are required to quantify interconversion among such species – relative integrated intensities can be misleading. Thus, although we observed that the addition of NO2− to metHb resulted in an overall loss of (integrated) EPR signal, detailed simulation of the experimental spectra for both high-spin and low-spin species demonstrated that the number of spins was conserved after nitrite addition10. Apart from spectral simulation this conservation would not be readily apparent, and might be mistaken for the formation of an EPR “silent” species.
Supplementary Material
ACKNOWLEDGEMENTS
This work was supported by National Science Foundation Grant MCB 0981228 (to D.J.S.) and National Heart, Lung, and Blood Institute Grant R01 HL421444 to J.S.S). Support from the Murdock Chartable Trust for the acquisition of the EMX EPR spectrometer is gratefully acknowledged. The authors also thank Dr. Ben Luchsinger for helpful discussions and suggestions throughout this work.
Contributor Information
David Schwab, Montana State University, Chemistry and Biochemistry.
Jonathan Stamler, Duke University Medical Center, Medicine.
David Singel, Montana State University, Chemistry and Biochemistry.
Reference
- 1.Allen BW, Stamler JS, Piantadosi CA. Trends Mol Med. 2009;15:452–460. doi: 10.1016/j.molmed.2009.08.002. [DOI] [PMC free article] [PubMed] [Google Scholar]
- 2.Luchsinger BP, Rich EN, Gow AJ, Williams EM, Stamler JS, Singel DJ. Proc Natl Acad Sci U S A. 2003;100:461–466. doi: 10.1073/pnas.0233287100. [DOI] [PMC free article] [PubMed] [Google Scholar]
- 3.McMahon TJ, Moon RE, Luchsinger BP, Carraway MS, Stone AE, Stolp BW, Gow AJ, Pawloski JR, Watke P, Singel DJ, Piantadosi CA, Stamler JS. Nat Med. 2002;8:711–7. doi: 10.1038/nm718. [DOI] [PubMed] [Google Scholar]
- 4.Angelo RM, Singel DJ, Stamler JS. Proc. Natl. Acad. USA. 2006;103:8366–8371. doi: 10.1073/pnas.0600942103. [DOI] [PMC free article] [PubMed] [Google Scholar]
- 5.Luchsinger BP, Rich EN, Yan Y, Williams EM, Stamler JS, Singel DJ. J Inorg Biochem. 2005;99:912–921. doi: 10.1016/j.jinorgbio.2004.12.010. [DOI] [PubMed] [Google Scholar]
- 6.Basu S, Grubina R, Huang J, Conradie J, Huang Z, Jeffers A, Jiang A, He X, Azarov I, Seibert R, Mehta A, Patel R, King SB, Hogg N, Ghosh A, Gladwin MT, Kim-Shapiro DB. Nature Chemical Biology. 2007;3:785–794. doi: 10.1038/nchembio.2007.46. [DOI] [PubMed] [Google Scholar]
- 7.Rodkey FL. Clinical Chemistry. 1976;22:1986–1990. [PubMed] [Google Scholar]
- 8.Young LJ, Siegel LM. Biochemistry. 1988;27:2790–2800. doi: 10.1021/bi00408a020. [DOI] [PubMed] [Google Scholar]
- 9.Peisach J, Blumberg WE, Ogawa S, Rachmilewitz EA, Oltzik R. J Biol Chem. 1971;246:3342–55. [PubMed] [Google Scholar]
- 10.Schwab DE, Stamler JS, Singel DJ. Nature Chemical Biology. 2009;5:366–366. doi: 10.1038/nchembio0609-366. [DOI] [PubMed] [Google Scholar]
- 11.Yi J, Safo MK, Richter-Addo GB. Biochemistry. 2008;47:8247–8249. doi: 10.1021/bi801015c. [DOI] [PubMed] [Google Scholar]
- 12.Geraci G, Parkhurst LJ, Gibson QH. Journal of Biological Chemistry. 1969;244:4664–4667. [PubMed] [Google Scholar]
- 13.Williams-Smith DL, Bray RC, Barber MJ, Tsopanakis AD, Vincent SP. Biochem Journ. 1977;167:593–600. doi: 10.1042/bj1670593. [DOI] [PMC free article] [PubMed] [Google Scholar]
- 14.Gow AJ, Luchsinger BP, Pawloski JR, Singel DJ, Stamler JS. Proc Natl Acad Sci U S A. 1999;96:9027–9032. doi: 10.1073/pnas.96.16.9027. [DOI] [PMC free article] [PubMed] [Google Scholar]
- 15.Glasoe PKL, F.A. The Journal of Physical Chemistry. 1960;64:188–190. [Google Scholar]
- 16.Stoll S, Schweiger A. Journal of Magnetic Resonance. 2006;178:42–55. doi: 10.1016/j.jmr.2005.08.013. [DOI] [PubMed] [Google Scholar]
- 17.Svistunenko DA, Sharpe MA, Nicholls P, Blenkinsop C, Davies NA, Dunne J, Wilson MT, Cooper CE. Biochem J. 2000;351(Pt 3):595–605. [PMC free article] [PubMed] [Google Scholar]
- 18.Goetz BI, Wang P, Shields HW, Basu S, Grubina R, Huang J, Conradie J, Huang Z, Jeffers A, Jiang A, He X, Azarov I, Seibert R, Mehta A, Patel R, King SB, Ghosh A, Hogg N, Gladwin MT, Kim-Shapiro DB. Nature Chemical Biology. 2009;5:367–367. [Google Scholar]
- 19.Walker FA. Coordination Chemistry Reviews. 1999;186:471–534. [Google Scholar]
- 20.Flores M, Wajnberg E, Bemski G. Biophys J. 1997;73:3225–3229. doi: 10.1016/S0006-3495(97)78347-4. [DOI] [PMC free article] [PubMed] [Google Scholar]
- 21.Huttermann J, Burgard C, Kappl R. J. Chem. Soc. Faraday Trans. 1994;90:3077–3087. [Google Scholar]
- 22.Morse RH, Chan SI. J Biol Chem. 1980;255:7876–7882. [PubMed] [Google Scholar]
- 23.Hill AV. The Journal of Physiology. 40:i–vii. [Google Scholar]
- 24.Goetz BI, Shields HW, Basu S, Wang P, King SB, Hogg N, Gladwin MT, Kim-Shapiro DB. Nitric Oxide. 2010;22:149–154. doi: 10.1016/j.niox.2009.10.009. [DOI] [PMC free article] [PubMed] [Google Scholar]
- 25.Coryell CDS, F., Pauling L. J. Am. Chem. Soc. 1937;59:633–642. [Google Scholar]
- 26.Okonjo KO, Vega-Catalan FJ. Eur J Biochem. 1987;169:413–416. doi: 10.1111/j.1432-1033.1987.tb13627.x. [DOI] [PubMed] [Google Scholar]
- 27.Blumberg W, Peisach J. Adv. Chem. Ser. 1971;100:271–291. [Google Scholar]
- 28.Dickinson LC, Chien JCW. Biochemical and Biophysical Research Communications. 1974;59:1292–1297. doi: 10.1016/0006-291x(74)90454-9. [DOI] [PubMed] [Google Scholar]
- 29.Doetschman DC, Utterback SG. Journal of the American Chemical Society. 1981;103:2847–2852. [Google Scholar]
- 30.Jenkins JD, Musayev FN, Danso-Danquah R, Abraham DJ, Safo MK. Acta Crystallogr D Biol Crystallogr. 2009;65:41–48. doi: 10.1107/S0907444908037256. [DOI] [PubMed] [Google Scholar]
- 31.Perutz MF. Nature. 1970;228:726–739. doi: 10.1038/228726a0. [DOI] [PubMed] [Google Scholar]
- 32.Perutz MF, Wilkinson AJ, Paoli M, Dodson GG. Annu Rev Biophys Biomol Struct. 1998;27:1–34. doi: 10.1146/annurev.biophys.27.1.1. [DOI] [PubMed] [Google Scholar]
- 33.Akiyama K, Fukuda M, Kobayashi N, Matsuoka A, Shikama K. Biochim Biophys Acta. 1994;1208:306–309. doi: 10.1016/0167-4838(94)90117-1. [DOI] [PubMed] [Google Scholar]
- 34.Geibel J, Chang CK, Traylor TG. J Am Chem Soc. 1975;97:5924–5926. doi: 10.1021/ja00853a053. [DOI] [PubMed] [Google Scholar]
- 35.Tian WD, Sage JT, Champion PM. J Mol Biol. 1993;233:155–166. doi: 10.1006/jmbi.1993.1491. [DOI] [PubMed] [Google Scholar]
- 36.Vallone B, Nienhaus K, Matthes A, Brunori M, Nienhaus GU. Proc Natl Acad Sci U S A. 2004;101:17351–17356. doi: 10.1073/pnas.0407633101. [DOI] [PMC free article] [PubMed] [Google Scholar]
- 37.Kamimura S, Matsuoka A, Imai K, Shikama K. Eur J Biochem. 2003;270:1424–1433. doi: 10.1046/j.1432-1033.2003.03498.x. [DOI] [PubMed] [Google Scholar]
- 38.Tsuruga M, Matsuoka A, Hachimori A, Sugawara Y, Shikama K. J Biol Chem. 1998;273:8607–8615. doi: 10.1074/jbc.273.15.8607. [DOI] [PubMed] [Google Scholar]
- 39.da Silva G, Kennedy EM, Dlugogorski BZ. J Phys Chem A. 2006;110:11371–11376. doi: 10.1021/jp0639243. [DOI] [PubMed] [Google Scholar]
- 40.Orii Y, Morita M, Biochem J. 1977;812:163–168. doi: 10.1093/oxfordjournals.jbchem.a131431. [DOI] [PubMed] [Google Scholar]
- 41.Hollocher TC, Buckley LM. J Biol Chem. 1966;241:2976–2980. [PubMed] [Google Scholar]
- 42.Munoz G, de Juan A. Anal Chim Acta. 2007;595:198–208. doi: 10.1016/j.aca.2006.11.081. [DOI] [PubMed] [Google Scholar]
- 43.Haurowitz F, Hardin RL, Dicks M. Journal of Physical Chemistry. 1954;58:103–105. [Google Scholar]
- 44.Smith RP. Biochemical Pharmacology. 1967;16:1655–1664. doi: 10.1016/0006-2952(67)90240-7. [DOI] [PubMed] [Google Scholar]
Associated Data
This section collects any data citations, data availability statements, or supplementary materials included in this article.


