

Abstract
Introduction
Cholesteryl ester transfer protein (CETP) is involved in reverse cholesterol transport by exchanging cholesteryl esters for triglycerides between HDL and LDL particles, effectively decreasing HDL cholesterol levels. Variants within a large haplotype block upstream of CETP (rs247616, rs173539) have been shown to be significantly associated with reduced expression; however, the underlying mechanism had not been identified.
Methods
We analyzed the linkage structure of our top candidate Single Nucleotide Polymorphism (SNP), rs247616, and assessed each SNP of the haplotype block for potential interactions with transcription factor binding sites. We then used a reporter gene assay to assess the effect of 3 SNPs (rs247616, rs173539, and rs1723150) on expression in vitro.
Results
Several variants in the upstream haplotype, including rs247616, rs173539, and rs1723150, disrupt or generate transcription factor binding sites. In reporter gene assays, rs247616 and rs173539 significantly affected expression in HepG2 cells, whereas and rs17231506 had no effect. rs247616 decreased expression 1.7-fold (p<0.0001), while rs173539 increased expression 2.2 fold (p=0.0006).
Conclusions
SNPs, rs247616 and rs173539, are in high linkage disequilibrium (R2=0.96, D’=1.00) and have the potential to regulate CETP expression. While opposing effects suggest that regulation of CETP expression could vary between tissues, the minor allele of rs247616 and SNPs in high linkage with it were found to be associated with reduced expression across all tissues.
Keywords: Cholesterol Metabolism, Molecular Genetics, Gene expression, Statins, Transcription, Genetics, HDL, LDL, CETP
Introduction
Cholesteryl Ester Transfer Protein (CETP) is involved in reverse cholesterol transport from the periphery to the liver where it is converted to bile acids and excreted. Expressed highly in spleen and liver [1–3], CETP is secreted into the circulation [4]. There, CETP facilitates the transfer of cholesteryl esters from high-density lipoprotein (HDL) particles to low-density lipoprotein (LDL) particles, in exchange for triglycerides [4]. Increased CETP activity reduces the HDL/total cholesterol ratio, which is associated with an increased risk for coronary artery disease (CAD) [5–7].
Genetic CETP deficiency resulting in increased HDLc and decreased LDLc in Japanese populations, causes various cardiovascular abnormalities, and was reported to be anti-atherogenic [8] or atherogenic [9]. Targeting CETP for inhibition has been a goal of pharmaceuticals; however, initial clinical results have shown no benefit or enhanced risk [10,11]. Off-target effects of CETP inhibitors are suspected to play a role, but genetic CETP variants may also affect disease risk and treatment outcomes. CETP variants have been associated with HDL levels; however, observed effects on CAD risk are weak [12]. The minor allele of the marker Taq1B (rs708272) has been associated with reduced CETP activity and reduced benefit from statin therapy, suggesting a possible gene-drug interaction [13,14]. Regulation of CETP expression has since been shown to be influenced significantly by SNPs 5-10kb upstream of the gene through GWAS analysis and molecular genetics studies [15,16]. Multiple SNPs in this region are in high LD with each other on a long haplotype block stretching across the upstream region into the 5’ portion of CETP and including Taq1B [16]. The upstream enhancer SNPs (rs247616, rs173539, and rs3764261), in partial LD with Taq1B, were shown to be highly associated with CETP mRNA expression in the liver, and with reduced CETP activity and increased HDLc levels [16–18]. Subsequently, Leusink et al. found that CETP enhancer variant rs3764261, in partial LD with Taq1B (R2=0.442, D’=0.886), and in high LD with rs247616 (R2=1, D’=1), also associates with lower efficacy of statins in preventing CAD [19].
Previous studies had focused on non-synonymous single nucleotide polymorphisms (SNPs) in the coding region (such as I405V [rs5882]) and on variants within the proximal promoter region up to 1kb from the transcription start site [20,21], which also reside on the large 5’ haplotype block with upstream enhancer variants. In addition, a splicing SNP (rs5883), generating an mRNA lacking exon 9 and a protein devoid of cholesteryl ester transfer activity, had been associated with reduced CETP activity and increased HDLc levels [16–18].
Genetic studies have also been carried out in transgenic mice using human or simian CETP [22–28]. However, the inserted CETP regions did not include the enhancer regions located upstream of CETP, and mice do not express CETP. Therefore, further study is required to understand the complex regulation of CETP in humans.
By measuring allelic expression imbalance (AEI) in human livers and associating it with genotype, we have previously identified rs247616 as the most likely variant responsible for reduced CETP mRNA expression [16,29]. However, other promoter/enhancer variants could also have been causing or contributing to CETP transcription, and CETP is likely to harbor multiple regulatory variants. The current study aimed to determine the role of rs247616 in regulation of CETP mRNA expression, and distinguish whether it is solely responsible for the observed AEI, is in strong linkage disequilibrium (LD) with the functional SNP, or acts in concert with additional functional variants. We use transcription factor binding site prediction tools to inform our search, and a reporter gene assay to assess the potential function of the SNP. Given the pervasive effect of CETP on HDL and LDL levels, a better understanding of the molecular mechanisms underlying genetic effects is critical to resolving the relationship between CETP variants, lipid levels, and cardiovascular disease.
Materials and Methods
Identifying rs247616 linkage structure
Genotypes from the 1000 Genomes project (1000genomes.org) were analyzed using PLINK (Harvard) [30]. Variants up to 30 megabases upstream and downstream of rs247616 were assessed for linkage disequilibrium to rs247616 in Caucasians.
Association with Expression in tissues
We measured the association between each SNP and CETP expression in liver, spleen and across 53 tissue types using genotypes and RNA-seq expression data from the GTEx database. Genotype data was accessed through dbGAP project 5358 under IRB protocol 2013H0096. Significance of association was determined using the student’s t-test.
Transcription factor binding site prediction
MatInspector (Genomatix, Germany) was used to predict transcription factor binding sites lost or gained by the minor allele of SNPs found by sequencing. Fifty base-pair regions centered on each SNP were submitted with the minor and major alleles, and differences were recorded. The difference between the matrix similarity (a weighted score of the match of the inputted sequence to the defined matrix) and the optimized matrix similarity (a threshold defined for each matrix) was used to determine the quality of the match. Positive/negative scores indicate that the allele has a matrix similarity greater/lesser than the optimized matrix similarity, suggesting gain/loss of a potential new binding site for the transcription factor. Sites without differing scores between the major and minor allele, or sites with scores below the threshold for both alleles (suggesting poor binding for both) were discarded leaving only sites with allelic differences in binding [31,32]. Potential interactions between SNPs and transcription factors were assessed by visual inspection of the ENCODE tracks using the UCSC genome browser [33,34].
Coexpression analysis
Using data from The Genotype-Tissue Expression (GTEx) project (www.gtexportal.org, Broad Institute) [2], we correlated the expression of CETP in liver and spleen samples with the expression of transcription factors found to be influenced by SNPs in LD with our lead candidate SNP, rs247616 (n=19). The statistical package, R (r-project.org), was used to correlate the expression data using the Kendall method [35], and Benjamini-Hochberg [36] correction was used to adjust the p-values to account for multiple comparisons. A generalized linear model was tested in R to determine whether rs247616 genotype status affects the coexpression of CETP with transcription factors. Further, a multivariate analysis of CETP expression, transcription factor expression and predicted SNP interaction was conducted with a generalized linear model in R.
Reporter gene assays for enhancer activity using luciferase expression
To assess the effect of the minor allele of a SNP on expression, we inserted the candidate enhancer region, containing either the major or minor allele, into the multiple cloning site of a pGL-4.23 minimal promoter luciferase expression vector (Promega, USA) using the infusion system (Clonetech, USA) and primers shown in Table 1. The region around the candidate SNP of approximately 400bps was amplified by PCR. The vector was transformed into XL-10 gold E. coli. Colonies were isolated and validated by genotyping for the SNP. The sequence of the remaining insert was confirmed by Sanger sequencing. Three validated colonies for each insert were selected and combined for the luciferase expression assay.
Table 1.
Primers used in PCR and infusion cloning reactions
| Primer | Sequence (5′-3′) |
|---|---|
| rs247616-F infusion | GCTAGCCTCGAGGATATCGACTCAACAACAGGGCCACA |
| rs247616-R infusion | AGGCCAGATCTTGATATCGACAACAGAGGGACACTCTCTCTAATAAT |
| rs173539-F infusion | GCTAGCCTCGAGGATATCCCTGTGGTCCCAGTTACTTAGGA |
| rs173539-R infusion | AGGCCAGATCTTGATATCGCCATTTCCACTATACGGATCC |
| rs17231506-F infusion | GCTAGCCTCGAGGATATCCCATTATCCCCACCCTTGG |
| rs17231506-R infusion | AGGCCAGATCTTGATATCGGCTGGAGGAACTTCATTCATTA |
Each expression vector was co-transfected into HEK-293 and HepG2 cells with a renilla luciferase control vector using Lipofectamine 2000 (Life Technologies, USA) and the manufacturer’s procedure. Cells were plated into 12 well plates and incubated for 24 hours. The cells were then gently removed with trypsin, and counted and diluted approximately 1 to 10. Cells were placed in wells of a white, opaque 96-well plate. The Dual-Glo Luciferase Assay System (Promega, USA) was used to measure the firefly and renilla luciferase signals. Chemiluminescence measurements were taken with a Fusion plate reader (Perkin Elmer, USA). Transfections were carried out in triplicate or greater. Each graph shows the mean of 3 transfections (n=6 for rs247616), and error bars represent the standard error of the mean.
Results
Identifying rs247616 linkage structure
Previous work had identified rs247616, a SNP 6.2kb upstream of CETP, as the SNP most highly associated with Allelic Expression Imbalance (AEI); the minor allele confers a reduction in expression [16]. To search for additional candidate regulatory variants in the rs247616 haplotype block, we first identified additional SNPs in high LD with rs247616. Using CEU (Caucasian) population data from the 1000genomes project (1000genomes.org) and PLINK (Harvard) we identified all SNPs approximately 30Mb up and downstream of rs247616, and then calculated their LD to rs247616. Thirteen SNPs have an R2 greater than 0.77 (Table 2). An additional 3 SNPs have an R2 less than 0.77 and greater than 0.50, of which all are more highly linked with Taq1B (rs708272) (Table 3). These SNPs were not included in our analysis due to the previous lack of association of rs708272 with AEI for CETP in liver [16]. This indicates these three SNPs are unlikely to be regulatory variants affecting CETP mRNA expression.
Table 2.
Linkage structure of rs247616. Shaded rows indicate SNPs more strongly linked to rs708272
| SNP | Position | MAF | R2 | D' | Association to HDLca |
|---|---|---|---|---|---|
| rs12446515 | 56987015 | 0.33 | 1.00 | 1.00 | NTb |
| rs173539 | 56988044 | 0.33 | 1.00 | 1.00 | 4.65E-29 |
| rs247616 | 56989590 | 0.33 | 1.00 | 1.00 | 7.18E-29 |
| rs247617 | 56990716 | 0.33 | 1.00 | 1.00 | 1.52E-27 |
| rs183130 | 56991363 | 0.33 | 1.00 | 1.00 | 4.80E-27 |
| rs3764261 | 56993324 | 0.33 | 1.00 | 1.00 | 7.21E-29 |
| rs821840 | 56993886 | 0.33 | 1.00 | 1.00 | NT |
| rs36229491 | 56994244 | 0.33 | 1.00 | 1.00 | NT |
| rs17231506 | 56994528 | 0.33 | 1.00 | 1.00 | 4.11E-29 |
| rs56156922 | 56987369 | 0.33 | 0.98 | 1.00 | NT |
| rs56228609 | 56987765 | 0.31 | 0.93 | 1.00 | 4.23E-24 |
| rs12149545 | 56993161 | 0.31 | 0.93 | 1.00 | 3.19E-28 |
| rs200751500 | 57001274 | 0.31 | 0.87 | 0.97 | NT |
| rs72786786 | 56985514 | 0.33 | 0.78 | 0.88 | NT |
| rs7205804 | 57004889 | 0.45 | 0.51 | 0.93 | 5.16E-25 |
| rs1532625 | 57005301 | 0.45 | 0.51 | 0.93 | 4.83E-25 |
| rs1532624 | 57005479 | 0.45 | 0.51 | 0.93 | 6.35E-25 |
–[16]
-NT – Not Tested
Table 3.
Linkage structure of rs708272. Shaded rows indicate SNPs more strongly linked to rs247616
| SNP | Position | MAF | R2 | D' | Association to HDLca |
|---|---|---|---|---|---|
| rs711752 | 56996211 | 0.45 | 1.00 | 1.00 | 2.31E-26 |
| rs708272 | 56996288 | 0.45 | 1.00 | 1.00 | 8.77E-27 |
| rs34620476 | 56996649 | 0.45 | 1.00 | 1.00 | 9.89E-24 |
| rs34145065 | 56996645 | 0.44 | 0.98 | 1.00 | NTb |
| rs12720926 | 56998918 | 0.44 | 0.96 | 1.00 | 5.57E-19 |
| rs11508026 | 56999328 | 0.44 | 0.96 | 1.00 | 3.99E-24 |
| rs4784741 | 57001216 | 0.44 | 0.96 | 1.00 | 2.39E-23 |
| rs12444012 | 57001438 | 0.44 | 0.96 | 1.00 | 1.76E-23 |
| rs200373219 | 57001581 | 0.44 | 0.96 | 1.00 | NT |
| rs7205804 | 57004889 | 0.45 | 0.90 | 0.96 | 5.16E-25 |
| rs1532625 | 57005301 | 0.45 | 0.90 | 0.96 | 4.83E-25 |
| rs1532624 | 57005479 | 0.45 | 0.90 | 0.96 | 6.35E-25 |
| rs1800775 | 56995236 | 0.49 | 0.78 | 1.00 | 9.83E-25 |
| rs3816117 | 56996158 | 0.49 | 0.78 | 1.00 | 2.53E-24 |
| rs56228609 | 56987765 | 0.31 | 0.56 | 1.00 | 4.23E-24 |
| rs12149545 | 56993161 | 0.31 | 0.56 | 1.00 | 3.19E-28 |
| rs200751500 | 57001274 | 0.31 | 0.55 | 1.00 | NT |
–[16]
-NT – Not Tested
To assess their biological functions, we compared previously published associations for each of the 13 SNPs with HDL levels (Table 2) [16]. All tested were significantly associated with HDL, and owing to their high LD, could not be differentiated, thus necessitating examination of molecular mechanism.
Association of CETP variants with CETP mRNA expression in human tissues
CETP is broadly expressed in tissues such as adipose, liver, breast and thyroid, with the highest expression in spleen (Figure 1). We used CETP expression in all sequenced tissues and genotyping data for rs247616, rs173539, and rs17231506 from the GTEx database. We compared the number of minor alleles of each SNP to the relative expression of CETP in liver and spleen (Figure 2). Using the student’s t-test, we found significantly lower expression of CETP associated with the minor allele of each SNP in spleen (p=0.008), which displayed the highest CETP mRNA expression, indicating that this haplotype block is important for regulation of CETP expression. We observed slightly lower average expression in liver (520 counts versus 396 counts for 0 versus 2 alleles), but this did not reach significance (p=0.63). When analyzed together, all tissues sequenced by GTEx showed a significant association (p=0.024). In view of our targeted analyses on allele-selective CETP mRNA expression [16], it is apparent that rs247616 is associated with hepatic expression, but at a level undetectable in GTEX liver expression data as an eQTL. Additionally, we stratified samples by rs247616 genotype and found no additional SNPs to be significant after Bonferroni multiple test correction.
Figure 1. CETP expression in GTEx samples.

Count of RNA-seq reads for CETP in tissues. (www.gtexportal.org/home/gene/CETP)
Figure 2. mRNA expression of CETP in tissues.

CETP expression in Liver (left) and spleen (right), as a function of rs247616 genotype, obtained from GTEx (www.gtexportal.org). Each bar represents the expression of CETP for 0, 1, or 2 copies of the minor allele of rs247616. CETP levels in spleen are significantly lower in carriers of the minor alleles of rs247616, with similar data obtained with rs175539, and rs17231506, because of high LD between them. No significant effect is observed in other tissues analyzed separately, such as liver, showing lower CETP expression and less genotype influence. Nevertheless, rs247616 is significant across all tissues in GTEx combined (p-value=0.024; data not shown).
These results suggest that overall, the minor allele reduces expression in most or all tissues however, the magnitude of the effect may differ between tissues. Because of the high expression and significant eQTL values in the spleen, we subsequently focused on differences in transcription factor expression in both liver and spleen.
Transcription Factor Binding Site prediction
To determine whether these SNPs have a functional role, we assessed potential interactions with transcription factors. Sequence surrounding each SNP in LD with rs247616 and an R2 > 0.77 was submitted in pairs with the major and minor allele to MatInspector (Genomatix, Germany) to analyze lost or gained transcription factor binding sites. Using GTEx expression data, we identified transcription factors that are expressed in liver. Our findings reveal that many of the SNPs analyzed lie within a putative transcription factor binding site for transcription factors that are expressed in the liver, and modify the predicted ability of the transcription factor to bind (Table 4). Ten SNPs in high LD with rs247616 produce changes in the putative transcription factor binding sites in which the SNPs reside. These SNPs are found between 10.3kb upstream and 5.4kb downstream of the CETP transcriptional start site. Three SNPs cause a large increase (rs17231506, rs173539) or decrease (rs247616) in the matrix similarity score of transcription factors that are highly expressed in liver with RPKM (reads per kilobase per million reads sequenced) values greater than 25.
Table 4.
SNPs in high Linkage Disequilibrium with rs247616 that alter a putative transcription factor binding site for a factor that is have high RPKM values in liver.
| SNP | LD with rs247616 (R2) |
Distance from CETP start |
Matrix Similarity Score (Major) |
Matrix Similarity Score (minor) |
Gain or Loss |
Transcription Factor |
Median Liver RPKM |
Median Spleen RPKM |
Observed in ENCODE (Y/N) |
|---|---|---|---|---|---|---|---|---|---|
| rs72786786 | 0.78 | −10321 | 0.055 NDa |
0.099 0.029 |
gain gain |
SRF LMO2 |
7.6 1.4 |
20.4 18.6 |
Y N |
| rs12446515 | 1.00 | −8820 | −0.104 −0.134 |
0.017 0.027 |
gain gain |
RREB1 ZFX |
6.6 2.4 |
9.1 4.3 |
N Y |
| rs56228609 | 0.93 | −8070 | −0.018 | 0.053 | gain | NR1D1 | 9.5 | 8.5 | N |
| rs173539 | 1.00 | −7791 | ND | 0.06 | gain | RARA/RXRA | 10.2/25.7 | 22.7/16.4 | N |
| rs247616 | 1.00 | −6245 | 0.014 0.016 −0.128 |
−0.075 −0.019 0.044 |
loss loss gain |
YBX1 CEBPA LIN54 |
75.3 54.4 1.2 |
168 9.9 1.6 |
N N N |
| rs247617 | 1.00 | −5119 | 0.04 −0.027 |
0.076 0.028 |
gain gain |
NR1I2/RXRA TP53 |
21.4/25.7 5 |
0.18/16.4 17 |
N Y |
| rs183130 | 1.00 | −4472 | −0.021 0.067 0.026 |
0.037 −0.097 0.001 |
gain loss loss |
HMGA1 NFKB1 DEAF1 |
5.5 4.9 2.9 |
46.2 13.5 7.6 |
N Y N |
| rs36229491 | 1.00 | −1591 | 0.012 ND |
0.006 0.015 |
loss gain |
HNF1A ZFHX3 |
4.5 1 |
0 1.2 |
N N |
| rs17231506 | 1.00 | −1307 | −0.036 0.047 |
0.059 −0.067 |
gain loss |
HNF4A DEAF1 |
41.6 2.9 |
0 7.6 |
N N |
| rs200751500 | 0.87 | 5439 | 0.013 | 0.03 | gain | KLF4 | 2.1 | 26.4 | N |
-ND − Not Detectable
rs247616 strongly alters the putative binding sites of both Y-box binding protein 1 (YBX1) and CCAAT/enhancer binding protein alpha (CEBPA). Both transcription factors are highly expressed in the GTEx sequenced livers with median RPKM values of 75 and 54, respectively. The matrix similarity scores decrease from a favorable binding prediction of 0.014 and 0.016 with the major allele, to unfavorable scores of −0.075 and −.019, respectively, with the minor allele, indicating a change from potentially favorable binding to strongly unfavorable binding. YBX1 is highly expressed in many tissues, including liver and spleen, as shown in Figure 3. CEBPA expression in liver is highly variable (SD=56 RPKM), but expression is generally higher than in spleen.
Figure 3. Expression of top 5 transcription factors.

Expression is plotted on a log10 axis, expression in liver is shaded in gray. HNF4A shows no expression in spleen.
The minor allele of rs17231506 increases the matrix similarity score for Hepatocyte nuclear factor 4-alpha (HNF4A) from −0.036 to 0.059, indicating a change from an unfavorable binding site to a favorable one. HNF4A is also highly expressed in livers sequenced by the GTEx consortium, and has a median RPKM value of 42 indicating relatively high expression in liver. HNF4A expression was undetectable in spleen (Figure 3). While HepG2 is a hepatic cell line, and does express HNF4A, it is possible that it is not as well expressed as in hepatic tissues, and could explain a lack of effect from rs17231506.
The minor allele of rs173539 further causes an increase in the predicted matrix similarity score for the retinoid X receptor-alpha/retinoic acid receptor-alpha (RXRA/RARA) heterodimer. RARA and RXRA are well expressed in the liver and spleen, with median RPKM values of 10 and 26, respectively, in liver, and 23 and 16, respectively, in spleen (Figure 3). The matrix similarity is below the reported threshold when tested with the major allele, but provides a positive, favorable score of 0.06 for the minor allele. GTEx RNA-seq shows that multiple isoforms exist for RXRA; the expression of the first exon of the only protein coding isoform, which is also the only exon exclusive to the transcript (ensemble.org; ENST00000481739), is expressed 2.4 times more frequently in liver than spleen, indicating that the expression difference of RXRA between the tissues is greater than the difference in total expression would imply.
We used HaploReg v2 to access ENCODE date to corroborate our findings [37]. The predicted transcription factor and SNP interactions that were predicted in ENCODE are noted in Table 4. We find that some potential interactions are observed in ENCODE, but many are not. None of the transcription factors predicted to interact with CETP SNPs are found to bind by ChiP analysis in ENCODE. However, some SNPs such as rs72786786 and rs247617 were found to bind transcription factor CTCF by ChiP.
Coexpression analysis between CETP and transcription factors
We compared the expression levels of 19 transcription factors found to potentially interact with our candidate SNPs (Table 4) with CETP in livers (n=35), and spleens (n=35) sequenced by the GTEx Consortium. Using the R statistical package, we correlated the expression levels of transcription factors by the Kendall tau rank correlation coefficient method to identify concordant and discordant pairs. After adjusting the p-values with the Benjamini-Hochberg correction, no transcription factors showed statistically significant correlation with CETP expression. Additionally, R was used to run a generalized linear model incorporating rs247616 expression with coexpression of CETP and transcription factors. No significant correlations were observed in this test. Multivariate analysis of CETP expression, transcription factor expression, and interacting SNP genotype also resulted in no significant results after multiple test correction. This result indicates that no single transcription factor had sufficient influence to alter hepatic or splenic CETP expression in this group with high significance. A larger set of samples would be required to explore transcription factor interactions.
Reporter gene assays for enhancer activity using luciferase expression
The three SNPs listed above show the strongest indication of playing a functional role in CETP regulation in the liver by interacting with well-expressed transcription factors. We used a reporter assay to examine the effects of rs247616, rs173539, and rs17231506 on expression of a luciferase reporter gene. The results show that rs247616 and rs173539 significantly altered the luciferase expression in both HEK-293 and HepG2. The minor allele of rs247616 produced a 1.7-fold decrease in expression of the reporter compared to the major allele in both cell lines (p<0.001) (Figure 4A). The minor allele of rs173539 induced an over twofold increase in expression over the major allele, again in both cell lines (p=0.003-0.005) (Figure 4B). No significant difference in expression was observed between the major and minor alleles of rs17231506 in HepG2 cells (Figure 4C), with a small reduction observed in HEK-293 cells (p=0.05).
Figure 4. The effect of expression of the luciferase reporter gene on HEK-293 and HepG2 cells.
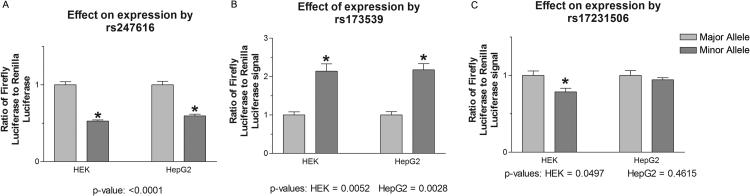
Signals are normalized to the wildtype allele and represent the ratio of the experimental firefly luciferase signal to the renilla luciferase control. A) Significant decrease in expression due to the minor allele of rs247616 in HEK-293 and HepG2 cells, B) significant increase in expression due to the minor allele of rs173539 in HEK-293 and HepG2 cells, C) small but significant decrease in expression due to the minor allele of rs17231506 in HEK-293 cells but no significant effect in HepG2 cells.
Discussion
The luciferase results of this study indicate that both rs247616 and rs173539 may directly play a role in the regulation of CETP. These experiments take the understanding of CETP regulation a step beyond statistical associations indicating that there are molecular mechanisms that can explain some of the genetic regulation of CETP. When coupled with AEI data that demonstrate reduced expression for the minor alleles of these SNPs in high LD with each other [16], it is apparent that in human liver the effect of the minor allele of rs247616 supersedes any effect of rs173539, which may be due to hepatic transcription factors that actually bind to the putative binding sites. Moreover, rs247616 was more strongly associated with measured allelic CETP mRNA expression ratios in the liver than both rs173539 and rs17231506 [16]). As allelic expression ratios are highly sensitive markers of regulatory factors, this finding further supports rs247616 as the main causative variant. Further, analysis of CETP expression in liver and spleen, sequenced by the GTEx consortium, indicates that SNPs in this haplotype block are associated with a significant decrease in CETP mRNA expression in the spleen, with high CETP expression. Failure to detect a significant association of rs247616 with hepatic mRNA expression in GTEx is likely a result of a less pronounced genetic effect compared to that in spleen, confounded by considerable noise in mRNA expression data versus allelic mRNA expression ratios [16]. Since the association of rs247616 with CETP mRNA expression remains significant when all tissues are combined in GTEx, we conclude that the main effect of the minor rs247616 allele is a reduction of mRNA expression across all tissues, consistent with enhanced HDL blood levels [16]. Our results here further emphasize that the high expression of CETP in spleen could suggest a physiological function other than that in lipid metabolism relevant to cardiovascular diseases.
Based on our transcription factor binding predictions we propose a mechanism to account for CETP expression in human tissues. Highly expressed factors YBX1 and CEBPA are unable to bind to the enhancer region containing the minor allele of rs247616 accounting for reduced expression in our reporter gene assay. This effect is somewhat mitigated in the liver by the gain of function of RARA/RXRA in the presence of the rs172539 minor allele. In the spleen, lower expression of the only protein coding isoform of RXRA allows the decrease in CETP expression by rs247616 to be predominant. The expression of CEBPA targeting the rs247616 site is higher in liver than in spleen; however, its expression level is highly variable, which may explain the variation observed in allelic mRNA ratios, noted previously [16]. We propose that rs247616 is the main regulatory variant causing reduced CETP expression in humans. The observation of additional interactions in ENCODE may indicate additional regulatory functions of SNPs in this haplotype block. We cannot exclude that additional SNPs may be involved in regulation in other tissues as well.
Future clinical association studies determining the influence of genetic CETP variants on CAD risk, and residual risk of statin therapy should include rs247616. We suggest that clinical trials of CETP inhibitors determine the status of these CETP variants in patients when analyzing outcomes; however, further work is needed to determine whether additional variants beyond rs247616 and the splicing SNP rs5883 [16,17] exist that determine the overall genetic contribution to CETP activity.
In summary, rs247616 has shown the strongest association with liver allelic expression imbalance (AEI) in our earlier studies [16], reduces expression in a reporter gene assay, and is a lead candidate SNP for the regulation of CETP. Together with our previously reported splicing SNP, rs5883 [17], rs247616 may be an important marker for predicting CETP activity, and directing treatments such as statin therapy or CETP inhibition.
Acknowledgements
This study was supported by NIH grant U01 GM092655, part of the NIH Pharmacogenomics Research Network.
Footnotes
Conflict of interest disclosure:
Dr. Wolfgang Sadee and Audrey Papp have a pending patent application covering SNPs included in this manuscript.
References
- 1.Su AI, Wiltshire T, Batalov S, Lapp H, Ching K a, Block D, et al. A gene atlas of the mouse and human protein-encoding transcriptomes. Proc. Natl. Acad. Sci. U. S. A. 2004;101:6062–7. doi: 10.1073/pnas.0400782101. [DOI] [PMC free article] [PubMed] [Google Scholar]
- 2.Lonsdale J, Thomas J, Salvatore M, Phillips R, Lo E, Shad S, et al. The Genotype-Tissue Expression (GTEx) project. Nat. Genet. 2013;45:580–5. doi: 10.1038/ng.2653. [DOI] [PMC free article] [PubMed] [Google Scholar]
- 3.Drayna D, Jarnagin A, McLean J, Henzel W. Cloning and sequencing of human cholesteryl ester transfer protein cDNA. Nature. 1987;327:632–4. doi: 10.1038/327632a0. [DOI] [PubMed] [Google Scholar]
- 4.Hesler C, Swenson T, Tall A. Purification and Characterization of a Human Plasma Cholesteryl Ester Transfer Protein. J. Biol. Chem. 1987;262:2275–82. [PubMed] [Google Scholar]
- 5.Gordon DJ, Probstfield JL, Garrison RJ, Neaton JD, Castelli WP, Knoke JD, et al. High-density lipoprotein cholesterol and cardiovascular disease. Four prospective American studies. Circulation. 1989;79:8–15. doi: 10.1161/01.cir.79.1.8. [DOI] [PubMed] [Google Scholar]
- 6.Roger VL, Go AS, Lloyd-Jones DM, Benjamin EJ, Berry JD, Borden WB, et al. Heart disease and stroke statistics--2012 update: a report from the American Heart Association. Circulation. 2012;125:e2–220. doi: 10.1161/CIR.0b013e31823ac046. [DOI] [PMC free article] [PubMed] [Google Scholar]
- 7.Murray RK, Granner DK, Rodwell VW. Harper’s Biochemistry. 27th Appleton & Lange; Stamford: 2006. [Google Scholar]
- 8.Inazu A, Brown M, Hesler C, Agellon L, Koizumi J, Takata K, et al. Increased high-density lipoprotein levels caused by a common cholesteryl-ester transfer protein gene mutation. N. Engl. J. Med. 1990;323:1234–8. doi: 10.1056/NEJM199011013231803. [DOI] [PubMed] [Google Scholar]
- 9.Nagano M, Yamashita S, Hirano K-I, Takano M, Maruyama T, Ishihara M, et al. Molecular mechanisms of cholesteryl ester transfer protein deficiency in Japanese. J. Atheroscler. Thromb. 2004;11:110–21. doi: 10.5551/jat.11.110. [DOI] [PubMed] [Google Scholar]
- 10.Barter P, Caulfield M. Effects of torcetrapib in patients at high risk for coronary events. N. Engl. J. Med. 2007;357:2109–22. doi: 10.1056/NEJMoa0706628. [DOI] [PubMed] [Google Scholar]
- 11.Schwartz GG, Olsson AG, Abt M, Ballantyne CM, Barter PJ, Brumm J, et al. Effects of dalcetrapib in patients with a recent acute coronary syndrome. N. Engl. J. Med. 2012;367:2089–99. doi: 10.1056/NEJMoa1206797. [DOI] [PubMed] [Google Scholar]
- 12.Boekholdt SM, Sacks FM, Jukema JW, Shepherd J, Freeman DJ, McMahon D, et al. Cholesteryl ester transfer protein TaqIB variant, high-density lipoprotein cholesterol levels, cardiovascular risk, and efficacy of pravastatin treatment: individual patient meta-analysis of 13,677 subjects. Circulation. 2005;111:278–87. doi: 10.1161/01.CIR.0000153341.46271.40. [DOI] [PubMed] [Google Scholar]
- 13.Kuivenhoven J. The role of a common variant of the cholesteryl ester transfer protein gene in the progression of coronary atherosclerosis. N. Engl. J. Med. 1998;338:86–93. doi: 10.1056/NEJM199801083380203. [DOI] [PubMed] [Google Scholar]
- 14.Regieli JJ, Jukema JW, Grobbee DE, Kastelein JJP, Kuivenhoven JA, Zwinderman AH, et al. CETP genotype predicts increased mortality in statin-treated men with proven cardiovascular disease: an adverse pharmacogenetic interaction. Eur. Heart J. 2008;29:2792–9. doi: 10.1093/eurheartj/ehn465. [DOI] [PubMed] [Google Scholar]
- 15.Marmot MGG, Smith GDD, Stansfeld S, Patel C, North F, Head J, et al. Health inequalities among British civil servants: the Whitehall II study. Lancet. 1991;337:1387–93. doi: 10.1016/0140-6736(91)93068-k. [DOI] [PubMed] [Google Scholar]
- 16.Papp AC, Pinsonneault JK, Wang D, Newman LC, Gong Y, Johnson J a, et al. Cholesteryl Ester Transfer Protein (CETP) polymorphisms affect mRNA splicing, HDL levels, and sex-dependent cardiovascular risk. PLoS One. 2012;7:e31930. doi: 10.1371/journal.pone.0031930. [DOI] [PMC free article] [PubMed] [Google Scholar]
- 17.Suhy A, Hartmann K, Newman L, Papp A, Toneff T, Hook V, et al. Genetic variants affecting alternative splicing of human cholesteryl ester transfer protein. Biochem. Biophys. Res. Commun. 2014;443:1270–4. doi: 10.1016/j.bbrc.2013.12.127. [DOI] [PMC free article] [PubMed] [Google Scholar]
- 18.Barber MJ, Mangravite LM, Hyde CL, Chasman DI, Smith JD, McCarty C a, et al. Genome-wide association of lipid-lowering response to statins in combined study populations. PLoS One. 2010;5:e9763. doi: 10.1371/journal.pone.0009763. [DOI] [PMC free article] [PubMed] [Google Scholar]
- 19.Leusink M, Onland-Moret NC, Asselbergs FW, Ding B, Kotti S, van Zuydam NR, et al. Cholesteryl Ester Transfer Protein Polymorphisms, Statin Use, and Their Impact on Cholesterol Levels and Cardiovascular Events. Clin. Pharmacol. Ther. 2013;95:314–20. doi: 10.1038/clpt.2013.194. [DOI] [PubMed] [Google Scholar]
- 20.Corbex M, Poirier O, Fumeron F, Betoulle D, Evans A, Ruidavets JB, et al. Extensive association analysis between the CETP gene and coronary heart disease phenotypes reveals several putative functional polymorphisms and gene-environment interaction. Genet. Epidemiol. 2000;19:64–80. doi: 10.1002/1098-2272(200007)19:1<64::AID-GEPI5>3.0.CO;2-E. [DOI] [PubMed] [Google Scholar]
- 21.Frisdal E, Klerkx AHEM, Le Goff W, Tanck MWT, Lagarde J-P, Jukema JW, et al. Functional interaction between -629C/A, -971G/A and -1337C/T polymorphisms in the CETP gene is a major determinant of promoter activity and plasma CETP concentration in the REGRESS Study. Hum. Mol. Genet. 2005;14:2607–18. doi: 10.1093/hmg/ddi291. [DOI] [PubMed] [Google Scholar]
- 22.MacLean P, Vadlamudi S. Differential expression of cholesteryl ester transfer protein in the liver and plasma of fasted and fed transgenic mice. J. Nutr. Biochem. 2000;11:318–25. doi: 10.1016/s0955-2863(00)00084-x. [DOI] [PubMed] [Google Scholar]
- 23.Harder C, Lau P, Meng A, Whitman SC, McPherson R. Cholesteryl ester transfer protein (CETP) expression protects against diet induced atherosclerosis in SR-BI deficient mice. Arterioscler. Thromb. Vasc. Biol. 2007;27:858–64. doi: 10.1161/01.ATV.0000259357.42089.dc. [DOI] [PubMed] [Google Scholar]
- 24.Honzumi S, Shima A, Hiroshima A, Koieyama T, Ubukata N, Terasaka N. LXRalpha regulates human CETP expression in vitro and in transgenic mice. Atherosclerosis. 2010;212:139–45. doi: 10.1016/j.atherosclerosis.2010.04.025. [DOI] [PubMed] [Google Scholar]
- 25.Gautier T, de Haan W, Grober J, Ye D, Bahr MJ, Claudel T, et al. Farnesoid X receptor activation increases cholesteryl ester transfer protein expression in humans and transgenic mice. J. Lipid Res. 2013;54:2195–205. doi: 10.1194/jlr.M038141. [DOI] [PMC free article] [PubMed] [Google Scholar]
- 26.Escolà-Gil JC, Julve J, Marzal-Casacuberta À , Ordóñez-Llanos J, González-Sastre F, Blanco-Vaca F. ApoA-II expression in CETP transgenic mice increases VLDL production and impairs VLDL clearance. J. Lipid Res. 2001;42:241–8. [PubMed] [Google Scholar]
- 27.Foger B, Chase M, Amar MJ, Vaisman BL, Shamburek RD, Paigen B, et al. Cholesteryl Ester Transfer Protein Corrects Dysfunctional High Density Lipoproteins and Reduces Aortic Atherosclerosis in Lecithin Cholesterol Acyltransferase Transgenic Mice. J. Biol. Chem. 1999;274:36912–20. doi: 10.1074/jbc.274.52.36912. [DOI] [PubMed] [Google Scholar]
- 28.Marotti K, Castle C. The role of cholesteryl ester transfer protein in primate apolipoprotein AI metabolism. Insights from studies with transgenic mice. Arterioscler. Thromb. Vasc. Biol. 1992;12:736–44. doi: 10.1161/01.atv.12.6.736. [DOI] [PubMed] [Google Scholar]
- 29.Johnson A, Zhang Y, Papp A, Pinsonneault J, Lim J, Saffen D, et al. Polymorphisms affecting gene transcription and mRNA processing in pharmacogenetic candidate genes: detection through allelic expression imbalance in human target tissues. Pharmacogenet. Genomics. 2008;18:781–91. doi: 10.1097/FPC.0b013e3283050107. [DOI] [PMC free article] [PubMed] [Google Scholar]
- 30.Purcell S, Neale B, Todd-Brown K, Thomas L, Ferreira M a R, Bender D, et al. PLINK: a tool set for whole-genome association and population-based linkage analyses. Am. J. Hum. Genet. 2007;81:559–75. doi: 10.1086/519795. [DOI] [PMC free article] [PubMed] [Google Scholar]
- 31.Cartharius K, Frech K, Grote K, Klocke B, Haltmeier M, Klingenhoff a, et al. MatInspector and beyond: promoter analysis based on transcription factor binding sites. Bioinformatics. 2005;21:2933–42. doi: 10.1093/bioinformatics/bti473. [DOI] [PubMed] [Google Scholar]
- 32.Quandt K, Freeh K, Karas H, Wingender E, Werner T. Matlnd and Matlnspector?: new fast and versatile tools for detection of consensus matches in nucleotide sequence data. Nucleic Acids Res. 1995;23:4878–84. doi: 10.1093/nar/23.23.4878. [DOI] [PMC free article] [PubMed] [Google Scholar]
- 33.Rosenbloom KR, Sloan C a, Malladi VS, Dreszer TR, Learned K, Kirkup VM, et al. ENCODE Data in the UCSC Genome Browser: Year 5 update. Nucleic Acids Res. 2013;41:56–63. doi: 10.1093/nar/gks1172. [DOI] [PMC free article] [PubMed] [Google Scholar]
- 34.Kent WJ, Sugnet CW, Furey TS, Roskin KM, Pringle TH, Zahler AM, et al. The Human Genome Browser at UCSC The Human Genome Browser at UCSC. Genome Res. 2002:996–1006. doi: 10.1101/gr.229102. [DOI] [PMC free article] [PubMed] [Google Scholar]
- 35.Kumari S, Nie J, Chen H-S, Ma H, Stewart R, Li X, et al. Evaluation of gene association methods for coexpression network construction and biological knowledge discovery. PLoS One. 2012;7:e50411. doi: 10.1371/journal.pone.0050411. [DOI] [PMC free article] [PubMed] [Google Scholar]
- 36.Benjamini Y, Hochberg Y. Controlling the false discovery rate: a practical and powerful approach to multiple testing. J. R. Stat. Soc. Ser. B. 1995;57:289–300. [Google Scholar]
- 37.Ward LD, Kellis M. HaploReg: A resource for exploring chromatin states, conservation, and regulatory motif alterations within sets of genetically linked variants. Nucleic Acids Res. 2012;40:1–5. doi: 10.1093/nar/gkr917. [DOI] [PMC free article] [PubMed] [Google Scholar]